A Novel Method to Improve the Traffic Cost and Energy
Consumption of Grid Networks based on AHP
Samira Hourali
Computer and Electronic Department, Non Benefit University of Shahrood Shahrood, Iran
Fatemeh Hourali
Network Laboratory, Esfarayen University of Technology
Esfarayen, Iran
ABSTRACT
The problem of Virtual Machine (VM) placement in a compute grid infrastructure is well-studied in the literature. However, the majority of the existing works ignore the dynamic nature of the incoming stream of VM deployment requests that continuously arrive to the grid provider infrastructure. One of the most important objectives of the VM placement algorithm is determine the optimal location of virtual machines in physical servers, So that the minimum number of physical servers to be turned on for enhancing the overall performance of the grid environment. Efficient placement of VMs in PMs (Physical Machines) in grid environment improves resources utilization and energy consumption. In this paper, we employ AHP method to design an integrated VM placement algorithm, called AHP VM Placement (AHPVMP) which can reduce the number of running PMs and lower the energy consumption. Extensive simulation results in GridSim environment show that the proposed algorithm outperforms existing algorithms in terms of traffic cost, SLA, energy and migration.
General Terms
VM Placement, AHP, Traffic Cost, Energy Consumption
Keywords
Energy Consumption, AHP, Migration, PM.
1.
INTRODUCTION
Grid computing architectures have gained more and more attention in recent years, and several vendors are looking at them for feasible solutions to optimize the usage of their own infrastructures [1, 2]. In fact, among several advantages, these solutions offer pools of virtualized computing resources, paid on a pay-per-use basis, and drastically reduce the initial investment and maintenance costs. Hence, the main Grid strength lies in offering computational resources to third-party service providers that do not intend to build and maintain their own IT infrastructure.
Most of physical servers in grid data center use virtualization technology [3]. Based on service level agreement (SLA) with grid providers, the tenants order a group of virtual machines (VMs) which are placed in different hosts and allow communications from each other; each VM requires a certain amount of resources, such as central processing unit (CPU), memory and uplink/downlink bandwidth etc. to maintain the application performance isolation and security. Moreover, virtualization technology enables multiple virtual servers to run on the same physical machine (PM), which is helpful to improve resource utilization and then to reduce energy consumption. Therefore, virtualization can help grid managers achieve orderly and on-demand resource deployment, which
provides an effective solution to the flexible resource management.
VM consolidation raises also several management issues because it tends to an optimal exploitation of available resources, while avoiding severe performance degradation due to resource consumption of co-located VMs. On the one hand, in a more formal perspective and with main focus on optimization issues, several works have already addressed VM consolidation by considering local physical node resource constraints, namely CPU and memory sharing, and several algorithms have been proposed to solve the VM consolidation problem with different objectives, such as increasing load balancing among servers, minimizing the number of powered on servers, and so forth [4]. On the other hand, in a more practical perspective, the deployment of those studies and results in real Grid environments introduces new challenges, by calling for new in-the-field studies to verify their usability and core assumptions. For instance, only a few seminal studies of real power-savings obtainable through VM consolidation for different types of services (CPU and network intensive) are now available and, similarly, in-depth studies about networking issues due to heavy communications between different VMs consolidated over the same physical server are also still missing, especially for new Grid platforms, such as the very recent OpenStack [20].
From a more formal perspective, given a set of hosts with limited resources and a set of VMs with well-defined resource requirements, the grid management infrastructure has to decide both final VM-to-host mappings and alternative VM relocation plan. In fact, VM placement is a continuous process where the management infrastructure periodically checks if a better placement exists and, if that is the case, reconfigures the current configuration through the definition of a new relocation plan. Modifying a pre-existing VM configuration may involve several VM migrations and networks reconfiguration and that, in its turn, introduces an improvement problem, namely, the design of a VM relocation plan useful to bring the DC from an initial state to new desired one. For the sake of clarity, and in order to highlight main optimization goals and constrains, in the remainder we specifically focus on the placement function only.
the DC network infrastructure can introduce tight constraints on the placement due to limited networking capacities; in particular, different aspects, including time-varying traffic demand, network topology, and dynamic multipath routing schema, make the definition and the enforcement of such constraints very difficult in the general case [5, 6].
2.
RELATED WORKS
In the last few years, many research works addressed the problem of power-aware VM placement in grid systems and several industrial are available for energy-efficient dynamic VM provisioning. At the same time, to the best of our knowledge, these solutions do not exploit full awareness of (i) running services, (ii) service providers’ SLA, and (iii) DC status to select the optimal power-efficient placement and to guide the VM reallocation process.
It is generally accepted that Grid power efficiency is an extremely important topic due to both environmental [24] and economic issues [7]: several works strived to reduce the number of powered on servers for the sake of power consumption reduction. [8] is a seminal work that focuses on the provisioning of Grid resources for real-time services: the authors propose SLAs to drive resource allocation, and increase power efficiency by trading off task completion times and powered on servers. In [21], the authors introduce different VM consolidation techniques to reduce Grid power consumption, but the proposed algorithms do not consider service provider SLAs, hence the real-world usage of such solutions can lead to performance degradations.
In [22], assuming that service workload profiles are available, the authors introduce a mathematical model to find the number of physical servers that ensures power efficiency. The proposed solution considers dynamic CPU frequency scaling and details formulas that supply the value of that parameter, but the model assumes that Grid jobs can be partitioned between different physical servers: this assumption, viable in specific scenarios, does not fit well the general VM allocation problem. Finally, Mistral is a solution to optimize both VM performance and power consumption, while also considering transient costs associated with runtime reconfigurations [23]. The authors exploit A*-search techniques to find complex reconfiguration actions, and consider indicators on the stability of the next configuration into the decision process; presented experimental results, obtained in a real Grid test bed, make the proposed solution extremely solid..
In [6], authors study the problem of VM placement with goal of reducing the aggregate traffic into Dc. In [9], authors consider applications made by computation and a storage part and propose a new optimization problem to place them while reducing runtime DC network traffic. In [5], authors propose a new network-aware placement problem that places VMs so to reduce the worst-case load ratio over all network cuts with the main goal of increasing placement stability with time-varying traffic demands; some seminal works are starting to use equivalent capacity notions to co-locate VMs with uncorrelated traffic demands.
In [10] authors consider the placement of VMs and applications in grid environments, while accounting for SLA violations and migration costs; the propose several strategies, based on host power efficiency and First Fit decreasing heuristics, to reach proper trade-offs between performance and power consumption. A large set of shown experimental results confirms that there are interfaces between VM live
migrations and supports the technical validity of p-Mapper. However to the best of our knowledge, authors do not focus on specific service type, but rather assume the existence of a generic function to evaluate that the computed placement is feasible and compiles with agreed SLAs.
In [11], authors focus on CPU-bound batch services: VM placement considers computation only and exploits CPU requirements, while it does not consider any constraint on user interactions. In [12], authors focus on CPU-bound online services by presenting a new optimization model to find the minimum number of physical hosts required to execute a specific workload. The workloads consist of different jobs, each one characterized by a number of requests/second to be processes. Authors assume that it is possible to relate each request with a number of instructions to be executed and use that indicator to handle the placement phase. It is worth noting that, apart from retrieving the minimum number of powered-on hosts, the model proposed by authors also finds the optimal value of the host CPU frequencies. As a possible drawback, authors make the assumption that grid jobs can be arbitrarily split between hosts to meet the required number of requests/second; although that can be viable in some scenarios, it does not fit well in the general VM allocation problem.
3.
ANALYTIC HIERARCHY PROCESS
VM PLACEMENT ALGORITHM
(AHPVMP)
3.1
AHP Method
The Analytic Hierarchy Process (AHP) method consists of three steps: decomposition of the problem, comparative judgment, and synthesis of priorities [13, 14]. Decomposition of the problem deals with a hierarchical schematic representation of the overall objective and the decision alternatives. Comparative judgment includes the formation of the pairwise matrices and their comparison at two levels: i) the level at which all alternatives are compared with respect to each criterion, and ii) the level at which the criteria are compared with respect to the overall objective. The following sub-steps are performed: At level i), a pairwise comparison matrix with quadratic shape ANXN is formed where N corresponds to the number of alternatives. The number of matrices of type A is equivalent to the number of criteria M. An element of matrix A, aij may be assigned any value from the AHP original measurement scale containing the integers from one to nine. The particular number, usually selected by a DM, is used to express the relative importance of a particular criterion when compared across different alternatives. The following condition should always be fulfilled: aij = 1/aji if i ≠ j and otherwise aij = 1. Then, the normalised matrix Anorm is obtained by dividing each element of matrix A in column i by the sum of all elements in the same column i as follows:
(1) Where i = 1, 2,.., N. Next, the matrix of weights, w is computed. For example, the weight for the ith row of the matrix w, wi is determined as the average of elements in row I
of the matrix Anorm as follows:
for i = 1, 2,.., N. (2)
of criteria. At level i) the consistency of the DM’s comparisons is checked by computing the matrix B = AwT
and the value , where bi is the ith element of
matrix B and wi T is the ith element of matrix wT . Then, the
Consistency Index CI is computed as CI = (P − N)/(N −1) and compared with the Random Index RI. The Random Index RI for a given N is provided by the AHP method. At level ii) matrix C instead of matrix A is used to perform the above calculations. If the condition CI/RI ≤ 0.10 is fulfilled, the synthesis of priorities is carried out by computing the overall score for each alternative Si as follows [13, 14]:
(3)
Where vij is the element of a priority vector of the ith
alternative with the jth criterion. Finally, the alternative with the highest overall score is selected as the preferred one. Otherwise, if the required condition is not fulfilled, the procedure of forming the related pairwise comparison matrices should be repeated.
3.2
A Model for Grid Environment
The defined space of grid computing consists of K clusters for processing (service) .m is the number of physical machines that is such as .n is the number of virtual machine per physical server that is shown as
, f . Each physical machine in the grid computing environment has four characteristics that include , where which is based on MI represents the CPU capacity of PMi, which is based on
MB represents the memory capacity of PMi, Other
specifications include IO allocated to the considered VM which is based on B/Sec, and bandwidth of PMi which is
based on (MB/Sec).
For each virtual machine four characteristics are defined as . is processing power of each
virtual machine that is the number of instructions executed by each processing elements of source in terms of million per second (MIPS). and respectively represents the rate of
utilization of memory and input/output, which is calculated based megabyte per second (B /S), represent amount of bandwidth requirement for . Weights of VM’s characteristics are calculated as bellow by eq.4, 5, 6 and 7, sum of this weight must be equal to 1:
CPU_weight j
j j j j
cpu
cpu
m
io
b
(4)
Memory_weight j
j j j
j
m
cpu
m
io b
(5)
_weight j
j j j j
IO
io
cpu
m
io b
(6)
Bandwidth_weight j j j j j
b
cpu
m
io b
(7)
3.3
AHPVMP Algorithm
On each PM, the virtual infrastructure manager create server table, in this table, information of servers providing a service is existing. With addition of each physical server to grid, this table is updated. Servers in the grid can provide one or more services simultaneously. If the server can provide only one service this means that all existing VMs on that server are
located in a cluster and if a server simultaneously provides more than one service this means that as the number of services provided by this server, groups of VMs are existing. The proposed algorithm is as follows:
Fig 1: PM’s Decision Matrix
First the overloaded servers are removed from the table, then by considering the characteristics of each PM (Fig.1), weights of VM’s requirements, using AHP method and taking server table, the best server for placement target VM is determined. Server information is constantly updated. The advantage of this approach is that the VM allocation process is dynamically done based on current condition of environment. By using this algorithm the VM migration is minimized.
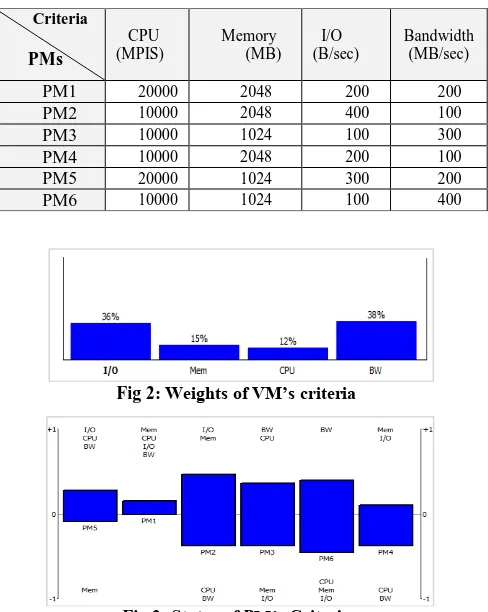
For example if we have 6 PMs with various characteristics as shown in table 1, and the weights of desired VM’s criteria is W= {0.411, 0.29, 0.179, 0.12}, it means the values of CPU, Memory, I/O, bandwidth respectively is 0.12, 0.15, 0.36 and 0.38 and sum of this weights is equal to 1. Suitable PM (PM2) for this VM is obtained as follows (Figures 2, 3, 4 and 5) from AHP method:
Table 1: PM’s characteristics
Fig 2: Weights of VM’s criteria
Fig 3: Status of PM’s Criteria Criteria
PMs
CPU (MPIS)
Memory (MB)
I/O (B/sec)
Bandwidth (MB/sec)
PM1 20000 2048 200 200
PM2 10000 2048 400 100
PM3 10000 1024 100 300
PM4 10000 2048 200 100
PM5 20000 1024 300 200
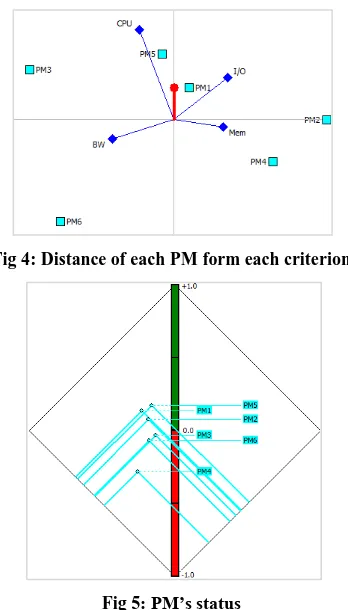
Fig 4: Distance of each PM form each criterion
Fig 5: PM’s status
As shown in Fig.6 According to AHP method the best PM for allocate considered VM is PM2.
Fig 6: Final PM’s ranking with AHP
4.
EXPERIMENTAL RESULTS
We developed a simulator to evaluate the effectiveness of AHPVMP algorithm. It simulates a grid network topology with VMs, hosts, broker and links as a discrete event simulation. Each server is assumed to host at most one VM. VMs run applications that generate network traffic to other VMs, and VMs can migrate from one node to the other. At each time step, network traffic generated by VMs (denoted by an entry in the input traffic matrix) is read and corresponding VMs are mapped to hosts. The corresponding route between the hosts is also calculated based on the consumed network power, the network topology and available link capacities. At each time step of the simulation, we compute power consumption. A new input matrix, that represents the network traffic at that time stamp, is used at each time step of the simulation.
The efficacy of presented algorithm is evaluated in a simulation environment using GridSim [15]. The simulated data center has 1 core switch which connected to 3 aggregation switches, each aggregation switch in turn is connected to 5 edge switches, finally each edge switch is connected to ten PMs to form a partition, totally the data center contains 150 PMs, It is a worth notice that since proposed algorithm is based on the concept of distance and
cost matrix, it can be applied for any topology [19]. The running period is 24 hours to simulate the diurnal pattern of a communication network [17]. The VM and PM configurations are as same as [2], plus that all PMs in a partition have the same configuration.
As in [16, 19] we also use FNSS to generate a cyclo-stationary traffic map which updated every hour. First, the static mean traffic volumes is generated follow a lognormal distribution with standard deviation () equals to 4 to form an environment where some VMs are linked with high traffic [10]. These static volumes then added a zero-mean normal fluctuation value. According to [18], the relation between the standard deviation of this fluctuation () and the mean traffic volumes is:
' ( )
ijt ij
x
(8) As in [19] we also chose = 0.8 and log
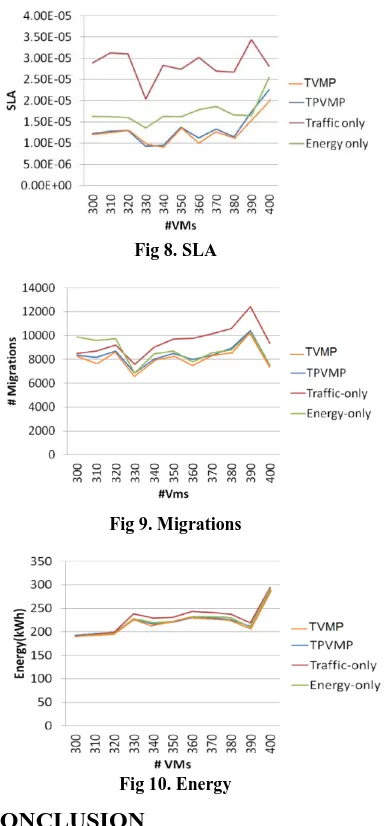
= -0.33 as same as Sprint Europe network. Finally, traffic volumes are multiplied by a sin function with unitary mean to model the daily fluctuation. Based on the mean traffic volumes, VMs are classifying into three categories: network- intensive, CPU-network balance and CPU-intensive servers [19]. The CPU utilization of each VM is then generated correspond to which category it belongs to [19]. In the simulation, the experiment results when AHPVMP, TPVMP, Traffic-only and Energy-only algorithms are applied are compared (Figures.7, 8, 9 and 10).According to Fig.10, AHPVMP respectively saves about 10% and 8% of traffic cost compared to Energy-only and TPVMP algorithms. Proposed method also saves about 35% SLA violation when the number of VM is not so high. When the number of VM is high, there are not many available positions for VM migration, thus cause high energy consumption and SLA violation, but reduce the number of migrations for all algorithms [19]. The number of migrations and energy consumption of proposed method is less than TPVMP, Traffic-only and Energy-only algorithms. As shown in figure 7, the Traffic-only and AHPVMP algorithms respectively save about 33% and 30% of traffic cost, also as shown in figures 9 and 10, Traffic-only, TPVMP and AHPVMP algorithms respectively has 21%, 16%, 10% number of migrations and 12%, 11%, 10% energy consumption.
Fig 8. SLA
Fig 9. Migrations
Fig 10. Energy
5.
CONCLUSION
This paper presents a VM placement algorithm with using AHP method. This allocation is a choice between existing PMs for considered VM, based on the weights of VM’s criteria and all PM’s characteristics. Then, the virtual machines follow a certain sequence to be placed at their preferable physical machines to achieve the profit maximization and heavy communicated virtual machines are hosted by physical machines that located close together. In proposed algorithm virtual machines are consolidated on physical machines with high CPU usage per energy consumption. Result shows that the presented algorithm in this paper is superior in various performance metrics and produces better allocation result considering VM communication, energy consumption, VM’s migration, SLA violation and cost. This VM placement technique also provides minimum node idle time, handle heterogeneous resources and works well for heterogeneous grid computing systems.
6.
REFERENCES
[1] R. Buyya, C.S. Yeo, S. Venugopal, J. Broberg, I. Brandic. 2009. Grid computing and emerging IT platforms: vision, hype, and reality for delivering computing as the 5th utility, Elsevier Future Generation Computer Systems 25 (2009)599–616.
[2] A. Lenk, M. Klems, J. Nimis, S. Tai, T. Sandholm. 2009. What’s inside the Grid? anarchitectural map of the Grid landscape, in: Proc. of the 2009 ICSE Workshop on Software Engineering Challenges of Grid Computing, , pp. 23–31.
[3] Armbrust M, Fox A, Griffith R, et al. 2009. Above the grids: A berkeley view of grid computing. Technical Report UCB/EECS-2009-28. Berkeley, CA, USA: EECS Department, University of California at Berkeley.
[4] S. Lee, R. Panigrahy, V. Prabhakaran, V. Ramasubramanian, K. Talwar, L. Uyeda, U. Wieder. 2011. Validating heuristics for virtual machines consolidation, Technical Report.
[5] Biran, O. et al. 2012. A stable network-aware VM placement for Grid Systems. Proceedings of the IEE CCGride’12, Ottawa.
[6] Meng, X. et al. 2010. Improving the scalability of data center networks with traffic-aware virtual machine placement. Proceedings of the 29 th Conference on Information Communications (INFOCOM’10).
[7] Gartner Says Energy-Related Costs Account for Approximately 12% of Overall Data Center Expenditures:http://www.gartner.com/it/page.jsp?id=144 2113, 2011.
[8] K.H. Kim, A. Beloglazov, R. Buyya. 2009. Power-aware provisioning of grid resources for real-time services, in: Proc. of the 7th International Workshop on Middleware for Grids, Grids and e-Science, MGC 2009.
[9] D.S. Dias and L.H.M.K. Costa. 2012. Online traffic-aware virtual machine placement in data center networks. In Global Information Infrastructure and Networking Symposium (GIIS), pages 1-8.
[10]Ankit Anand, 2013. Adaptive Virtual Machine Placement supporting performance SLAs. A Project Report submitted in partial ful_lment of the requirements for the Degree of Master of Technology In Computational Science, Super Computer Education and Research Centre Indian Institute of Science Bangalore-560 012 (INDIA), 10-23.
[11] Aaron Carroll, Gernot Heiser, 2010. An Analysis of Power Consumption in a Smartphone, USENIXATC'10 Proceedings of the 2010 USENIX conference on USENIX annual technical conference ,21-25.
[12]Calcavecchia, N.M. ; Dipt. di Elettron. e Inf., Politec. di Milano, Milan, Italy ; Biran, O. ; Hadad, E. ; Moatti, Y. 2012. VM Placement Strategies for Grid Scenarios. Grid Computing (GRID), 2012 IEEE 5th International Conference on, 852 – 859.
[13]Saaty T. L. 1980. The Analytic Hierarchy Process: Planning Setting Priorities, McGraw Hill Text, New York, USA.
[14]Winston, W.L. 1994. Operational Research: Application and Algorithms, International Thompson Publishing, Belmont, California, USA.
grid computing environments and evaluation of resource provisioning algorithms”. Softw. Pract. Exper., 41(1):23-50.
[16]Atiq Rehman and M. Hussain. 2011. Efficient grid data condentiality for daas. International Journal of Advanced Science and Technology, 35:1-10, October.
[17]A. Singh, M. Korupolu, and D. Mohapatra. 2008. Server-storage virtualization: Integration and load balancing in data centers. In High Performance Computing, Networking, Storage and Analysis, 2008. SC 2008. International Conference , pages 1-12.
[18]Ismael Solis Moreno and Jie Xu. 2011. Energy-efficiency in grid computing environments: Towards energy savings without performance degradation. IJCAC, 1(1):17-33.
[19]Hieu Trong Vu, Soonwook Hwang. 2014. A Traffic and Power-aware Algorithm for Virtual Machine Placement in Grid Data Center. International Journal of Grid & Distributed Computing, Vol. 7 Issue 1, 350-355.
[20]C. Isci, J.E. Hanson, I. Whalley, M. Steinder, J.O. Kephart. 2010. Runtime demand estimation for effective
dynamic resource management, in: Proc. of the IEEE Network Operations and Management Symposium, NOMS.
[21] A. Beloglazov, R. Buyya. 2010. Energy efficient resource management in virtualized grid data centers, in: Proc. of the 10th IEEE/ACM International Conference on Cluster, Grid and Grid Computing.
[22]H.S. Abdelsalam, K. Maly, R. Mukkamala, M. Zubair, D. Kaminsky. 2009. Analysis of energy efficiency in Grids, in: Proc. of the Computation World: Future Computing, Service Computation, Cognitive, Adaptive, Content, Patterns.
[23]G. Jung, M.A. Hiltunen, K.R. Joshi, R.D. Schlichting, C. Pu, Mistral. 2010. dynamically managing power, performance, and adaptation cost in Grid infrastructures, in: Proc. of the IEEE 30th International Conference on Distributed Computing Systems, ICDCS’10.
[24]Gartner Estimates ICT Industry Accounts for 2 Percent
of Global CO2 Emissions: