Available online on 18.08.2019 at http://jddtonline.info
Journal of Drug Delivery and Therapeutics
Open Access to Pharmaceutical and Medical Research© 2011-18, publisher and licensee JDDT, This is an Open Access article which permits unrestricted non-commercial use, provided the original work is properly cited
Open Access
Research Article
Formulation Development and Evaluation of Floating Wax Beads of
Olopatadine Hydrochloride
Priyanka Baviskar
1*, Prashant Patil
1, Ravindranath B Saudagar
21 Department of Pharmaceutics, R. G. Sapkal College of Pharmacy, Anjanery, Nashik, India
2 Department of Pharmaceutical Chemistry, R. G. Sapkal College of Pharmacy, Anjanery, Nashik, India.
ABSTRACT
In this study, a multiple-unit gastroretentive sustain release drug delivery system of Olopatadine hydrochloride was developed from a completely aqueous environment, avoiding the use of any organic solvent, thus releasing the drug for a prolonged duration of time. Emulsion gelation technique was used to prepare beads. The beads with edible oil were prepare by mixing and homogenizing olive oil and water containing pectin and molten wax which was then extruded in to calcium chloride solution. The effects of carnauba wax on drug entrapment efficiency, floating lag time and morphology and drug release was studied. It was found that carnauba wax was sufficient to sustain the drug release at gastric pH. The results show that these beads can entrap drug in sufficient amount and also can successfully deliver the drug in stomach for a prolong duration of time avoiding the use of any organic solvent.
Keywords: Gastroretentive, Floating Wax Beads, Olopatadine
Article Info:Received 10 June 2019; Review Completed 26 July 2019; Accepted 03 Aug 2019; Available online 18 August 2019
Cite this article as:
Baviskar P, Patil P, Saudagar RB, Formulation Development and Evaluation of Floating Wax Beads of Olopatadine Hydrochloride, Journal of Drug Delivery and Therapeutics. 2019; 9(4-s):569-576
http://dx.doi.org/10.22270/jddt.v9i4-s.3384
*Address for Correspondence:
Priyanka Baviskar, Department of Pharmaceutics, R. G. Sapkal College of Pharmacy, Anjanery, Nashik, India
INTRODUCTION
Oral route of administration is one of the oldest and most extensively used routes for the administration of drug providing convenient method of effectively achieving both local and systemic effect. Various approaches are made in designing the formulations, which will overcome the disadvantages of conventional dosage forms, which include sustained/controlled release drug delivery system.1
Multiple-unit floating systems may be an attractive option since they have been shown to lesser inter- and intra- subject availabilities in drug absorption as well as to lower the chances of dose dumping.2 different approaches of floating
drug delivery system like air compartment multi-unit system, hollow microspheres (microballoons) prepared by
the emulsion solvent diffusion method,3 microparticles based
on low density foam powder, beads prepared by emulsion gelatin method etc. can be distributed widely throughout the GIT, providing the possibility of a longer lasting and more reliable release of drugs. The floating wax beads were prepared by the emulsion gelation method. The formation of beads occurs by the cross-linking of the calcium ions with pectin to form calcium pectinate. The morphology, floating properties, swelling studies, drug content, drug entrapment efficiency and drug release study was carried out. The purpose of the present study was to investigate the effect of incorporated wax, which prepared by the emulsion gelation method on the drug release profile.
MATERIALS AND METHODS
MaterialsOlopatadne hydrochloride was received as generous gift from Aurobindo Pharma LTD. Research Center (A Division of Aurobindo Pharma), Hyderabad. Pectin, Olive oil, Carnauba wax, Calcium chloride used were of laboratory grade and available at institute.
Preparation of floating wax beads
The emulsion of pectin, olive oil and Olopatdine hydrochloride was prepared in distilled water using a high speed homogenizer (IKA T25) at 3000 rpm. The weighed amount of the wax was melted on the water bath at the temperature of more than 50C of melting point of the wax.
Composition of formulation
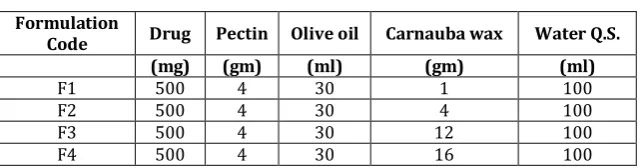
Table 1: Composition of formulation: Formulation
Code Drug Pectin Olive oil Carnauba wax Water Q.S.
(mg) (gm) (ml) (gm) (ml)
F1 500 4 30 1 100
F2 500 4 30 4 100
F3 500 4 30 12 100
F4 500 4 30 16 100
Micromeritic properties
All the prepared formulations of floating beads were evaluated for bulk density, tapped density, Carr's index and Hausner's ratio.5,6
Percentage yield
All the prepared formulations of floating beads were evaluated for the percentage yield by using following formula.5,7
Mass of formulation Bulk Density =
Total volume of formulation
Weight of the powder Tapped Density =
Tapped volume of powder
Tapped Density
Hausners ratio = Bulk Density
Tapped density −Bulk density Carr’s compressibility index = ×100 Tapped density
Determination of drug content and drug entrapment efficiency
50 mg of beads were weighed and crushed in a pastel mortar and the crushed material was dissolved in 25 ml of 0.1 N Hydrochloric acid. The solution was kept for 24 hrs. Volume of this solution was made up to 50 ml with washings of mortar. Then it was filtered. The filtrate was
assayed by spectrophotometically using a UV
spectrophotometer (Schimadzu, UV, 1800). The drug
content and the entraptment efficiency were determined.8
Floating lag time and floating time
The formulated bead sample (n=20) were placed in a beaker filled with 0.1N HCl (pH 1.2) solution. Temperature was maintained at 37 0C. The floating time of beads were
observed for 12 hrs. The preparation was thought of to possess buoyancy in the test solution only when all the beads floated in it. The time the formulation took emerge on the surface of the medium (floating lag time) and the time for which the formulation remains floating on the surface of the medium (floating time) were noted.9
Swelling studies
Beads were studied for swelling characteristics. Only those batches were selected which have good drug content and
loaded beads were taken, weighed and placed in wire basket of USP dissolution apparatus I. The basket containing beads put in a beaker containing 100 ml of 0.1N
HCl (pH 1.2) maintained at 37 0C. The beads were
periodically removed at predetermined intervals and weighed. Then swelling ratio was calculated as per the following formula.10
Ws − Wo
Swelling index = × 100 Wo
Where, Ws = weight of swollen beads, Wo = weight of dried beads
Particle size determination
The particle size of beads was determined by the dry state using optical microscopy method. The stage micrometer and eyepiece micrometer were used for the measurement of the particle size. The size of the beads present in the 1cm3
area of the slide was counted.11
Surface characterization
Surface characterization of beads were examined with a scanning Electron Microscopy (Diya labs, airoli, Mumbai) beads were mounted on metal grids using double-sided
tape and coated with gold under vaccum.12
Differential Scanning Calorimetry (DSC)
The DSC measurements were performed on a DSC 60, Shimadzu, Japan differential scanning calorimeter with thermal analyzer. All accurately weighed samples were placed in a sealed aluminium pans, before heating under nitrogen flow (10 ml/min) at a scanning rate of 100C per
min from 25 to 3000C. An empty aluminium pan was used
as reference.13
Fourier Transform Infrared Spectroscopy (FTIR) The compatibility study was carried out by using Fourier transform infrared spectrophotometer (BRUKER). FTIR study was carried on pure drug and physical mixture of drug and polymer. Physical mixtures were prepared and samples were kept for 1 month at room temperature. Infrared absorption spectrum of Olopatadine hydrochloride
was recorded over the wave number 4000 to 400 cm-1 using
Fourier Transform spectrophotometer. 13, 14
In- vitro drug release study
The release of Olopatadine hydrochloride from sustained release floating wax bead was determined using USP dissolution apparatus I at 50 rpm. The dissolution medium used 900ml of 0.1N HCl (pH1.2) and temperature was maintained at 37 0C. A sample (5ml) was withdrawn from
of the formulation was compared with the 250mg of the
capsule containing 5mg of the drug.4
Best fit kinetic model for optimized formulation The data obtained from study of diffusion kinetics of the optimized formulation was studied to obtain the best fit model. The best fitted model is the one which gives the highest R2 value and least slope value.
Stability study
Stability study of the formulation which gave maximum dissolution rate was carried out to point out any visual physical or chemical change made in the formulation after storing it at elevated temperature and humidity conditions. The optimized formulation was store in ambient colour bottle and stored at 400 C ± 20C and 75% ± 5% Relative
humidity for three months. Floating wax beads was analysed for the drug content.15
Statistical Analysis
Results of ex-vivo experiments are reported as SEM analysis. The classical zero order release curve was found to be linear. The curves plotted according to Higuchi model were also found to be linear. The drug release occurs probably by diffusion and erosion and dissolution. From the above tables it was seen that the best fit model for formulation was Zero order kinetic, such type of model was applicable when sustained release dissolution mechanism are seen.
RESULTS AND DISCUSSION
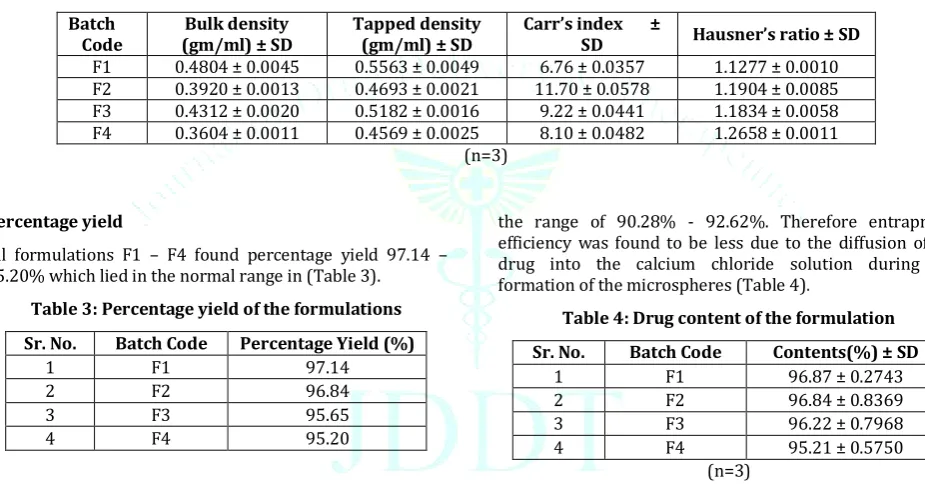
Micromeritics propertiesFrom the study of the micromeritics properties of the formulation it was found that the bulk density of the formulation lied within range of 0.3604 – 0.4804 g/cm3,
tapped density within range of 0.5563- 0.4569. The Carr’s index lies within range of 6.76 – 11.70 and Hausner’s ratio within range of 1.2658 – 1.1277 which indicates that the prepared formulation have good flow property (Table 2).
Table 2: Micromeritics properties of the formulation Batch
Code (gm/ml) ± SD Bulk density Tapped density (gm/ml) ± SD Carr’s index ± SD Hausner’s ratio ± SD
F1 0.4804 ± 0.0045 0.5563 ± 0.0049 6.76 ± 0.0357 1.1277 ± 0.0010
F2 0.3920 ± 0.0013 0.4693 ± 0.0021 11.70 ± 0.0578 1.1904 ± 0.0085
F3 0.4312 ± 0.0020 0.5182 ± 0.0016 9.22 ± 0.0441 1.1834 ± 0.0058
F4 0.3604 ± 0.0011 0.4569 ± 0.0025 8.10 ± 0.0482 1.2658 ± 0.0011
(n=3)
Percentage yield
All formulations F1 – F4 found percentage yield 97.14 – 95.20% which lied in the normal range in (Table 3).
Table 3: Percentage yield of the formulations
Sr. No. Batch Code Percentage Yield (%)
1 F1 97.14
2 F2 96.84
3 F3 95.65
4 F4 95.20
Drug content and drug entrapment efficiency
The percentage drug content of all prepared formulations was found to be in the range of 92.56 – 98.77%. Therefore uniformity of drug content was maintained in all formulations (Table 2). The percentage drug entrapment efficiency of all prepared formulations was found to be in
the range of 90.28% - 92.62%. Therefore entrapment efficiency was found to be less due to the diffusion of the drug into the calcium chloride solution during the formation of the microspheres (Table 4).
Table 4: Drug content of the formulation
Sr. No. Batch Code Contents(%) ± SD
1 F1 96.87 ± 0.2743
2 F2 96.84 ± 0.8369
3 F3 96.22 ± 0.7968
4 F4 95.21 ± 0.5750
(n=3) Floating lag time and floating time
Floating lag time in the range of 1.21 – 1.76 min. and floating time >12hr for all formulations F1-F4. This is due the increase in the concentration of the carnauba wax. (Table 5).
Table 5: Floating lag time and floating time of formulations
Sr. No. Batch Floating lag time (min.) Floating time ( hrs.)
1 F1 1.76 ± 0.04630 > 12
2 F2 1.35 ± 0.09391 > 11
3 F3 1.21 ± 0.00707 > 12
4 F4 1.25 ± 0.04221 > 12
Swelling studies
For all prepared batches (F1-F4), percent swelling ratio was found to be in the range of 10 – 20.66 %. The F1 batch showed the maximum swelling index. This is because of the lipophillic nature of the carnauba wax which affected the swelling of the beads. (Table 6).
Table 6: Swelling Index of formulations
Sr. No. Batch Code Swelling ± SD
1 F1 20.66 ± 0.02471
2 F2 15.3 ± 0.05241
3 F3 14.66 ± 0.0254
4 F4 10 ± 0.01679
(n=3)
Particle size determination
For F1-F4 batches average particle size was found to be in the range of 1.21 – 1.52 mm (Table 7).
Table7: Particle size determination of formulation
Sr. No. Batch Code Particle size (mm)± SD
1 F1 1.51 ± 0.0251
2 F2 2.00 ± 0.0163
3 F3 1.46 ± 0.0258
4 F4 1.27 ± 0.0355
(n=3)
Surface characterization
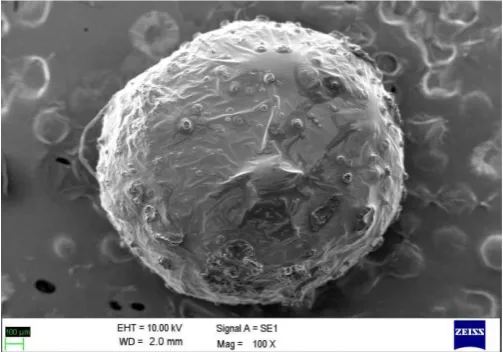
The SEM result showed that the particle size of formulation was found to have regular and spherical shape with rough and uneven surface (Figure 1).
Figure No. 1: Surface morphology of the formulation Differential scanning calorimetric studies
Olopatadine Hydrochloride was compatible with polymer. There is slightly peak broadening in physical mixture of polymer to pure Olopatadine Hydrochloride (Figure 2). Fourier transform infrared spectroscopy FTIR spectrum of the physical mixture shows that there is no interaction between drug and polymer (Figure 3).
Figure No.3: DSC thermogram of formulation
In vitro drug release
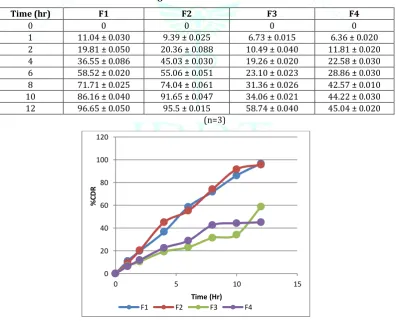
The In vitro drug release study of different formulation maximum drug release 96.65% was shown by F1 batch. The data also suggested that floating beads formulation were capable to produce linear drug release for longer period of
time. Drug release profile of formulation F1 to F4 shown in (Figure No. 4) and dissolution profile F1 to F4 signified sustained drug release. Out of four formulations maximum release after 12 hr was found for F1 formulation. (Table 8 and figure 4)
Table 8: In-vitro drug release of different batches of the formulation
Time (hr) F1 F2 F3 F4
0 0 0 0 0
1 11.04 ± 0.030 9.39 ± 0.025 6.73 ± 0.015 6.36 ± 0.020
2 19.81 ± 0.050 20.36 ± 0.088 10.49 ± 0.040 11.81 ± 0.020
4 36.55 ± 0.086 45.03 ± 0.030 19.26 ± 0.020 22.58 ± 0.030
6 58.52 ± 0.020 55.06 ± 0.051 23.10 ± 0.023 28.86 ± 0.030
8 71.71 ± 0.025 74.04 ± 0.061 31.36 ± 0.026 42.57 ± 0.010
10 86.16 ± 0.040 91.65 ± 0.047 34.06 ± 0.021 44.22 ± 0.030
12 96.65 ± 0.050 95.5 ± 0.015 58.74 ± 0.040 45.04 ± 0.020
(n=3)
Figure No.4: Drug release profile of formulations F1-F4
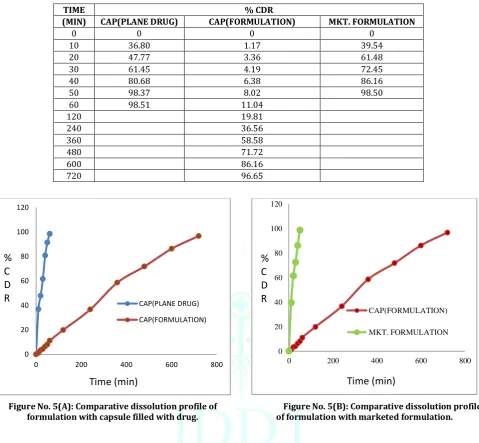
From the comparative study of the formulation with capsule containing the dose of 5 mg of Olopatadine hydrochloride, it was found that the capsule containing drug showed the 98.51% drug release within 60 mins. and marketed
formulation showed the 98.50% drug release within 50 min. while the prepared formulation (F1 Batch) showed maximum drug release up to 96.65 % within 12 hrs. (Table 9 and figure 5 (A),(B))
0 20 40 60 80 100 120
0 5 10 15
%C
D
R
Time (Hr)
Comparative dissolution profile of the formulation with marketed formulation
Table 9: Comparative dissolution profile of the formulation with marketed formulation
Figure No. 5(A): Comparative dissolution profile of
formulation with capsule filled with drug. of formulation with marketed formulation.Figure No. 5(B): Comparative dissolution profile
Kinetic model for F1 batch
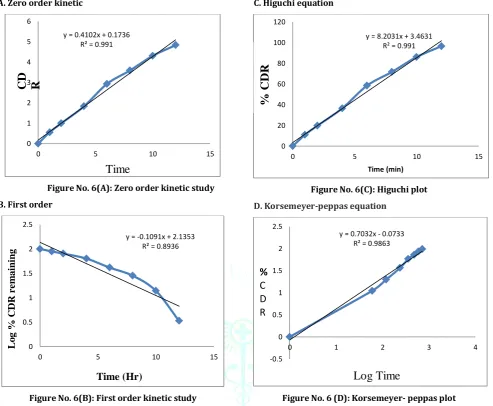
In order to investigate the mode of release from floating beads data were analysed with following mathematical model.
A. Zero order kinetic B. First order kinetic C. Higuchi equation
D. Korsemeyer-peppas equation
The classical zero order release curve was found to be linear. The curves plotted according Higuchi model were also found
to be linear. Korsemeyer-Peppas release curves R2 was found
to be ≥ 0.965 for all 4 formulations. The drug release occurs probably by diffusion and erosion and dissolution. After comparing the coefficient of regression (r2) values of different kinetic models, drug release kinetics for optimized floating beads best fitted in Zero order kinetic release followed by Higuchi such type of model was applicable when sustained release dissolution mechanism are seen (Table 10 & Figure 6: (A), (B), (C) and (D) ).
Drug release by using different models by F1 batch
Table 10: Drug release by using different models by F1 batch
Batch Kinetic Model
F1 Zero
Order Order First Higuchi Model Korsemeyer-peppas
R2 R2 R2 R2
0.991 0.893 0.991 0.986
0 20 40 60 80 100 120
0 200 400 600 800
CAP(PLANE DRUG)
CAP(FORMULATION)
Time (min)
%
C
D
R
0 20 40 60 80 100 120
0 200 400 600 800
CAP(FORMULATION)
MKT. FORMULATION
%
C
D
R
Time (min)
TIME % CDR
(MIN) CAP(PLANE DRUG) CAP(FORMULATION) MKT. FORMULATION
0 0 0 0
10 36.80 1.17 39.54
20 47.77 3.36 61.48
30 61.45 4.19 72.45
40 80.68 6.38 86.16
50 98.37 8.02 98.50
60 98.51 11.04
120 19.81
240 36.56
360 58.58
480 71.72
600 86.16
A. Zero order kinetic
Figure No. 6(A): Zero order kinetic study B. First order
Figure No. 6(B): First order kinetic study
C. Higuchi equation
Figure No. 6(C): Higuchi plot
D. Korsemeyer-peppas equation
Figure No. 6 (D): Korsemeyer- peppas plot
Stability study
The sample were withdrawn after 1, 2 and 3 months and subjected to following tests a shown in. The accelerated stability studies (carried for 3 months), at temperature of 40 C 0 ± 2 C and % RH 75% ± 5% RH indicated that the
developed 0 floating pectinate microspheres were unaffected after 03 months storage under accelerated condition as no change was observed in the appearance and colour of the formulation. On the basis of these results, it may be concluded that the F1 formulation developed is stable under accelerated condition of 03 months (Table 11).
Table 11: Details of stability study for F1 batch
Test Before After
0 month 1 month 2 month 3 month
Drug release 96.65 ± 0.246% 96.61 ± 0.236% 93.58 ± 0.254 92.55 ± 0.251
Floating lag time >12 hrs >12hrs >12hrs >12hrs
CONCLUSION
From the above study it may be concluded the use of hydrophobic carriers like waxes can be done for achieving the sustain release action. The low density materials like oils were used to attend the floating of the formulation. The study also suggested that the floating wax microspheres can be implemented as a suitable drug carrier for sustaining the release of the drugs with short biological half life.
ACKNOWLEDGEMENT
The authors are thankful to the Aurobindo Pharma LTD. Research Center for providing the gift sample of the drug and Principal of KCT's, R. G. Sapkal College of Pharmacy, Anjaneri, Nashik for providing the facilities at college.
CONFLICT OF INTEREST
Authors declare that they do not have any conflict of interest.
y = 0.4102x + 0.1736 R² = 0.991
0 1 2 3 4 5 6
0 5 10 15
Time
(Hr)
CD
R
y = -0.1091x + 2.1353 R² = 0.8936
0 0.5 1 1.5 2 2.5
0 5 10 15
Time (Hr)
Lo
g
%
C
D
R
r
e
m
ai
n
in
g
y = 8.2031x + 3.4631 R² = 0.991
0 20 40 60 80 100 120
0 5 10 15
Time (min)
%
CD
R
y = 0.7032x - 0.0733 R² = 0.9863
-0.5 0 0.5 1 1.5 2 2.5
0 1 2 3 4
Log
Time
%
REFERENCES
1. Khavare NB, Dasankoppa FS, Najundaswamy NG. A Review on
Key Parameters and Components in Designing of Osmotic Controlled Oral Drug Delivery Systems. Indian Journal of Novel Drug Delivery 2010; 2(4): 122 – 31.
2. Sungthongjeen S, Paeratakul O, Limmatvapirat S,
Puttipupathachorn S. Preparation and in-vitro evaluation of multiple-unit floating drug delivery system based on gas formation technique. Int J Pharm 2006; 324: 136-43.
3. Sato Y, Kawashima Y, Takenchi H, Yamamoto H.
Physicochemical properties to determine the buoyancy of hollow microspheres (microballoons) prepared by the emulsion solvent diffusion method. Eur J Pharm Biopharm 2003; 55: 297-304.
4. Bairagi PD. et. al. (2018),Formulation development and
evaluation of floating wax microspheres of Tizanidine Hydrochloride: Asian Journal of Pharmacy and Pharmacology 2018,4(5),pp. 673-679.
5. Patel RP, Baria AH. 2009. Stomach-specific Drug Delivery of
Famotidine Alginate beads. International Journal of Pharma Tech Research, 1:288-291.
6. Unites State Pharmacopoeia. 2008. Water solid interaction of
Pharmaceutical systems, the official standard, Volume 1: pp.177-179, 710, 1460-1462.
7. Tekade BW, Jadhao UT, 2014, Formulation and Evaluation of
Metclopramide Hydrochloride Sustained Release Microsphere, Research and Reviews. Journal of Pharmacy and Pharmaceutical and Pharmaceutical Science, 1:22-31.
8. Azhar Danish Khan*, Meenakshi Bajpai 2011, Formulation and
Evaluation of Floating beads of Verapamil hydrochloride, International Journal of PharmTech Research, 3:pp1537-1546
9. Jaiswal D, Bhattacharya A. 2009. Formulation and Evaluation
of Oil Entrapped Floating Alginate Beads of Ranitidine Hydrochloride. International Journal of Pharmacy and Pharmaceutical Science, 1:128-140.
10. Gareeb MM, Radhi ZA. 2014. Formulation and In-Vitro
Evaluation of Trimetazidine Dihydrochloride Floating Beads. International Journal of Pharmacy and Pharmaceutical Sciences, 6:456-460.
11. Fursale RA, Patil GB. 2009. Study of Multiparticulate Floating
Drug Delivery System prepared by Emulsion Gelation Technique. International Journal of Chem Tech Research, 1:162-167.
12. Khan AD, Bajpai M. 2011. Formulation and Evaluation of
Floating Beads of Verapamil Hydrochloride. International Journal of Pharma Tech Research, 3:pp.1537-1546.
13. Gupta R, Meenakshi B. 2013. Influence of formulation
parameter on Tizanidine hydrochloride nanoparticle. International Journal of Pharma and Bio Sciences, 4(2):1056-1078.
14. Pavia DL, Lampan GM. 2007. Spectroscopy, 9 Ed. Cennage th
Learning Pvt. Ltd.; pp.23-93.
15. ICH Harmonised Tripartite Guidelines, International
Conference on Harmonisation, Stability Testing of new drug substances and products Q1A(R2) and evaluation for stability