Promising Techniques for Anomaly Detection on
Network Traffic
Hui Tian1,2, Jingtian Liu1 and Meimei Ding1
1 School of Electronics and Information Engineering, Beijing Jiaotong Univeristy
tianhh@gmail.com, {16120019, 15120019}@bjtu.edu.cn 2 School of Computer Science,
University of Adelaide
Abstract. In various networks, anomaly may happen due to network breakdown, intrusion detection, and end-to-end traffic changes. To detect these anomalies is important in diagnosis, fault report, capacity plan and so on. However, it’s challenging to detect these anomalies with high accuracy rate and time efficiency. Existing works are mainly classified into two streams, anomaly detection on link traffic and on global traffic. In this paper we discuss various anomaly detection methods on both types of traffic and compare their performance.
Keywords: diffusion wavelet, principal component analysis, anomaly detection.
1.
Introduction
Traditional studies on network traffic mainly focused on single-link traffic analysis in temporal domain within an ISP network. At present, researchers have made great progress in the research on self-similar stochastic processes, long-range dependence, heavy-tailed distributions, and so on. However, most of these researches focus on partial links [1] or limited number of Internet terminals, regarding network traffic as a time-domain signal. But analysis on signal link or several links only is not enough to capture traffic characteristics of the global network accurately.
Many researchers start to study the global network data in recent years. The global network data can be described by a Traffic Matrix (TM) where each component in the matrix represents an end-to-end traffic flow. There have been many anomaly detection approaches for global traffic or partial end-to-end flows in TMs, statistic-based, traditional wavelet-based, machine learning, data mining, neural network, and so on. We will introduce anomaly detection methods in both scenarios and compare their performance.
network security. The third type is due to the change of end-to-end user demands, which does not bring direct harm to the network. But detection on this is beneficial to network prediction and capacity plan etc. In this paper, anomaly detection targets the first two types of anomalies.
We proposed Diffusion Wavelet (DW)-based and Principal Component Analysis (PCA)-based anomaly detection methods. These two methods are efficient in detecting global traffic anomaly when TMs are available. These two techniques are based on different ideas, but both are effective for sparse matrix analysis. We will compare their performance in experiments and discuss their promising applications. The main contribution of the paper are listed as follows.
Various anomaly detection methods are introduced and their detection accuracy rate are all analyzed.
Two promising techniques for global network anomaly detection are given in details.
The experiments are conducted to compare all methods and their application scenarios and performance are analyzed.
The remainder of the paper is organized as below. In 2nd section, we introduce all related works. Section 3 gives a detailed introduction on techniques used in temporal netflow for partial links. Section 4 introduces several schemes used in anomaly detection for global network traffic. DW-based technique and PCA-based technique are given in details. Section 5, we describe the test network and define a metric for comparing all algorithms’ performance. Conclusion is given in the last section.
2.
Related Works
Before our work in traffic data analysis, Chandola and Baerjee et. al have discussed anomaly detection techniques in different research areas and application areas in [22]. They defined the anomaly detection problem as the problem of identifying patterns in data that do not conform to a well-defined notion of a normal behavior. They listed the challenges of anomaly detection though it appears to be simple problem, which includes, anomaly pattern’s vague boundary, malicious actions’ fake normal behavior, availability of validated training sets, different abnormal criterion in different scenarios and so on. Therefore they’ve done an extensive survey on existing techniques and application domains. These included classification-based, clustering-based, information theory-based, statistics-based techniques. The application areas covered cyber-intrusion detection, fraud detection, medical anomaly detection, industrial damage detection, image processing, textual anomaly detection, and sensor networks.
Existing work on detecting anomaly locally mainly set a prober in a particular position in the network. The anomaly is not hard to be detected based on local data flow analysis by using existing techniques mentioned in above survey papers or more recent papers. We study the performance of a representative method based on statistical data, Generalized Left-to-right Reduce (GLR) [2, 3, 9]. When the end-to-end traffic matrix is known which means a global view of traffic may be available for the system, it’s valuable to develop methods to detect anomalies for the global traffic data. In this case, more complicated analysis is involved. Existing work include methods based on Relative Entropy [4], Sketch [5], Non-negative Matrix Factorization (NMF) [6], Principal Component Analysis (PCA) [20], Diffusion Wavelets [7, 8].
We will compare all mentioned techniques and evaluate their performance by detection accuracy rate in this paper.
3.
Anomaly Detection for Temporal Traffic Flows
In this section, we briefly give an introduction on anomaly detection for temporal traffic flows. This includes mainly statistics-based anomaly detection for single-link data [2], wavelet transform-based analysis used for several monitored links [3], and Relative entropy based anomaly detection method [4]. We discuss their advantages and disadvantages, and finally introduce how these techniques could be combined with new methods for global data anomaly detection.
G. X. Jia et al. proposed an anomaly detection method on time-series network flow data [2]. They firstly study flow data with 5-minute interval to study network traffic characteristic sequence. Then, the historical sequence of anomaly degree can be figured out by computing anomaly degree on subsequent network traffic characteristic within each time window. Lastly, anomaly is detected by comparing the anomaly degree at current moment with historical data. Network anomaly can thus be detected and alarmed in time. The method is effective for Distributed Denial of Service (DDoS), Worm virus and other intrusion attacks in data flow. It works for single network flow analysis while not for global network traffic. The main benefit is it may guarantee its efficiency in monitoring the specific links, the limitation is that it cannot detect anomaly happened in other location of the networks.
Anomaly is detected according to the variable and threshold. The method is effective for temporal data flow of limited links. It is not sensitive to other links’ traffic changes.
Relative entropy based anomaly detection method is proposed by D. Y. Zhang et al. in [4]. The change of network traffic can be reflected well by information entropy. First, fractal dimension and lamination are applied to network parameters. Then, the sequence on entropy of network parameters are studied within a moving window. Lastly, anomaly can be detected by comparing relative entropy with a threshold.
There are other techniques for link data anomaly detection [14-16], which are not as timely and efficiently as listed above. All these techniques regard traffic as a one-dimensional signal in temporal domain. But in practice, many traffic volume anomalies at the link traffic level may occur at one or more links. They are often overwhelmed within normal traffic patterns, caused by the high level of traffic volume aggregation on backbone links. Therefore, it is quite hard to discover anomalies at the link level. We thus mainly analyze global traffic and detect anomaly for more complicated data collected in end-to-end terminals. These cannot be attained by above mentioned techniques which are mainly developed for one-dimension temporal data.
We study techniques for global traffic [5, 6] and compare them with two promising techniques proposed in our papers [7, 8, 20]. For anomaly detection on global traffic, time efficiency is a big concern due to the huge amount of data and the time cost in collecting and dealing with these data. Thus the complexity of the algorithms developed for global data anomaly detection is a critical criteria to measure the performance of proposed techniques. Existing techniques and our proposed techniques will be studied in the same view of accuracy rate and complexity in this paper.
4.
Anomaly Detection on Global Traffic
We first introduce existing anomaly detection methods for global data, and then describe how diffusion wavelet-based technique and Principal Component Analysis (PCA)-based technique are applied in global traffic data analysis for anomaly detection.
4.1. Existing Anomaly Detection Methods
Sketch based network anomaly detection approach is proposed in [5]. A. Li et al. build compact summaries of the traffic data using the notion of sketches. They record the key network traffic information into summary data structure in every circle online. An IP address traceability network anomaly detection method is proposed in this work. First, network traffic is represented as sketch information in every circle. Forecast value is produced by Exponentially Weighted Moving Average (EWMA) in every circle. Then, error sketch between the observed value and the forecast value can be figured out. Lastly, anomaly is detected according to mean standard deviation of the error sketch. The approach can be well applied to DDoS attack.
employing Shewhart control chart based on reconstruction error. The method is applicable to one or multi-dimensional data.
4.2. DW-Based Anomaly Detection Method
Diffusion Wavelet (DW) based anomaly detection method is explored in [7, 8]. DW is an effective Multi-Resolution Analysis tool suitable for the global TMs. In comparison with traditional wavelets, DW has the following advantages. Firstly, TMs are sparse matrices, a small number of DW coefficients preserves the most energy of the original TM. TMs’ property can be represented by this small number of DW coefficients efficiently. Secondly, the error between the reconstructed TM and original TM is in order of 10−9 which is extremely small. Thirdly, DW is closely related to network topology, because the diffusion operator is obtained by the Laplacian of network adjacency matrix. The transformed matrices imply the information of network topology. This allows DW to be developed in applications of anomaly localization.
The TM is in high dimension usually. By doing DW transform, the original TM can be resolved into matrices in low dimension, where V denotes the approximation matrix and W the detail matrix after DW transform. We apply 2-dimension DW to TM analysis. W. Willinger etc. have proved that 15% of the DW coefficients can preserve over 90% of the TM energy on average in [10], therefore the characteristic of the original TM can be represented accurately by a small quantity of coefficients, which are considered as the most significant metrics. Because of this important property of the TM matrix, sparsity, DW-based methods and PCA-based methods can work efficiently. The ratio of the energy retained in the coefficient matrix to the energy of the original TM is defined as energy proportion P:
TMEnergy represents the energy of the original TM and CEnergy corresponds to the energy of the coefficient matrix. 𝜆𝑗is the eigenvalue of the original TM and 𝜆𝑖 corresponds to the coefficient matrix. To explore energy proportion occupied by various levels, we conduct experiments where 20000 TMs are used. The energy proportion occupied by the 1st~5th level approximate coefficient matrices are denoted by 𝑃𝑉𝑉1,
𝑃𝑉𝑉2, 𝑃𝑉𝑉3, 𝑃𝑉𝑉4, and 𝑃𝑉𝑉5 respectively. 𝑃𝑊𝑊4and 𝑃𝑊𝑊5 correspond to the energy
where the approximate matrix is in lower dimension and contain useful information though.
In paper [7], we studied different diffusion operators and their applications in diffusion wavelets. In paper [8] we proposed a method where the anomalies of single-node disconnection and Distributed Denial of Service (DDoS) attack can be detected by using the anomaly degree based on DW coefficients. Based on the analysis results by DW, Hurst index and dynamic thresholds are used to improve the detection performance. Hurst index can be regarded as the most significant parameter to reflect the self-similarity characteristic of network traffic. This procedure is shown in Fig. 1.
Fig. 1. Procedure in DW-based technique
Dynamic threshold may be further combined with long-range dependence (LRD) [18] with short-range dependence (SRD) [19] in order to improve high detection rate and low false alarm rate. In this case, a higher computation complexity would be involved. Thus, all detection techniques have to be find a balanced traded-off between the accuracy rate and the complexity. The anomaly detection performance of DW-based methods will be compared with all other methods in the following section.
4.3. PCA-Based Anomaly Detection Method
Similar to DW, PCA also works well for a sparse TM in large dimension. PCA is an algorithm for dimension reduction and multivariate analysis. It was first applied in data compression, image processing, neural networks, data mining, and pattern recognition. The widespread use of PCA is mainly due to its three significant characteristics. First, after high-dimensional data is compressed into a set of low-dimensional data, the mean square error of the reconstructed data is inversely proportional to the dimension. Second, the model is stable without adjusting parameters in the process. Third, for given parameters, compression and decompression are easy to conduct.
and DDoS attacks in a backbone network by selecting two significant parameters from OD flows. This approach is able to detect not only single-node anomalies but also multi-node anomalies by parameter improvement, with a high accuracy rate and a low false-alarm rate.
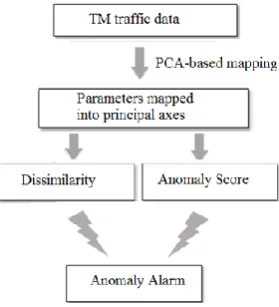
For a TM where each component represents an OD traffic flow, PCA works as a coordinate transformation scheme [17] that maps a given high-dimensional set of samples onto new axes, called principal axes or principal components. The principal components have the following features. The first principal component lies in the direction of maximum variance of the samples. The second principal component corresponds to the direction of maximum variance in the remaining data, except for the variance represented by the first component. The other principal components obtain the maximum variance within the remaining data. All these principal components are orthogonal. Thus, the principal axes are sorted by the amount of data variance that they capture, in descending order.
Fig. 2. Procedure in PCA-based technique
As in Fig. 2, we then define two parameters: Dissimilarity, dand Anomaly Score, R.
R represents the degree to which the projection of the sample to the 1st principal axis
deviates from the mean state 1
1 1 1
,i i
M , j j u R
u
M
where i, j=1,2, ⋯, 12.u1,idenotes the projection of a sample at the i-th instant onto the 1st principal axis. The parameter di is defined as the mean value of the dissimilarity between the sample at time 𝑖 and anyother sample, given by
1 1
1
i i j
M j
d d( n ,n )
M
where i, j=1,2, ⋯, 12, i≠j, M=12, and5.
Network Model and Comparison
All above methods work in different scenarios, but their performance can be compared. This section will introduce the testing network and also the metrics to measure their performance.
5.1. Network Model
To compare all above methods, we use the below Abilene network in Fig.3. The Abilene network topology [25] is the backbone network in America, where each node denotes an American state and each edge describes the amount of flow between two nodes. There is an open source for traffic flow recorded in Abilene website for research purpose. Many routing and management algorithms are tested by using data from Abilene network.
Fig. 3. Network topology of Abilene
TM describes traffic volume from one end in a network to another during regular interval, which is generally denoted by a two-dimensional data structure Tt(i, j) that
represents the traffic volume from node i to node j during the interval [t, t+△t).
traffic may affect the detection result. If the window is too short, PCA is applied more frequently, resulting in a massive time overhead.
After having such a TM of size 144*12, we apply PCA to project this high-dimension data to 1st principal axis, 2nd axis, and so on. In most cases 1st principal axis’ projection is good enough to conduct an effective detection in our experiment. We then study the similarity of projected data in low dimension as described below.
5.2. Similarity of Data
All above methods are tested on the same datasets, however, the testing results may vary if using the datasets of different days. The testing results, though comparable in performance, are found to be sensitive to the testing data no matter which method is used. The anomaly is recognized based on statistics of all past datasets, so it’s important to study the property of the historical datasets.
We use the similarity to describe the property of the datasets and study their Probability Density Function (PDF). The similarity measures how similar the datasets are. If the similarity of the data is greater, the data distribution is more concentrated, depicting as a slender bell-shaped curve. Similarity of original data 𝜏 can be described by the ratio of the peak H of PDF to the width W of 98% confidence interval.
H W
(2)
PDF is denoted by
2 2 ( )
2 1 ( )
2 x
f x e
(3)
Where x denotes data value, 𝜇denotes mean value of data, and 𝜎 denotes standard deviation of data. It is discovered that when x equals to 𝜇, the maximum of probability density is achieved, that is, H1/ 2. So the value of H is related to standard deviation.
The similarity measured by 𝜏 describes the property of original data. The detection accuracy rate is supposed to be higher if the training data are more similar. This has been shown by using PCA-based method as an example in Table 1.
Table 1. Similarity and accuracy rate
L
1
2
Accuracy Rate1h 100 100 100 93.87%
2h 94.36 86.00 86.00 90.95%
3h 77.57 80.70 77.57 84.26%
4h 63.88 69.35 63.88 66.39%
5h 63.45 60.01 60.01 60.12%
statistic parameters, which is represented by =min{ 1, 2}. Parameters 𝜏1 and 𝜏2 are
calculated based on R and d respectively, through studying on traffic volume within different moving windows. L denotes the width of moving window. The sampling interval of TM is 5 minutes. If L is larger, the data are more likely to fluctuate, which means, the similarity of the data within the window is smaller. Table 1 gives the standardized 𝜏1 and 𝜏2, and their corresponding accuracy rate.
The accuracy rate of anomaly detection varies as the original data changes. They are sensitive to the similarity of the original data as we assumed beforehand. The more similar the original data is, the easier the anomaly may be detected. Experiments on PCA-based method clearly show this. This is the same as the results demonstrated in existing methods in [5-8].
From Table 1, it is also seen that PCA based anomaly detection method gives acceptable accuracy result for data with the similarity 𝜏1 greater than 77.57. When the
similarity of original data is too small, the accuracy rate is very low. In this case, we can reduce the window width to improve the accuracy. This, however, affects the time efficiency because the PCA analysis is running at a certain complexity within a small time period and then move forward. The anomaly detection is thus running slowly.
5.3. Comparison Metrics
Now with the same similarity of the data, we compare the detection performance of different methods in Abilene network. The results are shown in Table 2. The application scenarios show which scenarios the method is applicable to. There are four metrics used to compare different methods, computational complexity, detection rate, false alarm rate, and accuracy rate. They are defined based on four types of reports.
True Negative, TN, means the normal sample is reported to be normal. True Positive, TP, means the abnormal sample is reported to be abnormal. False Negative, FN, means the abnormal sample is reported to be normal. False Positive, FP, means the normal sample is reported to be abnormal.
The detection rate counts the ratio that the anomaly is detected among all the abnormal samples, that is, Detection Rate = TP/(TP+FN). The false alarm rate gives the ratio that the number of FP samples to the total number of normal samples, False Alarm Rate = FP/(TN+FP). The accuracy rate shows the ratio that the number of correctly reported samples to the total number of samples, that is, Accuracy Rate = (TP+TN)/(TP+TN+FP+FN).
Table 2. Comparison of anomaly detection methods
In practice, we may select the anomaly detection method based on above comparison results. It is always wanted to have a method which is in low complexity and false alarm rate and high detection and accuracy rate. However, in practice, we have to find a trade-off among these methods according to requirements on time efficiency, computation complexity and accuracy rate.
6.
Conclusion
Anomaly detection in backbone networks attract more and more attention due to the increasing concerns of network security. In this paper, we introduce various methods for anomaly detection on single-link and global traffic. Compared with single-link traffic monitoring, anomaly detection on the whole network is more meaningful, but also more difficult. Among all these methods for global traffic, we prove that DW-based and PCA-based methods [7, 8] are the most promising methods. Based on our experiments
Method Complexity Detection Rate
False Alarm Rate Accuracy Rate Application scenarios Netflow Time-series Based [2]
2 (n )
96.39% 4.42% 95.07%
One-dimension data Anomaly Detection Signal Analysis Based [3]
2 (n)
98.15% 5.04% 96.94%
1-dimension data anomaly detection Relative Entropy Based [4]
(nKlog )n
89.57% 4.83% 89.06%
multi-dimension data anomaly detection
Sketch Based [5]
2 (n log )K
95.07% 10.61% 90.72%
multi-dimension data anomaly detection
NMF Based
[6] (nKDT) 94.36% 7.94% 90.18%
1 and multi-dimension data anomaly detection
DW Based [7, 8]
2 2 (n log n)
93.78% 12.55% 88.78%
2-dimension traffic matrix anomaly detection and localization
PCA Based
[20] (Kn2) 100% 6.02% 94.27%
results, they both can deal with global TM of the network powerfully. According to the same metric tested on the same test data in Abilene network, the PCA-based method shows the best performance for anomaly detection on global traffic data. But the results are sensitive to the time window. For a better accuracy, the time window cannot be too wide. It is found the samples usually should be formed within 3 hours to form its basis. This makes PCA-based method not so time efficient. DW-based methods are potential to be developed in anomaly localization. The other important parameter may be used based on DW-based analysis results, such as Hurst parameter, which shall improve its accuracy rate.
Acknowledgement. This work is supported by Research Initiative Grant of Australian Research Council Discovery Projects funding DP150104871, Beijing natural science funding No. 4172045.
References
1. Zhang Y., Ge Z., Diggavi S.: Internet Traffic and Multiresolution Analysis. Markov Processes and Related Topics. A Festschrift for Thomas G. Kurtz. Institute of Mathematical Statistics, 215-234. (2008)
2. Jia G. X., Yang B., Chen Z. X., and Peng L. Z. L.: Detecting network anomalies based on NetFlow time series. Computer Engineering and Applications. (2006)
3. Barford P., Kline J., Plonka D., and Ron A.: A signal analysis of network traffic anomalies. Proceedings of Internet Measurement Workshop, 71-82. (2002)
4. Zhang D. Y.: Network traffic anomaly detection based on relative entropy. Journal of Nanjing University of Posts and Telecommunications. (2012)
5. Li A., Han Y., Zhou B., Han W., and Jia Y.: Detecting hidden anomalies using sketch for high-speed network data stream monitoring. Applied Mathematics and Information Sciences, Vol. 6, No. 3, 759-765. (2012)
6. Wei X. L., Chen M., Zhang G. M., and Huang J. J.: NMF-NAD: detecting network-wide traffic anomaly based on NMF. Journal on Communications, Vol. 33, No. 4, 54-61. (2012) 7. Tian H., Zhong B. Z., and Shen H.: Diffusion wavelet-based analysis on traffic matrices by
different diffusion operators. Computers & Electrical Engineering, Vol. 40, No. 6, 1874-1882. (2014)
8. Sun T., Tian H., and Mei X.: Anomaly detection and localization by diffusion wavelet-based analysis on traffic matrix. Computer Science and Information Systems, Vol. 12, No. 4, 1361– 1374.(2015)
9. Thottan M., Ji C.: Statistical Detection of Enterprise Network Problems. Journal of Network and Systems Management, Vol. 7, No. 7, 27-45. (1999)
10. Liu B. S., Li Y. J., Hou Y. P.: The identification and correction of outlier based on wavelet transform of traffic flow. International Conference on Wavelet Analysis and Pattern Recognition,1498 - 1503.(2007)
11. Willinger W., Rincón D., Roughan M.: Towards A Meaningful MRA of Traffic Matrices. IMC Proceedings of ACM Sigcomm Conference on Internet Measurement, 331-336. (2008). 12. Wei L., Ghorbani A A.: Network Anomaly Detection Based on Wavelet Analysis. Journal on
Advances in Signal Processing, Vol. 1, 1-16. (2009)
13. Coifman R. and Maggioni M.: Diffusion Wavelets. Applied and Computational Harmonic Analysis Vol. 24, No. 3, 329–353. (2008)
14. Hellerstein J., Zhang F., and Shahabuddin P.: A statistical approach to predictive detection. The International Journal of Computer and Telecommunications Networking.(2001)
16. Shen K., Zhong M., Li C.: I/O System Performance Debugging Using Model-driven Anomaly Characterization. 4th USENIX Conference on File and Storage Technologies, 309-322. (2005)
17. Lakhina A., M. Crovella M., Diot C.: Diagnosing network-wide traffic anomalies. Computer Communication Review, Vol. 34, No. 4, 219-230. (2004)
18. Klivansky S M., Mukherjee A., Song C.: On Long-Range Dependence in NSFNET Traffic. Georgia Institute of Technology. (2000)
19. De Lima A B., Lipas M., De Mello F L.: A Generator of Tele-traffic with Long and Short-Range Dependence. International Symposium on Personal, Indoor and Mobile Radio Communications, 1-6. (2007)
20. Ding M. and Tian H.: PCA-based network traffic anomaly detection. Tsinghua Science and Technology, Vol. 21, No. 5, 500-509. (2016)
21. Ren X Y., Wang R C., Wang H Y.: Design and Realization of Software for Guard against DDoS Based on Self-Similar and Optimization Filter. Journal of China Universities of Posts and Telecommunications, Vol. 13 No. 13, 44-48. (2006)
22. Chandola V., Banerjee A., Kumar V.: Anomaly Detection for Discrete Sequences: A Survey. IEEE Transactions on Knowledge and Data Engineering, Vol. 24 No. 5:823-839. (2012) 23. Agyemang, M., Barker, K., and Alhajj R.: A comprehensive survey of numeric and symbolic
outlier mining techniques. Intelligent Data Analysis Vol. 10, No. 6, 521–538. (2006) 24. Hodge, V. and Austin, J.: A survey of outlier detection methodologies. Artificial Intelligence
Review 22, 2, 85-126. (2004)
25. Abilene network: https://uit.stanford.edu/service/network/internet2/abileneAgrawal
Hui Tian, Associate Professor in School of Electronics and Information Engineering, Beijing Jiaotong University. She received B. Eng. and M. Eng. degrees from Xidian University, China and Ph.D. from Japan Advanced Institute of Science and Technology. Her research interests include network performance evaluation, telecommunications and wireless sensor networks.
Jingtian Liu received B.E. degree from University of Jinan, China. She is currently a
master student in Beijing Jiaotong University, China. Her research interests are privacy preserving computing.
Meimei Ding received B.E. degree from Changchun University, China. She is currently
a master student in Beijing Jiaotong University, China. Her research interests are network performance analysis.