I
I
n
n
t
t
e
e
r
r
n
n
a
a
t
t
i
i
o
o
n
n
a
a
l
l
J
J
o
o
u
u
r
r
n
n
a
a
l
l
o
o
f
f
B
B
i
i
o
o
l
l
o
o
g
g
i
i
c
c
a
a
l
l
S
S
c
c
i
i
e
e
n
n
c
c
e
e
s
s
2012; 8(8):1109-1120. doi: 10.7150/ijbs.4694 Research PaperInterferon-Gamma-Induced Nitric Oxide Inhibits the Proliferation of
Mu-rine Renal Cell Carcinoma Cells
David J. Tate Jr.
1, John R. Patterson
1, Cruz Velasco-Gonzalez
2, Emily N. Carroll
3, Janie Trinh
1, Daniel
Edwards
1, Ashok Aiyar
1,4, Beatriz Finkel-Jimenez
1, and Arnold H. Zea
1,4, 5,1. Stanley S. Scott Cancer Center, LSUHSC, New Orleans, LA, 70112; 2. Department of Public Health, LSUHSC, New Orleans, LA, 70112;
3. Ohio State University-College of Medicine, LSUHSC, New Orleans, LA, 70112; 4. Microbiology Immunology and Parasitology, LSUHSC, New Orleans, LA, 70112; 5. Section of Pulmonary and Critical Care Medicine, LSUHSC, New Orleans, LA, 70112.
Corresponding author: Arnold H. Zea, PhD. Stanley S. Scott Cancer Center, Louisiana State University HSC, 533 Bolivar St, CSRB Room: 453, New Orleans, LA 70112, USA. Phone: (504) 599-0906, Fax: (504) 568-6888, E-mail: azea@lsuhsc.edu.
© Ivyspring International Publisher. This is an open-access article distributed under the terms of the Creative Commons License (http://creativecommons.org/ licenses/by-nc-nd/3.0/). Reproduction is permitted for personal, noncommercial use, provided that the article is in whole, unmodified, and properly cited.
Received: 2012.06.04; Accepted: 2012.08.26; Published: 2012.09.06
Abstract
Renal cell carcinoma (RCC) remains one of the most resistant tumors to systemic chemo-therapy, radiochemo-therapy, and immunotherapy. Despite great progress in understanding the basic biology of RCC, the rate of responses in animal models and clinical trials using interferons (IFNs) has not improved significantly. It is likely that the lack of responses can be due to the tumor’s ability to develop tumor escape strategies. Currently, the use of targeted therapies has improved the clinical outcomes of patients with RCC and is associated with an increase of Th1-cytokine responses (IFNγ), indicating the importance of IFNγ in inhibiting tumor prolif-eration. Thus, the present study was designed to investigate a new mechanism by which IFNγ mediates direct anti-proliferative effects against murine renal cell carcinoma cell lines. When cultured RCC cell lines were exposed to murine recombinant IFNγ, a dose dependent growth inhibition in CL-2 and CL-19 cells was observed; this effect was not observed in Renca cells. Growth inhibition in CL-2 and CL-19 cell lines was associated with the intracellular induction of nitric oxide synthase (iNOS) protein, resulting in a sustained elevation of nitric oxide (NO) and citrulline, and a decrease in arginase activity. The inhibition of cell proliferation appears to be due to an arrest in the cell cycle. The results indicate that in certain RCC cell lines, IFNγ modulates L-arginine metabolism by shifting from arginase to iNOS activity, thereby devel-oping a potent inhibitory mechanism to encumber tumor cell proliferation and survival. Elu-cidating the cellular events triggered by IFNγ in murine RCC cell lines will permit anti-tumor effects to be exploited in the development of new combination therapies that interfere with L-arginine metabolism to effectively combat RCC in patients.
Key words: nitric oxide, Interferon-gamma, nitric oxide synthase, renal cell carcinoma, arginase 2, polyamines, L-arginine, cell proliferation.
INTRODUCTION
Renal cell carcinoma (RCC) accounts for 5% of all cancers, leading to an estimate of 13,120 mortalities each year in the United States (1). RCC remains one of the most resistant tumors to immunotherapy,
chem-otherapy, and radiotherapy (2). The overall survival for all RCC patients has not appreciably improved during the last 25 years, indicating the need for more effective ways to treat this disease. Immunotherapy
Ivyspring
with interferon alpha (IFNα and/or interleukin-2 (IL-2)) has been used as a first-line therapy to treat RCC, but the documented clinical response rate in patients is only 10-20%, with a median survival of approximately 12 months (3-5). In recent years, the advent of targeted therapies for metastatic RCC has grown substantially (6-9); however, these therapies do not produce complete responses and have several adverse effects, and their mechanisms of action are poorly understood.
There is a complex relationship between im-munity, tumorigenesis, and the metabolism of L-arginine (10;11) that can be highly relevant to RCC. Recent studies have demonstrated convincingly that the enzymes arginase 1 (ARG1), arginase 2 (ARG2), and inducible nitric oxide synthase (iNOS) play a crucial role in tumor biology (12-14). ARG1 and ARG2 are collectively referred to as ARG in this manuscript because their activities are similar. L-arginine is me-tabolized by ARG, producing L-ornithine, as substrate for ornithine decarboxylase (ODC) to synthesize pol-yamines that are essential for cell growth. In contrast, iNOS metabolizes L-arginine to produce nitric oxide (NO) that kills tumor cells by mechanisms that are partially understood (15-17). Since ARG and iNOS compete for L-arginine, this amino acid is a crucial component whose metabolism modulates cell growth/inhibition and suppresses T-cell function (18). In addition, the balance between iNOS and ARG is competitively regulated by Th1 and Th2 type-cytokines; Th1 cytokines induce iNOS, whereas Th2 cytokines induce ARG (19). One of the possible mechanisms to explain the impairment of antitumor immunity in patients with RCC is the well docu-mented shift from Th1 to Th2 cytokine response (20). This shift may prompt the tumor microenvironment to produce high levels of ARG and polyamines in-stead of initiating an iNOS-dependent production of NO that could be characterized by the lack of Th1 responses in order to survive (21;22) Recently, we demonstrated that murine RCC cell lines with high levels of ARG2 expression are associated with L-arginine depletion resulting in induced T-cell dys-function and increased tumor growth (23).
For many years, treatment with IFNγ has shown
minimal or no activity in patients with RCC. Since the
combination of IFNγ and IFNα treatment reflected a
response rate similar to IFNα alone, the latter has
been the treatment of election for RCC patients for many years (24). This observation is striking since
IFNγ has the most potent immunomodulatory activity
among the interferons (25-27), indicating that the
mechanisms of action of IFNγ are complex, not well
understood, and deserve to be re-visited in the context
of tumor resistance and tumor microenvironment. The present study focuses on the mechanisms by
which IFNγ can modulate L-arginine metabolism by
shifting ARG-dependent cell proliferation to growth inhibition by inducing iNOS and NO production. Understanding these mechanisms will facilitate the development of new, effective, pharmacological strategies that interfere with L-arginine metabolism to control and eliminate RCC in affected patients.
MATERIALS AND METHODS
Cell lines, reagents and culture conditions
For this study, three murine RCC (mRCC) cell lines were used: SIRCC-1.2 (CL-2) and SIRCC 1.19 (CL-19) cells of induced origin (28) and Renca cells of spontaneous origin, kindly provided by Dr. Robert H.
Wiltrout (NCI). Cells were maintained at 37oC in
con-tinuous cell culture in RPMI-1640 containing 1,140 µM L-arginine (Lonza Inc., Walkersville, MD) and sup-plemented with 10% fetal bovine serum (Hyclone, Logan, UT), 25 mM HEPES, 4 mM L-glutamine, 100 units/ml of penicillin/streptomycin, 1 mM non-essential amino acids, and 1 mM sodium
py-ruvate (Lonza, Inc.). Recombinant mouse IFNγ
(rmIFNγ) purchased from R&D Systems, Minneapolis,
MN was used to determine its effect on iNOS induc-tion and cytostasis on mRCC cells (10U/ml). The
in-hibitor of iNOS, NG-monomethyl-
L
-arginine(L-NMMA) (EMD-Calbiochem, Gibbstown, NJ), was also titrated to determine the optimal inhibitory
con-ditions (1mM).The experiments were performed by
plating 3 x 10⁵ cells in six-well plates which were
al-lowed to attach for 24 h (this cell concentration allow the cells to survive in culture up to 120 h). Fresh
me-dia containing IFNγ and L-NMMA (Time 0) were
added to the cells and cultured at 2, 4, 6, 24, 48, and 72 h. At the different time points, supernatants were collected and cells were harvested using 0.05% Tryp-sin/EDTA (Sigma, St. Louis, MO) to perform the dif-ferent assays. The protein concentration was deter-mined by using the BCA protein assay kit (Pierce Bi-otechnology Inc., Rockford, IL). Cell extracts were stored at -70 ºC until used for western blots.
Arginase activity
Freshly prepared cytoplasmic extracts from cul-tured mRCC cells before and after treatment with
IFNγ were tested for ARG activity by the conversion
of L-arginine to L-ornithine (nanomoles/106
cells/hour), as described elsewhere (29).
Western blot
µg/lane) were electrophoresed in 8% Tris-glycine gels (Invitrogen, Carlsbad, CA) and transferred to poly-vinylidiene difluoride (PVDF) membranes (Invitro-gen). Immunoblotting was performed with antibodies for ARG2 (1:500), iNOS (1:200) (Santa Cruz Biotech, Santa Cruz, CA), and GAPDH (1:10,000) (Fitzgerald Industries International, Acton, MA). Detection was achieved by horseradish peroxidase-conjugated anti-bodies (1:3000, Santa Cruz) and an enhanced chemi-luminescent kit (ECL, GE Healthcare, Piscataway, NJ). ARG2 and iNOS protein bands were visualized on X-OMAT AR films (Kodak, Rochester, NY).
Reverse Transcription-PCR analysis
Total RNA from 1 x 10⁶ cells was extracted using
TRIzol (Invitrogen), treated with DNase I (Invitro-gen), and reverse transcribed using Superscript II (Invitrogen). PCR amplification was completed using primers for mouse iNOS and β-actin as follow: iNOS: forward, 5'-CTT CCG AAG TTT CTG GCA GCA GCG-3', reverse, 5'-GAG CCT CGT GGC TTT GGG
CTC CTC-3', and β-actin forward 5'-CCA GAG CAA
GAG AGG TAT CC-3', reverse 5'-CTG TGG TGG TGA AGC TGT AG-3'. The expected sizes of amplified fragments were iNOS 459 bp, and β-actin 436 bp. PCR products were visualized in ethidium bromide 1% agarose gels.
Assessment for cell growth and survival
Cell growth and viability was determined by using the previously described MTT assay (30).
Briefly, different cell lines were plated at 1x10⁴/well
in 24-well plates and treated with IFNγ. At 24, 48, and
72 h, cells were incubated with MTT (0.5 mg/ml) for 4 h at 37 °C. Then, an equal volume of 0.04 M HCl in isopropanol was added to the wells and incubated for 3 h to dissolve the accumulated crystals of formazan. Absorbance was measured at 570 nm with a reference wavelength of 650 nm using a Benchmark Plus plate reader (Bio-Rad, Hercules, CA). Readings obtained from treated cells were compared with untreated controls in triplicate.
DNA fragmentation
Cell lines were treated with IFNγ or untreated for
24, 48, and 72 h. At each time point, the cells were harvested by trypsinization and washed once with phosphate buffered saline (PBS). Fragmented DNA was isolated using a DNA isolation kit (Qiagen, Va-lencia, CA) according to the manufacturer’s instruc-tions. Eluted samples containing DNA were electro-phoresed on a 2% agarose gels (Life Technologies,
Grand Island, NY) containing 0.5 µg/ml solution of
ethidium bromide. DNA bands were visualized under
UV and exposed to photography.
Cell cycle analysis
For DNA content analysis, 1 × 10⁶ cells were
treated with IFNγ for 24 and 48 h. The cells were
har-vested by trypsin digestion, collected by centrifuga-tion, and fixed in 70% ethanol /phosphate buffered
saline for at least 12 h at 4oC. After 100 µL (1 g/L) of
RNase treatment, cells were stained with 0.5 µg/ml
propidium iodide. Cells were examined by flow cy-tometry using a LSR II (Becton-Dickinson, USA). The percentage of cells in each phase of the cell cycle was analyzed using Modfit software (Verity, Software House, Topsham, ME).
Determination of Nitric oxide production
Nitrite accumulation in cell culture medium under defined conditions was used as an indirect de-termination of NO production and measured by a colorimetric assay based on the Griess reaction.
Briefly, 200 µL of the culture supernatants were mixed
with 200 µL of Griess reagent [one part 0.1%
N-(1-naphtyl) ethylene-diamine dihydrochloride and
one part 1% sulfanilamide] in 5% concentrated H3PO4
for 10 min at room temperature. The absorbance was measured at 540 nm in a Benchmark Plus plate reader (Bio-Rad). The readings were compared to a standard curve for sodium nitrite with a lower detection limit
of 1µmol/L nitrite. In order to confirm that the
formed nitrites were derived from iNOS induction, cells were cultured in the presence of the iNOS inhib-itor L-NMMA.
Amino acid detection
High performance liquid chromatography (HPLC) was conducted on deproteinized conditioned
media labeled with O-phtaldialdehyde (OPA).
Ana-lytes were eluted with 100 mM sodium acetate buffer, pH 5.0, with a linear gradient consisting of methanol (100%) and acetonitrile (100%). The analytes in the samples were calculated on the basis of standard curves of known amounts.
Cytokine measurement
Cytokines were measured in tissue culture su-pernatants released from cells at the different time points using Th1/Th2 panel Bio-Plex cytokine assay (Bio-Rad Laboratories, Hercules, CA) as described previously following the manufacturer’s instructions (31). The samples were analyzed for IL-2, IL-4, IL-5,
IL-10, IL-12 (p70), GM-CSF, IFNγ, TNFα, IL1β, IL6,
andVEGF on a Bio-Rad 96-well plate reader using the
Statistical analysis
Statistical analyses were completed in SAS v9.1 (SAS Institute, Cary, NC). For each cell line, nitrite concentration, proliferation, and ARG activity data were analyzed by mixed models for unequal vari-ances. Two-way ANOVA models were used with
time and experimental conditions (basal/IFNγ,
con-trol/IFNγ, andIFNγ+LNMMA) as factors. After IFNγ
treatment, each experimental condition was tested at each time point. Multiple testing was conducted at the 5% level using the Tukey procedure. Least squares means and corresponding standard errors were ob-tained.
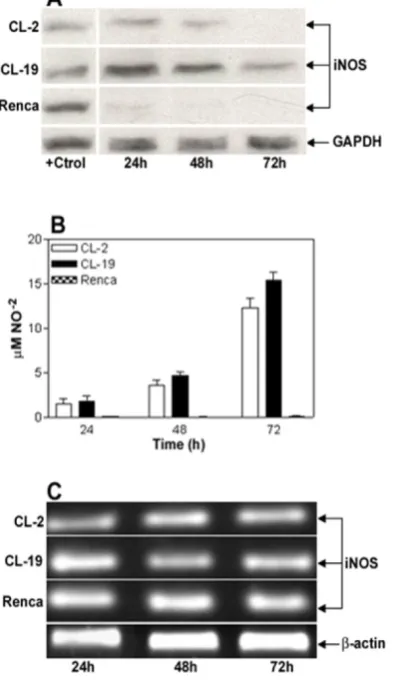
Figure 1. Characterization of iNOS expression and iNOS activity in murine RCC cell lines cultured in normal condi-tions.(A) Representative Western blot analysis for iNOS (130 kDa) and GAPDH (35 kDa) in CL-2, CL-19 and Renca cells cultured in normal conditions for 24, 48, and 72 h. Twenty five µg of total protein was loaded per line. RAW 264.7 cells stimulated with LPS plus murine IFNγ were used as positive control (+Ctrl) for iNOS protein. (B)
Nitrite production in the 3 cell lines was determined by Greiss reac-tion in culture media supernatants collected after 24, 48, and 72 h in culture. Results are the mean ± SE of triplicates of five different separate experiments. (C) Reverse transcription-polymerase chain analysis of iNOs mRNA expression. The result of a representative experiment is shown; similar results were obtained in at least three experiments. The expected sizes of amplified fragments were 459 bp for iNOS and 436 bp for β-actin.
RESULTS
iNOS protein expression and NO production
differs in mRCC cell lines
The basal expression level of iNOS protein and nitrite production in RCC cell lines CL-2, CL-19, and Renca, cultured in complete RPMI media for 24, 48, and 72 h was determined. As shown in Figure 1A, iNOS protein is detected at moderate levels in CL-2 and CL-19 during the time course of this experiment. In contrast, a complete absence of iNOS protein ex-pression was observed in Renca cells. When super-natants were tested for NO release, a minimal and continued synthesis of nitrites ranging from 1.4 ± 0.64
µM at 24 h to 12.2 ± 1.12 µM at 72 h in the CL-2 cells
and from 1.7 ± 0.63 µM up to 15.4 ± 0.86 µM in CL-19
cells was observed. Although low levels of iNOS are
expressed in CL-2 and CL-19 in the absence of IFNγ,
we were unable to detect nitrites released by iNOS activity at the level of detection available to us, before 24 h. However, production of NO was not observed in Renca cells at any tested time point (Figure 1B). The absence of iNOS protein expression in Renca cells prompted us to test iNOS mRNA expression by re-verse-transcriptase PCR in the aforementioned cell lines. As shown in Figure 1C, iNOS mRNA gene ex-pression was similar in all three cell lines at the dif-ferent time points of the experiments.
IFN
γ
increases iNOS protein levels and NO
production in CL-2 and CL-19 but not in Renca
cells
To determine the level of toxicity of IFNγ on the
cell lines, kinetic experiments using concentrations of
IFNγ ranging from 2.5 to 500 U/ml were performed
(data not shown). In this system, it was observed that
10 U/ml of IFNγ was the optimal concentration to
induce iNOS expression and to stimulate NO pro-duction without a measurable toxic effect on the cells.
IFNγ concentrations higher than 15 U/ml were toxic
to CL-2 and CL-19 cell lines, where a complete de-tachment of the cell monolayer was observed as early as 12 h (data not shown). Immunoblot analysis showed a maximal increase in the expression of im-munoreactive iNOS protein in CL-2 and CL-19 cells at 24 hours, post-treatment. iNOS levels started to de-crease at 48 h and reached basal levels at 72 h (Figure
2A). Interestingly, IFNγ did not induce iNOS protein
or cytostasis in Renca cells. This finding prompted us
to examine iNOS gene expression pre- and post- IFNγ
regulation of iNOS expression. In contrast, IFNγ
treatment markedly enhanced levels of iNOS mRNA in CL-2 and CL-19 cell lines (Figure 2B). The increased iNOS mRNA and protein expressions in CL-2 and CL-19 cells are associated with the production of high
levels of NO ranging from 59.7 ± 2.0 µM at 24 h to 85.6
± 9.6 µM at 72 h in CL-2 cells and from 42.4 ± 5.3 µM at
24 h to 71.9 ± 9.9 µM at 72 h in CL-19 cells (Table 1). As
expected, production of NO was not observed in Renca cells throughout the course of the experiments. Minimum iNOS protein expression was observed in untreated cells (Figure 1A) that were used as control against treated cells.
Figure 2. IFNγ-induced iNOS expression and iNOS activity in murine RCC cell lines. For reference, Figure 1A can be used as untreated control for these experiments. (A) Time course of iNOS protein expression by Western blot after stimulation of cells for 24, 48, and 72 h with 10 U/ml of murine IFNγ. (B) Nitrite production in culture supernatants following stimulation with IFNγ. Values for nitrite production are expressed by mean ± SE for three different experi-ments performed five different times. (C) Pattern of 24, 48, and 72 h iNOS mRNA induction (RT-PCR) in response to IFNγ stimulation. Each Western blot and RT-PCR presented is from single experiment that is representative of three to five separate experiments.
Table 1. Nitrite concentration (µM) in RCC cell lines of NO-2 before and after treatment with IFNγ. 1 Means of 6 different experiments; 2 SE; * p-values for
significance (p=0.0001) between untreated and treated cells with IFNγ for each cell line.
CL-2 CL-19 Renca Time -IFNγ +IFNγ -IFNγ +IFNγ -IFN
γ +IFNγ
24h 1.41 ±
0.642 59.7 ± 2.01 1.7 ± 0.63 42.4 ± 5.29 0 0 48h 3.5 ± 0.61 73.3 ± 3.79 4.6 ± 0.36 52.0 ± 6.69 0 0 72h 12.2 ±
1.12* 85.6 ± 9.62* 15.4 ± 0.86* 71.9 ± 9.93* 0 0
IFN
γ
induces NO-mediated cell death in CL-2
and CL-19 cell lines that is abrogated by the
iNOS inhibitor L-NMMA
The effectiveness of IFNγ in inhibiting the
pro-liferation of mRCC cell lines was assessed using MTT assays. As seen in Figure 3A, the addition of 10U/ml
of IFNγto mRCC cell lines significantly inhibited cell
proliferation of CL-2 (p= 0.008) and CL-19 (p= 0.0001) after 48 h in culture when compared to untreated cells. Not surprisingly, no significant difference in proliferation (p= 0.091) was observed in Renca cells. As seen in Figure 3B, differences in cell morphology and cell growth in CL-2 and CL-19 treated cells were observed at 48 hours post-treatment; these effects were absent in Renca cells at the same time-point. To
test whether IFNγ inhibited cell proliferation and
in-duced cell death through the endogenous production
of NO, L-NMMA, anon-selective inhibitor of all NOS
isoforms, was added to the cultures. Confirming the
cell death resulting from NO production, L-NMMA
completely reversed the killing effects of IFNγ
treat-ment (Figure 3A). NO production was also measured directly from the supernatants and showed that LNMMA completely inhibited the production of
ni-trites after stimulation with IFNγ in CL-2 and CL-19
cell lines (*** p<0.0001) as seen in Figure 4.The results are most easily interpreted to indicate that the
en-dogenous production of NO by IFNγ treatment has a
Figure 3. Effect of IFNγ and LNMMA on CL-2, CL-19 and Renca cell proliferation. (A) Three hundred thousand cells from CL-2, CL-19 and Renca were seeded in six well plates and cultured in presence or absence of IFNγ (10U/ml) or iNOS inhibitor LNMMA (1mM). Cell proliferation was measured at 24, 48, and 72 h using the MTT assay. The results are expressed as O.D (570) means ± SE of triplicate determi-nations from five independent experiments. Significant differences in proliferation were observed between control and IFNγ treated CL-2 (* p= 0.0084) and CL-19 (**p=0.0001) cells respectively. (B) Morphological changes and inhibition of cell proliferation in the CL-2, CL-19 and Renca cells before and after treatment with IFNγ. Microscopic images of mRCC cells after treatment with IFNγ were taken at 48h. Photographs were taken under phase contrast at 100x magnification.
Effects of IFN
γ
on DNA fragmentation and cell
cycle in the cell lines
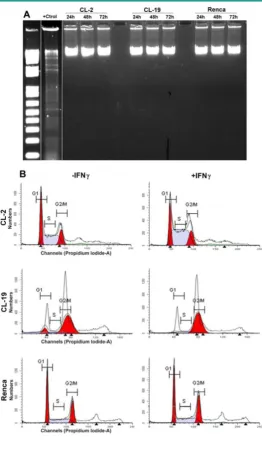
Apoptosis is characterized by DNA fragmenta-tion; therefore, DNA was isolated from the three cell
lines after treatment with IFNγ at 24, 48, and 72 h and
tested for its integrity. The results shown in Figure 5A
indicate that the cytostatic effects of endogenous NO production do not result in an increase in DNA frag-mentation in any of the cell lines. An analyses of the cell cycle profile by flow cytometry (Figure 5B) also
indicated that IFNγ treatment did not induce
apopto-sis in CL-2 and CL19 cells; however, CL-2 and CL-19
cells accumulated at G2/M (4N DNA content).
Therefore, growth inhibition of these cell-lines by
IFNγ may be a result from the cell-cycle arresting at
G2/M. No changes in cell cycle were observed in
re-sponse to IFNγ in Renca cells.
Effect of IFN
γ
treatment on arginase activity
The differential expression of ARG2 previously
observed (23) led us to test whether IFNγ treatment
affected ARG activity and L-arginine concentrations. Cytoplasmic extracts of untreated and treated cells
with IFNγ were isolated at 24, 48, and 72 h and tested
is observed only in the absence of media changes during the time course of the experiments. Changes were not observed in both untreated and treated cells
with IFNγ. Further, treatment with IFNγ produced a
significant decrease in ARG activity in CL-2 (p= 0.048) and CL-19 (p= 0.003) cells after 48 h, an effect that was only observed in Renca cells (p=0.031) after 72 h in culture (Figure 6). Collectively, these data indicate
that IFNγ interferes with ARG activity in the three cell
lines, perhaps by inhibiting transcription of the ARG2 gene.
Figure 4.Nitrite (NO-2) production measured in mRCC cells after treatment with IFNγ and IFNγ plus LNMMA. Average nitrite concentration between untreated and treated cells with IFNγ
over time in (A) CL-2 (* p= 0.003) and (B) CL-19 (** p= 0.037) at 48 and 72 h respectively. Significant reduction of nitrite production (*** p<0.0001) in CL-2 and CL-19 cells after the addition of iNOS inhibitor LNMMA. (C) Nitrite values in Renca cells after IFNγ treatment. Results are the mean ± SE of triplicates of five different separate experiments.
Effect of IFN
γ
in mRCC cell lines on L-arginine
concentration and its effect on the production
of NO and citrulline
Since L-arginine is the common substrate for
iNOS and ARG, we wanted to explore the effect of
IFNγ treatment on L-arginine consumption by HPLC.
The standard concentration of L-arginine in the cell
culture media was 1,140 µM for all experiments. As
seen in Figure 6A, in the first 24 h, the depletion of L-arginine was similar in the three cell lines. The CL-19 cell line, which expressed the highest levels of ARG activity, significantly depleted the media of
L-arginine concentrations by 6-fold (450 µM) at 24 h,
7-fold (296 µM) at 48h, and 9-fold (110 µM) at 72 h;
however, no major changes in L-arginine content were observed in CL-2 and Renca cells at 48 and 72 h
in culture. The addition of IFNγ to the cultures
signif-icantly (p= 0.0002) decreased the rate of depletion of L-arginine in CL-19 at 72h when compared to un-treated cells at the same time point (Figure 7A). The levels of L-arginine in CL-2 and Renca cells remained unchanged after the treatment. Concurrent with the depletion of L-arginine in the three cell lines, there was an increase in L-ornithine production that was
abrogated (p= 0.018) after 72 h of IFNγ treatment in
CL-19 cells when compared to CL-2 and Renca as il-lustrated in Figure 7B. As iNOS catalyzes the conver-sion of L-arginine to equimolar quantities of NO and citrulline, the samples were analyzed for citrulline
after treatment with IFNγ. Citrulline concentrations
increased significantly in a time-dependent manner in CL-2 (p= 0.0001) and CL-19 (p= 0.0013) at 48 h, whereas no increase was observed in Renca cells (Figure 7C). The data obtained for citrulline were nearly identical to the values obtained for nitrites seen
in Figure 4, after IFNγ treatment. Together, these
re-sults suggest that IFNγ shifts the L-arginine metabolic
pathway towards NO and citrulline production, con-sequently inhibiting RCC cell proliferation.
Cytokine Production in mRCC cell lines
In order to gain insights into the biology of mRCC cell lines and to determine their ability to produce cytokines, we tested for IL-2, IL-4, IL-5, IL-10,
IL-12 (p70), GM-CSF, IFNγ, TNFα, and VEGF
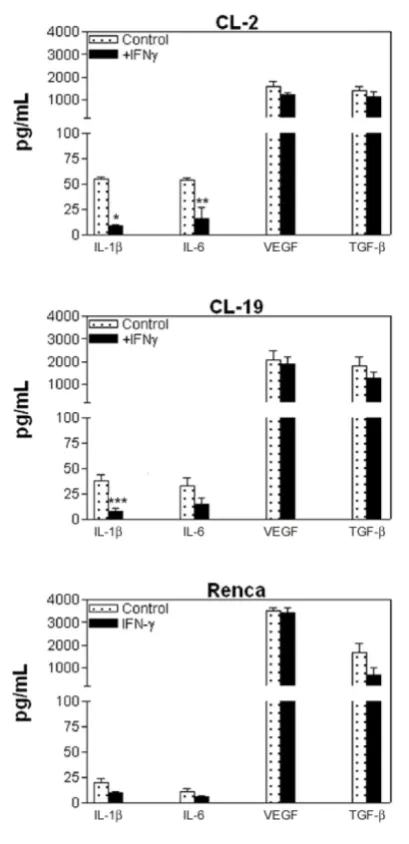
concen-trations in the culture supernatants. Figure 8 shows the cytokine expression in the three cell lines at 48 h. We choose 48 h since the maximum production of these cytokines was observed at this time point.
Moderate concentrations of IL-1β and IL-6 and high
concentrations of VEGF and TGFβ were observed in
all three cell lines. It appears that IFNγ treatment had
(p= 0.001 and p= 0.028) in CL-2 and IL-1β (p= 0.09) in CL-19 cells (Figure 8). This effect was not observed in Renca cells. Although, the amount of
VEGF and TGFβ was considerably higher in all
three cell lines at basal level, treatment with IFNγ
had no significant effect on the concentrations of these cytokines.
Figure 5. Effect of IFNγ treated cells on apoptosis and cell cycle.(A) Cells were plated for 1 day and then cultured in media containing IFNγ. DNA was extracted and subjected to DNA fragmentation ladder analysis. Data are representative of three independent experiments with similar results. (B) Anal-ysis of cell cycle progression in untreated and treated mRCC cell lines with IFNγ. After 24, 48, and 72 h cells were analyzed for DNA content by flowcytometry. A representative experi-ment performed at 48 h indicate the distribution of the cells in G1, S, and G2/M phases of the cell cycle.
Figure 7. L-arginine, L-ornithine, and citrulline levels. Culture supernatants of CL-2, CL-19 and Renca cells untreated and treated with IFNγ were collected at 24, 48, and 72 h and analyzed by HPLC after deproteinization with methanol and derivatization with OPA. Standards for L-arginine, L-ornithine, and citrulline in methanol were run with each experiment. Asterisks show significant differences between untreated and treated cells. (A) CL-19 L-arginine (* p= 0.0002), (B) CL-19. L-ornithine (** p=0.0183), and (C) CL-2 and CL-19 citrulline (*** p=0.0001). The results are expressed as mean ± SE of duplicate determinations from four independent experiments.
Figure 8. Cytokine profile in supernatants of mRCC cell lines. The cell lines were seeded in 6 well plates and treated with IFNγ
(10U/ml) for 24, 48, and 72 h. Supernatants were collected and as-sayed using a Th1/Th2 panel Bio-Plex cytokine assay. IL-1β, IL-6, VEGF, and TGFβ levels are shown. Treatment with IFNγ has a significant inhibitory effect in CL-2 cells production of IL-1β and IL-6 in CL-2 (* p<0.001; ** p=0.002) and IL-1β in CL-19 (* p=0.009). Data are rep-resentative of experiments at 48h of at least 3 independent experi-ments.
DISCUSSION
In this study, we reported the following: 1) a new mechanism to define the cytostatic role of NO in the inhibition of RCC cell proliferation; 2) the effect of
IFNγ in modulating L-arginine metabolism and
cyto-kine production; 3) the resistance of certain RCC cell
lines (Renca) to IFNγ treatment; and, 4) new insights
into the mechanisms by which RCC tumors may lo-cally and systemilo-cally shut down an important effec-tor arm of the immune response. IFNs have been widely used in preclinical models and in immuno-therapy trials for RCC (32;33). The activity of
mono-therapy with IFNα in metastatic RCC has been
exten-sively evaluated (34;35) with disappointing and con-troversial results. However, trials using a combination
of IL-2 and IFNα indicated a clinically useful
anti-tumor activity with a 15% overall response (36;37). In
contrast, therapy with the single agent IFNγ has
shown discouraging results in patients with RCC. Although preliminary studies suggested the benefits
of IFNγ treatment (38), only a 4.4% overall response
has been seen in phase III studies indicating that IFNγ
These results are striking since many IFNγ-mediated properties (e.g. anti-proliferative, apoptotic, and an-ti-angiogenic activity) have been attributed to this cytokine (40;41).
Our study was aimed to determine the
mecha-nism(s) by which IFNγ is capable of inducing growth
inhibition of murine RCC cell lines. Previously, we reported that murine CL-2, CL-19, and Renca cell lines have different levels of ARG2 expression that appear to be associated with the enhancement of cell prolif-eration (23).The results indicate a need for the tumor cells to use ARG2 to metabolize L-arginine for the synthesis of polyamines to promote cell growth. Conversely, NO is a free radical that, at low concen-trations, acts as single signal transducer whereas at higher concentrations can act as a cytotoxic/cytostatic defensive mechanism against pathogens and perhaps tumors (42). In our study, we found that RCC cell lines in the logarithmic phase of proliferation ex-pressed low iNOS protein levels and low concentra-tions of NO as measured by the production of nitrites
(15 -20 µM), whereas ARG2 activity was highly
pre-sent in the 3 cell lines. These results indicate that low iNOS and high ARG2 activity favor the growth of the cell lines and are supported by previous studies showing that high expression of ARG can inhibit iN-OS activity and NO production (43-45). We believe this could be a mechanism used by tumor cells to survive by directly avoiding the cytostatic effects of NO.
Since IFNγ is a potent inducer of iNOS, we
wanted to determine in vitro the mechanism(s) by
which this cytokine is capable of inhibiting RCC cell proliferation. We successfully demonstrated that iN-OS induction within the tumor cells in response to
IFNγ caused a robust and sustained accumulation of
endogenous NO that resulted in an 80-85% growth inhibition of CL-2 and CL-19 cell lines (Figure 3). This effect was abrogated by the addition of the iNOS in-hibitor, L-NMMA, showing that the reduction in cell growth was mediated by NO. It is possible that the
NO-mediated cytostatic effects observed in our in
vitro model could produce a different outcome in an in vivo model due to the presence of NO-producing cells infiltrating the tumor microenvironment. Here, we found that the cytostatic effect of NO in RCC cell lines was not due to apoptosis as demonstrated by others
(46;47), but rather by a cell cycle arrest at the G2/M
phase. This possibly could be mediated by the tran-scriptional modulation of cyclins and/or cy-clin-dependent kinases as seen in breast cancer cell lines and T cells (48;49). Since the growth-inhibitory
activity of IFNγ appears to be accompanied by the
inhibition of ARG activity in CL-2 and CL-19 cells
(Figure 5), we are suggesting that this inhibition could be partially responsible for the growth-inhibitory
ef-fects of IFNγ in addition to the major cytostatic effects
of NO. The importance of ARG and/or NO in the growth-inhibition of RCC cells needs to be explored further by possibly using ARG and iNOS-KO mice. Altogether, our data suggest that ARG2 and iNOS can
be modulated in a coordinated fashion by IFNγ to
counterbalance tumor growth and tumor inhibition. Lately, NO has emerged as a potential an-ti-proliferative agent capable of overcoming tumor cell resistance to conventional therapeutic agents.
Despite the relative beneficial effect of IFNγ-NO
in-duction which inhibits RCC proliferation, a substan-tial percentage (15%) of the cells failed to respond to
IFNγ treatment. For the first time, our results show
that a certain subpopulation of RCC cells develop a mechanism of resistance to specific cytostatic stimuli that could largely explain the commonly observed
lack of response to IFNγ in clinical trials. Mechanisms
of resistance have been associated with IFNα
defec-tive Jak/Stat signaling pathways (50-52) that could be
similar with IFNγ.
Interestingly, in our study, we showed that
Renca cells which, upon stimulation with IFNγ
ex-press iNOS mRNA, did not exex-press iNOS protein or NO production (Figure 2). Different mechanisms have been postulated to explain the lack of iNOS expres-sion, but a novel finding has shown that loss of iNOS protein expression is exerted by translational inhibi-tion specifically mediated by miR-146a (50). The goal of this study was not to understand the control of iNOS expression at the translational level, but to highlight that different RCC cell types can vary in
their sensitivity to IFNγ and, therefore, to NO. These
findings will have a high translational relevance be-cause permitting us to identify RCC cells better and to determine their sensitivity to IFN treatment. It is pos-sible that human RCC could present with similar characteristics to those seen in Renca cells. Therefore,
these cells (or patients) will not benefit from IFNγ
treatment not because IFNγ does not work but rather
because these cells found a way to become resistant to this cytokine as a mechanism of survival. Therefore, in patients, the identification of resistance to INF treat-ment could be extremely important for a more per-sonalized and effective treatment of RCC.
Production of either stimulatory or inhibitory cytokines by infiltrating or neoplastic cells may have more of an impact on the development of an effective anti-tumor response than in the promotion of tumor growth. When we tested cytokine production before
most predominant cytokines in all 3 cell lines. Our
results showed a parallel effect of IL-1β and IL-6
re-duction (CL-2 and CL-19) with the inhibitory effects of NO, an effect that could be associated with low ARG
activity. Conversely, IFNγ did not have an effect on
the production of VEGF and TGFβ, indicating that the
inhibition of these cytokines can be mediated by other signaling pathways and that their presence can con-tribute to the maintenance of tumor growth and
an-giogenesis. A combination therapy of IFNγ with other
drugs (e.g. sunitinib) which targets VGEF receptors could advance the treatment of RCC.
In summary, we provided new evidence that an
improved understanding of IFNγ biology in the
inhi-bition of tumor cell proliferation will provide new insights regarding the use of this cytokine, not only for the treatment of RCC, but for the treatment of other tumors where the use of interferons is indicated. Although the development of agents targeting VEGF and mTOR pathways has provided chemotherapeutic agents that are more active and less potentially toxic than interferons, regardless of the specific target, the end point of these therapies relies upon the induction
of Th1 responses (mainly IFNγ expression). Our
re-sults indicate that IFNγ can play a key role in
modu-lating L-arginine metabolism by inhibiting ARG ac-tivity and by enhancing the endogenous production of NO to inhibit the proliferation of RCC cells. Since numerous conflicting results about the role of iNOS and NO in cancer have been reported (53), under-standing the multifaceted role of NO in cancer is im-perative. The biochemistry, type of tumor, and the spatial and temporal effects of its production need to
be more carefully studied in association with IFNγ.
Our findings can have multiple implications in RCC treatment not only by eliminating tumor cells and inhibiting angiogenesis, but more importantly by identifying the sets of patients with RCC that will
benefit from IFNγ treatment.
Acknowledgements
This work was supported by grant LEQSF(20-04-07)-RD-A-20 from the Louisiana Board of Regents and startup funds from the Stanley S. Scott Cancer Center at LSUHSC-NO. The authors greatly thank Dr. Robert H. Wiltrout who kindly provided us with the cell lines, Ms. Jonna Ellis for editing the manuscript, and Dr. Jeff Hobden for his critical re-view.
Conflict of Interest
All authors have declared that no conflicts of in-terest exist and agree with the contents of the
manu-script for publication.
References
1. Siegel R, Ward E, Brawley O, Jemal A. Cancer statistics, 2011: the impact of eliminating socioeconomic and racial disparities on premature cancer deaths. CA Cancer J Clin 2011 Jul;61(4):212-36.
2. Staehler M, Rohrmann K, Bachmann A, Zaak D, Stief CG, Siebels M. Therapeutic approaches in metastatic renal cell carcinoma. BJU Int 2005 Jun;95(8):1153-61.
3. Bleumer I, Oosterwijk E, De MP, Mulders PF. Immunotherapy for renal cell carcinoma. Eur Urol 2003 Jul;44(1):65-75.
4. Atkins MB, Regan M, McDermott D. Update on the role of interleukin 2 and other cytokines in the treatment of patients with stage IV renal car-cinoma. Clin Cancer Res 2004 Sep 15;10(18 Pt 2):6342S-6S.
5. McDermott DF, Regan MM, Clark JI, Flaherty LE, Weiss GR, Logan TF, Kirkwood JM, Gordon MS, Sosman JA, Ernstoff MS, Tretter CP, Urba WJ, et al. Randomized phase III trial of high-dose interleukin-2 versus subcutaneous interleukin-2 and interferon in patients with metastatic renal cell carcinoma. J Clin Oncol 2005 Jan 1;23(1):133-41.
6. Atkins MB, Bukowski RM, Escudier BJ, Figlin RA, Hudes GH, Kaelin WG, Jr., Linehan WM, McDermott DF, Mier JW, Pedrosa I, Rini BI, Si-gnoretti S, et al. Innovations and challenges in renal cancer: summary statement from the Third Cambridge Conference. Cancer 2009 May 15;115(10 Suppl):2247-51.
7. Ko JS, Zea AH, Rini BI, Ireland JL, Elson P, Cohen P, Golshayan A, Rayman PA, Wood L, Garcia J, Dreicer R, Bukowski R, et al. Sunitinib mediates reversal of myeloid-derived suppressor cell accumulation in renal cell carcinoma patients. Clin Cancer Res 2009 Mar 15;15(6):2148-57. 8. De Mulder PH. Targeted therapy in metastatic renal cell carcinoma. Ann
Oncol 2007 Jul;18 Suppl 9:ix98-102.
9. Sosman JA, Puzanov I, Atkins MB. Opportunities and obstacles to com-bination targeted therapy in renal cell cancer. Clin Cancer Res 2007 Jan 15;13(2 Pt 2):764s-9s.
10. Morris SM, Jr. Recent advances in arginine metabolism: roles and regu-lation of the arginases. Br J Pharmacol 2009 Jul;157(6):922-30.
11. Munder M. Arginase: an emerging key player in the mammalian im-mune system. Br J Pharmacol 2009 Oct;158(3):638-51.
12. Bronte V, Zanovello P. Regulation of immune responses by L-arginine metabolism. Nat Rev Immunol 2005 Aug;5(8):641-54.
13. Viola A, Bronte V. Metabolic mechanisms of cancer-induced inhibition of immune responses. Semin Cancer Biol 2007 Aug;17(4):309-16.
14. Peranzoni E, Marigo I, Dolcetti L, Ugel S, Sonda N, Taschin E, Mantelli B, Bronte V, Zanovello P. Role of arginine metabolism in immunity and immunopathology. Immunobiology 2007;212(9-10):795-812.
15. Wu G, Morris SM, Jr. Arginine metabolism: nitric oxide and beyond. Biochem J 1998 Nov 15;336 ( Pt 1):1-17.
16. Li H, Meininger CJ, Kelly KA, Hawker JR, Jr., Morris SM, Jr., Wu G. Activities of arginase I and II are limiting for endothelial cell prolifera-tion. Am J Physiol Regul Integr Comp Physiol 2002 Jan;282(1):R64-R69. 17. Buga GM, Wei LH, Bauer PM, Fukuto JM, Ignarro LJ.
NG-hydroxy-L-arginine and nitric oxide inhibit Caco-2 tumor cell pro-liferation by distinct mechanisms. Am J Physiol 1998 Oct;275(4 Pt 2):R1256-R1264.
18. Zea AH, Rodriguez PC, Culotta KS, Hernandez CP, DeSalvo J, Ochoa JB, Park HJ, Zabaleta J, Ochoa AC. L-Arginine modulates CD3zeta expres-sion and T cell function in activated human T lymphocytes. Cell Immu-nol 2004 Nov;232(1-2):21-31.
19. Munder M, Eichmann K, Moran JM, Centeno F, Soler G, Modolell M. Th1/Th2-regulated expression of arginase isoforms in murine macro-phages and dendritic cells. J Immunol 1999 Oct 1;163(7):3771-7. 20. Finke JH, Rini B, Ireland J, Rayman P, Richmond A, Golshayan A, Wood
L, Elson P, Garcia J, Dreicer R, Bukowski R. Sunitinib reverses type-1 immune suppression and decreases T-regulatory cells in renal cell car-cinoma patients. Clin Cancer Res 2008 Oct 15;14(20):6674-82.
21. Tatsumi T, Kierstead LS, Ranieri E, Gesualdo L, Schena FP, Finke JH, Bukowski RM, Mueller-Berghaus J, Kirkwood JM, Kwok WW, Storkus WJ. Disease-associated bias in T helper type 1 (Th1)/Th2 CD4(+) T cell responses against MAGE-6 in HLA-DRB10401(+) patients with renal cell carcinoma or melanoma. J Exp Med 2002 Sep 2;196(5):619-28.
22. Onishi T, Ohishi Y, Imagawa K, Ohmoto Y, Murata K. An assessment of the immunological environment based on intratumoral cytokine pro-duction in renal cell carcinoma. BJU Int 1999 Mar;83(4):488-92. 23. Tate DJ, Jr., Vonderhaar DJ, Caldas YA, Metoyer T, Patterson JR, Aviles
24. Dutcher JP, Fine JP, Krigel RL, Murphy BA, Schaefer PL, Ernstoff MS, Loehrer PJ. Stratification by risk factors predicts survival on the active treatment arm in a randomized phase II study of interferon-gamma plus/minus interferon-alpha in advanced renal cell carcinoma (E6890). Med Oncol 2003;20(3):271-81.
25. Kirkwood JM, Bryant J, Schiller JH, Oken MM, Borden EC, Whiteside TL. Immunomodulatory function of interferon-gamma in patients with metastatic melanoma: results of a phase II-B trial in subjects with meta-static melanoma, ECOG study E 4987. Eastern Cooperative Oncology Group. J Immunother 1997 Mar;20(2):146-57.
26. Berner V, Liu H, Zhou Q, Alderson KL, Sun K, Weiss JM, Back TC, Longo DL, Blazar BR, Wiltrout RH, Welniak LA, Redelman D, et al. IFN-gamma mediates CD4+ T-cell loss and impairs secondary antitumor responses after successful initial immunotherapy. Nat Med 2007 Mar;13(3):354-60.
27. Hillman GG, Younes E, Visscher D, Hamzavi F, Kim S, Lam JS, Mon-tecillo EJ, Ali E, Pontes JE, Puri RK, Haas GP. Inhibition of murine renal carcinoma pulmonary metastases by systemic administration of inter-feron gamma: mechanism of action and potential for combination with interleukin 4. Clin Cancer Res 1997 Oct;3(10):1799-806.
28. Gruys ME, Back TC, Subleski J, Wiltrout TA, Lee JK, Schmidt L, Watanabe M, Stanyon R, Ward JM, Wigginton JM, Wiltrout RH. Induc-tion of transplantable mouse renal cell cancers by streptozotocin: in vivo growth, metastases, and angiogenic phenotype. Cancer Res 2001 Aug 15;61(16):6255-63.
29. Zea AH, Culotta KS, Ali J, Mason C, Park HJ, Zabaleta J, Garcia LF, Ochoa AC. Decreased expression of CD3zeta and nuclear transcription factor kappa B in patients with pulmonary tuberculosis: potential mechanisms and reversibility with treatment. J Infect Dis 2006 Nov 15;194(10):1385-93.
30. Cory AH, Owen TC, Barltrop JA, Cory JG. Use of an aqueous soluble tetrazolium/formazan assay for cell growth assays in culture. Cancer Commun 1991 Jul;3(7):207-12.
31. Zea AH, Rodriguez PC, Atkins MB, Hernandez C, Signoretti S, Zabaleta J, McDermott D, Quiceno D, Youmans A, O'Neill A, Mier J, Ochoa AC. Arginase-producing myeloid suppressor cells in renal cell carcinoma patients: a mechanism of tumor evasion. Cancer Res 2005 Apr 15;65(8):3044-8.
32. Haas GP, Hillman GG. Update on the Role of Immunotherapy in the Management of Kidney Cancer. Cancer Control 1996 Nov;3(6):536-41. 33. Hillman GG, Younes E, Visscher D, Hamzavi F, Kim S, Lam JS,
Mon-tecillo EJ, Ali E, Pontes JE, Puri RK, Haas GP. Inhibition of murine renal carcinoma pulmonary metastases by systemic administration of inter-feron gamma: mechanism of action and potential for combination with interleukin 4. Clin Cancer Res 1997 Oct;3(10):1799-806.
34. Negrier S, Escudier B, Lasset C, Douillard JY, Savary J, Chevreau C, Ravaud A, Mercatello A, Peny J, Mousseau M, Philip T, Tursz T. Re-combinant human interleukin-2, reRe-combinant human interferon alfa-2a, or both in metastatic renal-cell carcinoma. Groupe Francais d'Immuno-therapie. N Engl J Med 1998 Apr 30;338(18):1272-8.
35. Motzer RJ, Bacik J, Murphy BA, Russo P, Mazumdar M. Interferon-alfa as a comparative treatment for clinical trials of new therapies against advanced renal cell carcinoma. J Clin Oncol 2002 Jan 1;20(1):289-96. 36. Rosenberg SA, Lotze MT, Yang JC, Linehan WM, Seipp C, Calabro S,
Karp SE, Sherry RM, Steinberg S, White DE. Combination therapy with interleukin-2 and alpha-interferon for the treatment of patients with advanced cancer. J Clin Oncol 1989 Dec;7(12):1863-74.
37. Spencer WF, Linehan WM, Walther MM, Haas GP, Lotze MT, Topalian SL, Yang JC, Merino MJ, Lange JR, Pockaj BA, . Immunotherapy with interleukin-2 and alpha-interferon in patients with metastatic renal cell cancer with in situ primary cancers: a pilot study. J Urol 1992 Jan;147(1):24-30.
38. Ellerhorst JA, Kilbourn RG, Amato RJ, Zukiwski AA, Jones E, Logothetis CJ. Phase II trial of low dose gamma-interferon in metastatic renal cell carcinoma. J Urol 1994 Sep;152(3):841-5.
39. Ernstoff MS, Nair S, Bahnson RR, Miketic LM, Banner B, Gooding W, Day R, Whiteside T, Hakala T, Kirkwood JM. A phase IA trial of se-quential administration recombinant DNA-produced interferons: com-bination recombinant interferon gamma and recombinant interferon alfa in patients with metastatic renal cell carcinoma. J Clin Oncol 1990 Oct;8(10):1637-49.
40. Ikeda H, Old LJ, Schreiber RD. The roles of IFN gamma in protection against tumor development and cancer immunoediting. Cytokine Growth Factor Rev 2002 Apr;13(2):95-109.
41. Angiolillo AL, Sgadari C, Taub DD, Liao F, Farber JM, Maheshwari S, Kleinman HK, Reaman GH, Tosato G. Human interferon-inducible
pro-tein 10 is a potent inhibitor of angiogenesis in vivo. J Exp Med 1995 Jul 1;182(1):155-62.
42. Ignarro LJ. The unique role of nitric oxide as a signaling molecule in the cardiovascular system. Ital Heart J 2000 Sep;1 Suppl 3:S28-S29. 43. Li H, Meininger CJ, Hawker JR, Jr., Haynes TE, Kepka-Lenhart D, Mistry
SK, Morris SM, Jr., Wu G. Regulatory role of arginase I and II in nitric oxide, polyamine, and proline syntheses in endothelial cells. Am J Physiol Endocrinol Metab 2001 Jan;280(1):E75-E82.
44. Wang WW, Jenkinson CP, Griscavage JM, Kern RM, Arabolos NS, Byrns RE, Cederbaum SD, Ignarro LJ. Co-induction of arginase and nitric oxide synthase in murine macrophages activated by lipopolysaccharide. Bio-chem Biophys Res Commun 1995 May 25;210(3):1009-16.
45. Gotoh T, Mori M. Arginase II downregulates nitric oxide (NO) produc-tion and prevents NO-mediated apoptosis in murine macro-phage-derived RAW 264.7 cells. J Cell Biol 1999 Feb 8;144(3):427-34. 46. Sousa MS, Latini FR, Monteiro HP, Cerutti JM. Arginase 2 and nitric
oxide synthase: Pathways associated with the pathogenesis of thyroid tumors. Free Radic Biol Med 2010 Sep 15;49(6):997-1007.
47. Hussain SP, Trivers GE, Hofseth LJ, He P, Shaikh I, Mechanic LE, Doja S, Jiang W, Subleski J, Shorts L, Haines D, Laubach VE, et al. Nitric oxide, a mediator of inflammation, suppresses tumorigenesis. Cancer Res 2004 Oct 1;64(19):6849-53.
48. Rodriguez PC, Quiceno DG, Ochoa AC. L-arginine availability regulates T-lymphocyte cell-cycle progression. Blood 2007 Feb 15;109(4):1568-73. 49. Singh R, Pervin S, Karimi A, Cederbaum S, Chaudhuri G. Arginase
activity in human breast cancer cell lines: N(omega)-hydroxy-L-arginine selectively inhibits cell proliferation and induces apoptosis in MDA-MB-468 cells. Cancer Res 2000 Jun 15;60(12):3305-12.
50. Korkola JE, Blaveri E, DeVries S, Moore DH, Hwang ES, Chen YY, Estep AL, Chew KL, Jensen RH, Waldman FM. Identification of a robust gene signature that predicts breast cancer outcome in independent data sets. BMC Cancer 2007;7:61.
51. Brinckmann A, Axer S, Jakschies D, Dallmann I, Grosse J, Patzelt T, Bernier T, Emmendoerffer A, Atzpodien J. Interferon-alpha resistance in renal carcinoma cells is associated with defective induction of signal transducer and activator of transcription 1 which can be restored by a supernatant of phorbol 12-myristate 13-acetate stimulated peripheral blood mononuclear cells. Br J Cancer 2002 Feb 1;86(3):449-55.
52. Shang D, Liu Y, Ito N, Kamoto T, Ogawa O. Defective Jak-Stat activation in renal cell carcinoma is associated with interferon-alpha resistance. Cancer Sci 2007 Aug;98(8):1259-64.