©2016 New Delhi Publishers. All rights reserved
Dynamics of Production and Export in Transformation of Tea
Plantation Sector in India
Udeshna Talukdar
Department of Agricultural Economics, Assam Agricultural University, Jorhat-785013, Assam, India Corresponding author: kctalukdar07@yahoo.co.in
Abstract
The study was based on secondary published data with effect from 1971 to 2011 with an objective to examine the trends of production and export of tea and growth in India. It was observed that tea sector plays an important role contributing more than 200 crores to the GNP of the country. The major three producing regions are Darjeeling, Assam and Nilgiri. In the recent years, the sector has witnessed a stiff competition in the international export market affecting domestic production. It was observed that China produces 39.00% of world tea followed by India sharing 24.55% with an annual change of 2.87% during 1971-81 to 3.06% during 2001-11. Production of tea in the country was mainly due to increase of area and productivity. Replanted and replacement area could not influence the production of tea significantly. Number of tea estates was found to increase in between 1991-01 at the rate of 74.09% due to inclusion of small tea gardens and it declined from 5.29% to 3.64% during 1961 to 2011. Productivity change was higher in Assam, Tripura, Tamil Nadu and Kerala with high production change during the decades. The area growth during the decades was low. Production share of tea grades like CTC, Darjeeling and Green tea declined over years while share of Orthodox tea increased over years. The country witnessed high annual change of area of tea bushes under the age group of 5 to 10 years followed by below 5 years due to more area put under the small tea estates in the recent years. The export of tea bags as value added tea grew faster from 1971-72 to 2011-12 in terms of quantity and value followed by packet tea. Auction sale in the country declined. Employment generated per estate varied from 191 in Karnataka to 1011 in West Bengal in 2011. The emerging small tea sector has contributed from 5% in early 90’s to 31% during current year and is expected to touch 50% within next few years. It can be concluded that area could influence the production and it needs to be increased under replanting and replacement planting. Steps should also be taken to increase the export of value added tea in the country. The small tea sector should be organised and regulated to make it more productive.
Keywords: India, Production, Green tea, Employment
Tea is the most popular beverage of the world. The use of tea Cdates back to 2700 B.C. in China as beverage. Tea industry is one of the oldest and well organized and labour intensive, agro-based industries and plays an important role in the national economy. The industry contributes more than ` 1200 crores per annum to the GNP creating employment to three million people directly and indirectly. Major three tea producing regions are Darjeeling, Assam and Nilgiri. All three differ in style and flavour. These three distinct tea is also grown in Kerala, Arunachal Pradesh, Karnataka, Tripura Himachal Pradesh, Manipur, Uttaranchal,
the recent past. An attempt has been made in this study to examine the decadal changes of growth in production and export trade of tea in India.
Methodology
The study was conducted for India based on secondary published data. Tabular analysis was done to examine the change of parameters. Compound growth rate was also estimated to examine the dynamic change of some parameters in tea export. A log linear Cobb-Douglas production function was also fitted to examine the influence of few explanatory variables on production of tea with effect from 1970-71 to 2014-15 in India as follows:
Qt= f(X1t, X2t, X3t, X4t, X5t), specified as Qt= α X1tβ1X
2tβ2X3tβ3X4tβ4X5tβ5 e
Where, Qt = Total production of tea in India (million kgs) from 1970-71 to 2014-15
X1t = Total area of tea in India from 1970-71 to 2014-15 (‘000 ha)
X2t = Total productivity of tea during 1970-71 to 2014-15(kg/ha)
X3t = Total replanting/replacement area (ha) from 1970-71 to 2014-15
X4t = Total rainfall (mm) from 1970-71 to 2014-15 X5t= time (proxy variable for technology) from
1970-71 to 2014-15
α is the intercept and βis are the elasticities The parameters were tested at 1, 5 and 10% level of probability.
Results and Discussion
Present status of Indian tea in global production During 2013 the global tea production was 4819 mkgs out of which India shared 1200 mkgs. It was observed that out of total production in the world 96.76% were consumed while the rest of 3.24% were exported.
In India, 83.58% of total production of tea was consumed domestically and only 16.42% of it was exported. India produced 24.90% of tea production from 15.00% area under tea plantation in the world (Table 1).
Table 1: Present status of tea in the global production
Particulars World
(2013) (2013)India Rank sharep.c
Area under
tea (mh) 3.69 0.56 2nd 15
Production
(mkg) 4819 1200 2nd 25
Export (mKg) 1865 219 4th 12
Consumption
(mkg) 4663 1003 2nd 22
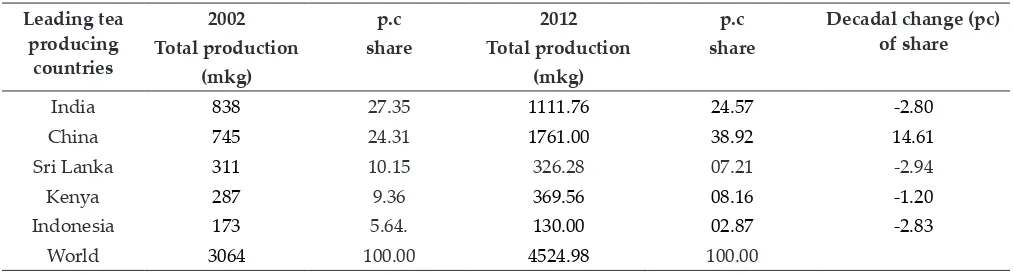
Decadal change of share of tea production in different countries
Share of tea production in different countries of the world showed that percentage share of tea production varied from 5.64 in Indonesia to 27.35 in India during 2002. China shared 24.31% during this year. It was also found that during 2012 this share varied from 2.87% in Indonesia to 38.92% in china which production of tea in the world during this period. During this decade percentage share of
Table 2: Decadal change in total tea production of India and other countries in Global production
Leading tea producing
countries
2002 Total production
(mkg)
p.c share
2012 Total production
(mkg)
p.c share
Decadal change (pc) of share
India 838 27.35 1111.76 24.57 -2.80
China 745 24.31 1761.00 38.92 14.61
Sri Lanka 311 10.15 326.28 07.21 -2.94
Kenya 287 9.36 369.56 08.16 -1.20
Indonesia 173 5.64. 130.00 02.87 -2.83
tea production in different countries was found to decline except in China (Table 2). The production of tea in the traditional countries like India and Sri Lanka was found to decline in the last decade.
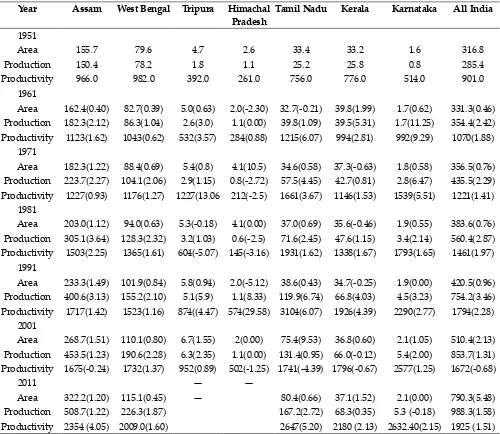
Decadal changes in area, production and productivity of tea in India
An attempt was made to examine the decadal changes of area, production and productivity of tea in different states of India since 1951 to 2011. It was observed from Table 3 that change in area gained over decades in Assam at the rate of 0.40% in 1951-61 to 1.20% in 2001-11, 0.63 to 1.55% in
Tripura and -0.21% to 0.66% in Tamilnadu during this period. It was found to decline in all other states. The nation gained area under tea towards the end of the decade. During 1971 to 2001, decadal change in area of tea was found to be more erratic in the country. Decadal change of production of tea was found to decline in the tea producing states in the last decade except in Kerala and it was found to gain marginally in the country. Production of tea was found more erratic during 1971-1901.
Annual productivity change of tea in different states in the decades indicated that its change was higher in Assam and Taminadu due to introduction
Table 3: Decadal changes in area, production and productivity of tea in different states of India
Year Assam West Bengal Tripura Himachal
Pradesh Tamil Nadu Kerala Karnataka All India
1951 Area Production Productivity 155.7 150.4 966.0 79.6 78.2 982.0 4.7 1.8 392.0 2.6 1.1 261.0 33.4 25.2 756.0 33.2 25.8 776.0 1.6 0.8 514.0 316.8 285.4 901.0 1961 Area Production Productivity 162.4(0.40) 182.3(2.12) 1123(1.62) 82.7(0.39) 86.3(1.04) 1043(0.62) 5.0(0.63) 2.6(3.0) 532(3.57) 2.0(-2.30) 1.1(0.00) 284(0.88) 32.7(-0.21) 39.8(1.09) 1215(6.07) 39.8(1.99) 39.5(5.31) 994(2.81) 1.7(0.62) 1.7(11.25) 992(9.29) 331.3(0.46) 354.4(2.42) 1070(1.88) 1971 Area Production Productivity 182.3(1.22) 223.7(2.27) 1227(0.93) 88.4(0.69) 104.1(2.06) 1176(1.27) 5.4(0.8) 2.9(1.15) 1227(13.06 4.1(10.5) 0.8(-2.72) 212(-2.5) 34.6(0.58) 57.5(4.45) 1661(3.67) 37.3(-0.63) 42.7(0.81) 1146(1.53) 1.8(0.58) 2.8(6.47) 1539(5.51) 356.5(0.76) 435.5(2.29) 1221(1.41) 1981 Area Production Productivity 203.0(1.12) 305.1(3.64) 1503(2.25) 94.0(0.63) 128.3(2.32) 1365(1.61) 5.3(-0.18) 3.2(1.03) 604(-5.07) 4.1(0.00) 0.6(-2.5) 145(-3.16) 37.0(0.69) 71.6(2.45) 1931(1.62) 35.6(-0.46) 47.6(1.15) 1338(1.67) 1.9(0.55) 3.4(2.14) 1793(1.65) 383.6(0.76) 560.4(2.87) 1461(1.97) 1991 Area Production Productivity 233.3(1.49) 400.6(3.13) 1717(1.42) 101.9(0.84) 155.2(2.10) 1523(1.16) 5.8(0.94) 5.1(5.9) 874((4.47) 2.0(-5.12) 1.1(8.33) 574(29.58) 38.6(0.43) 119.9(6.74) 3104(6.07) 34.7(-0.25) 66.8(4.03) 1926(4.39) 1.9(0.00) 4.5(3.23) 2290(2.77) 420.5(0.96) 754.2(3.46) 1794(2.28) 2001 Area Production Productivity 268.7(1.51) 453.5(1.23) 1675(-0.24) 110.1(0.80) 190.6(2.28) 1732(1.37) 6.7(1.55) 6.3(2.35) 952(0.89) 2(0.00) 1.1(0.00) 502(-1.25) 75.4(9.53) 131.4(0.95) 1741(-4.39) 36.8(0.60) 66.0(-0.12) 1796(-0.67) 2.1(1.05) 5.4(2.00) 2577(1.25) 510.4(2.13) 853.7(1.31) 1672(-0.68) 2011 Area Production Productivity 322.2(1.20) 508.7(1.22) 2354 (4.05) 115.1(0.45) 226.3(1.87) 2009.0(1.60) — — — 80.4(0.66) 167.2(2.72) 2647(5.20) 37.1(1.52) 68.3(0.35) 2180 (2.13) 2.1(0.00) 5.3 (-0.18) 2632.40(2.15) 790.3(5.48) 988.3(1.58) 1925 (1.51)
of small tea cultivation. It was found to increase marginally in West Bengal, Karnataka and Kerala during the last decade. In Karnataka, it was found to change annually at 9.29% during 1951-61 and which declined to 2.15% during 2001-2011. In West Bengal, productivity change of tea was almost stagnant in the recent decade. It was observed that change in production of tea in the country was primarily influenced by change in area other than productivity. Relative productivity was higher in South India.
Factors affecting tea production and their elasticities
The effects of factors contributing to the total production of tea in India were examined with effect from 1970-71 to 2014-15 and the results were:
Qt= 0.09 X1t0.88(14.69)***X
2t0.94(11.40)***X3t0.01(NS)X4t -0.08(1.69)**X
5t0.025(1.50)* R2=0.99
***, ** and * indicate level of significance at 1, 5 and 10% level of probability respectively. Figures in parentheses indicate t values.
The elasticities of the C-D function indicated that production of tea in India was influenced more by area and productivity followed by rainfall and technology as proxy. Other factors could not explain the production more significantly. The effect of rainfall on production of tea was found to be adverse during this period. The high rainfall might have adversely affected the production of green leaf accompanied by high incidence of pest and disease affecting production. The area under replanting and replacement of tea bushes was inadequate and could not boost the tea production in the country. All factors were found to be inelastic in nature.
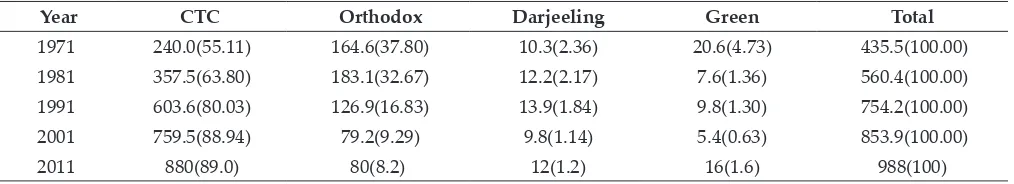
Production of tea in India according to grades Table 4 indicates that production of CTC tea has
increased from 55.11% in 1971 to 89.0% in 2011. In case of orthodox, Darjeeling and green tea its share declined in the country. In comparison to CTC tea, orthodox and Darjeeling tea production declined faster in the country. Production of green tea declined up to 2001 and then increased. It was also observed that out of total production of tea in the country about 97.2% were shared by CTC and orthodox tea in the recent years.
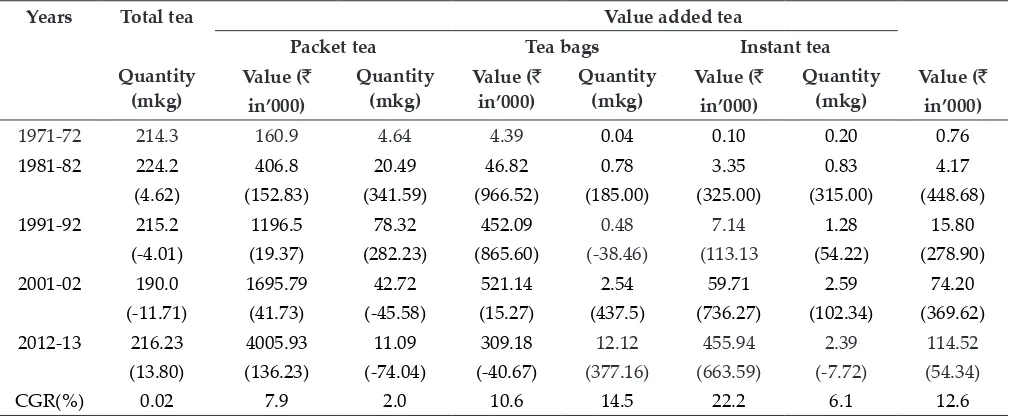
Decadal changes and growth of export of value added tea in India
Table 5 shows the decadal change of exports of value added tea in India. It was observed that total export of tea was found to decline in the country till 2001 after which it increased faster. It was also observed that export of packet tea increased manifold up to 1991-92 after which it declined. In contrary export of tea bags has reached a momentum with high export growth while the export of instant tea declined faster from 1981-82. The growth of export was lowest for total tea and packet tea while it was higher for other value added tea like tea bags and instant tea. Relative to changes in physical quantity growth of export values were higher for each grade in the country. It was highest for tea bags and instant tea export in the country. This indicates that India should also put more emphasis to export value added tea.
Table 6 indicates that auction sale of tea in the country has declined in the recent past. During 1971, 62.08% of made tea were sold through auction which declined to 51.19% in 2011. In contrary quantity of made tea sold directly was found to increase from 37.92 to 48.81% during this period. In the recent year’s buyers from foreign countries established forward linkages and prefered to buy directly from the gardens through e-trading.
Table 4: Production of tea in India according to grades (mkg)
Year CTC Orthodox Darjeeling Green Total
1971 240.0(55.11) 164.6(37.80) 10.3(2.36) 20.6(4.73) 435.5(100.00) 1981 357.5(63.80) 183.1(32.67) 12.2(2.17) 7.6(1.36) 560.4(100.00) 1991 603.6(80.03) 126.9(16.83) 13.9(1.84) 9.8(1.30) 754.2(100.00)
2001 759.5(88.94) 79.2(9.29) 9.8(1.14) 5.4(0.63) 853.9(100.00)
2011 880(89.0) 80(8.2) 12(1.2) 16(1.6) 988(100)
Moreover, some buyers preferred some reputed gardens to buy quality tea.
Decadal change of work force in Indian tea industry
It is evident from Table 7 that except in WB and
Karnataka number of tea estates declined in all other states of India. Employment pattern in the estates indicated that the states employed temporary labour more than the permanent labour in the tea estates. During 2001 Employment of permanent labour varied from 9.13% in Tamilnadu to 61.40% in Table 5: Decadal changes and growth of export of value added tea in India
Years Total tea Value added tea
Packet tea Tea bags Instant tea
Quantity
(mkg) Value (in’000)` Quantity (mkg) Value (in’000)` Quantity (mkg) Value (in’000)` Quantity (mkg) Value (in’000)`
1971-72 214.3 160.9 4.64 4.39 0.04 0.10 0.20 0.76
1981-82 224.2
(4.62)
406.8 (152.83)
20.49 (341.59)
46.82 (966.52)
0.78 (185.00)
3.35 (325.00)
0.83 (315.00)
4.17 (448.68)
1991-92 215.2
(-4.01)
1196.5 (19.37)
78.32 (282.23)
452.09 (865.60)
0.48 (-38.46)
7.14 (113.13
1.28 (54.22)
15.80 (278.90)
2001-02 190.0
(-11.71)
1695.79 (41.73)
42.72 (-45.58)
521.14 (15.27)
2.54 (437.5)
59.71 (736.27)
2.59 (102.34)
74.20 (369.62)
2012-13 216.23
(13.80)
4005.93 (136.23)
11.09 (-74.04)
309.18 (-40.67)
12.12 (377.16)
455.94 (663.59)
2.39 (-7.72)
114.52 (54.34)
CGR(%) 0.02 7.9 2.0 10.6 14.5 22.2 6.1 12.6
Figures in parentheses indicate decadal change
Table 6: Production and quantity of tea sold through auctions
Year Production
(mkgs)
Sold through auctions
(m kgs) sold in auctionpc of quantity pc of quantitysold directly
1971 435.5 270.4 62.08 37.92
1981 560.4 306.9 54.76 45.24
1991 754.2 473.9 62.83 37.12
2001 853.7 459.8 53.85 46.15
2011 988.3 506.0 51.19 48.81
Table 7: Status of workforce in Indian tea Industry
State No. of estates Workforce in 2001 (2011) Workforce/estate
2001 2011 Permanent Temporary Total Permanent Temporary Total 2001 2011
Assam 780 767 54568
(29.6)
129688
(70.4) 184256
411071 (59.4)
280553
(40.60) 691624 236 902
WB 308 324 12110(21.7) 43702(78.3) 55812 227652(69.6) (30.40)99377 327029 181 1009
Tamil nadu 228 140 12292
(9.13)
122259
(90.87) 134551
38739 (78.70)
10487
(21.30) 49226 590 352
Kerala 154 91 5928
(61.40)
3729
(38.60) 9657
34341 (79.13)
9053
(20.87) 43394 63 477
Karnataka 16 18 18220
(12.60)
126340
(87.40) 144560
2534 (73.60)
909
Kerala. Except in Kerala employment of permanent labour was quite low in other states. In contrary the employment of temporary labour was higher in the tea estates. It was more than 90.00% in Tamilnadu. During 2011, employment scenario in the tea sector of the country had undergone changes. Employment of permanent labour was found to increase in all states and the temporary labourer declined to 20.87% in Kerala to 40.60% in Assam. It was also found that total labour per estate increased in Assam, West Bengal and Kerala while it declined in other states during 2001 to 2011.
Emergence of small tea sector
Small tea growers have area under tea plantation upto 10.12 hectares. This sector grew right from 1920 and it spread to NE India in late eighties. Currently there are 2 lakh growers cultivating tea in 1.60 lakh hectares. The contribution of small tea sector has gone upto 5.00% in nineties to 31.00% in the recent years and it is expected to touch 50.00% in the next few years. In absolute terms production volume is around 350 mkgs. Small tea sector has emerged as a promising tea sector for domestic market. However, the sector needs to be organized and controlled for producing quality tea attaining more bargaining power.
Summary and Conclusion
It was observed that tea plantation sector is playing an important role contributing more than 200 crores to the GNP of the country. The major three tea producing regions are Darjeeling, Assam and Nilgiri. Production of tea in the country was influenced more by area and productivity while other factors like replanted and replacement area could not influence the production of tea significantly. Number of tea estates was found to increase in between 1991-01 at the rate of 74.09% due to inclusion of small tea gardens and it declined from 5.29% to 3.64% during 1961 to 2011. Productivity change was higher in Assam, Tripura, Tamil Nadu and Kerala with high production change during the decades. The area growth during the decades was low. Production share of tea grades like CTC, Darjeeling and Green tea declined over years while share of Orthodox tea increased over years. The country witnessed a high annual change of area of tea bushes under the age group of 5 to 10
years followed by below 5 years due to more area put under the small tea estates in the recent years. The export of value added tea like tea bags grew faster from 1971-72 to 2011-12 in terms of quantity and value followed by packet tea. Auction sale of tea in the country declined. During 2011 Employment of permanent labour was found to increase in all states and the temporary labourer declined to 20.87% in Kerala to 40.60% in Assam. It was also found that total labour per estate increased in Assam, West Bengal and Kerala while it declined in other states during 2001 to 2011. The emerging small tea sector has contributed from 5% in early 90’s to 31% during current year and is expected to touch 50% within next few years. It can be concluded that area could influence the production and it needs to be increased under replanting and replacement planting. Steps should also be taken to increase the export of value added tea in the country. The small tea sector should be organised and regulated to make it more productive in the country.
References
Chakravorty, S.K., Sarkar, A.R. and Awasthi, R.C. 1984. Growth of Indian tea during the last three decades (1951 to 1981). Two and a Bud.31(2): 27-32.
Kumar Ajith, P.K. and Devi, I.P. 1995. Variability and trends in area, production and productivity of tea in Kerala. Agric Situation in India. Feb : 807-809.
Reddy Chinnappa, B.V., Keshava Reddy, T.R., Venkataram, J.V., Chandran, A. and Prakash, T.N. 1993. Production and export of India tea and coffee : An analysis of growth and instability. Ind. J. Agric. Marketing7(1): 32-39.
Sahewalla, I.P. and Borthakur, N. 1996. An analysis of trends and determinants of tea production in Assam. J. Agric. Sci. Soc.,9(1): 50-54.
Sahewalla, I.P. and Talukdar, K.C. 1996. Relative growth and stability in quantity auctioned and prices of tea in Kolkata and Guwahati tea auction centres. Bihar J Agric. Marketing.
4(3): 250-260.
Sharma, H.R. and Sharma, R.K. 2003. Production and export performance of Indian tea- A temporal and cross sectional analysis. Agric. Econ. Res. Rev. 16(2): 152-170.
Talukdar, K.C. and Sahewalla, I.P. 1997. Growth and instability of exports of Indian tea to major European countries presented in 24th World Marketing Congress, held at Institute of Marketing and Management, New Delhipublished at
IMM Year Book: 89-102.