International Journal of Health Sciences and Research
www.ijhsr.org ISSN: 2249-9571
Original Research Article
A Pre-Experimental Study to Assess the Effectiveness of Planned Teaching
Programme on Knowledge and Attitude Regarding Prevention of Obesity
among Adolescent Girls in Selected Schools of Joginder Nagar, Mandi
District, Himachal Pradesh
Ms. Isha
Nursing Tutor, Akal College of Nursing,Eternal University, Baru Sahib, H.P., India
ABSTRACT
Obesity is a medical condition in which excess body fat has accumulated to the extent that it may have an adverse effect on health, leading to reduced life expectancy and/or increased health problems. An evaluatory approach, pre-experimental one group pre-test post-test design, 60 randomly selected (lottery method) students from two conveniently selected schools of district Mandi, Himachal Pradesh. Planned teaching programme with the help of interactive lecture method was administered after the assessment of pre-intervention knowledge and attitude regarding prevention of obesity. Post intervention knowledge and attitude was assessed on the 7th day of the administration of planned teaching programme through the same structured knowledge questionnaire to assess knowledge and structured attitude scale was used to assess the attitude regarding prevention of obesity. The results of this study in general showed, the significant difference between the mean pre-test and post-test knowledge score (t59 =15.363, p<0.001) and attitude score (t59 =9.861, p<0.001). The significant
difference was found in between all the areas. There were associations between the pre-test knowledge and attitude score and selected demographic variables. Hence it can be concluded that planned teaching programme was effective in improving knowledge and changing attitude regarding prevention of obesity among adolescent girls, which was evident in post-test knowledge score and attitude score.
Key words: Effectiveness, Planned Teaching Programme, Knowledge, Attitude, Obesity, Adolescent girls.
INTRODUCTION
Obesity is a global health challenge of 21st century, with morbid obesity affecting 5 percent of the country‟s population. Obesity in teenagers is a growing problem that has become worse in recent times. Obesity can be seen as the first wave of a defined cluster of non-communicable diseases called "New World Syndrome," creating an enormous socio economic and public health burden in poorer countries. Obesity is the most common nutritional disorder in the western countries and among the higher income groups in the developing countries. [1]
According to Centre for Disease Control and Prevention (2008) Obesity means having too much body fat. It is not the same as being overweight, which means weighing too much. A person may be overweight from extra muscle, bone, or water, as well as from having too much fat. Both terms mean that a person‟s weight is greater than what is considered healthy for his/her height. Obesity is one of the most serious public health challenges of 21st century. [2]
girls. World Health Organization existing data it has been projected that by the year 2030 level of obesity could be as high as 50-80% in the USA, between 30-40% in Australia, England and Mauritius and over 20.5% in some developing countries. According to WHO (2014) the prevalence was comparatively lower in Asia (4.9% in 2010), the number of afflicted children were greater. The prevalence of childhood obesity increased from 4% to 6% in 2010 which is expected to reach 90% or approximately 60 million in 2020. [3]
A study conducted to assess the prevalence of overweight and obesity among 1061 (610 boys and 451 girls) children and adolescent in Kolkata India. Participants were divided in to three ages, Group I (8-11), Group II (12-15) and Group III (16-18). The prevalence of overweight was 13.3%, 19.8% and 18.5% and obesity was 4.1%, 7.6% and 5.4%. Respectively higher prevalence of overweight and obesity was observed for girls in the age group 12-15 years and 16-18 years. [4]
A cross-sectional study was carried out to determine the prevalence of overweight and obesity among urban school-going adolescents 10-19 years of both sexes studying from 5th to 12th classes in various government and private schools of Shimla city in Himachal Pradesh. A sample of 3385 students comprising 1665 female (49.2%) and 1720 (50.8%) was formed for the purpose of the study. The total 1665 females, 661 (19.5% of total students) and 1004 (29.7% of total students) were from government and private schools, respectively. Similarly, of a total of 1720 males, 916 (27.1% of total students) and 804 (23.8% of total students) were from government and private schools. It was
observed that 39.8%subjects were
underweight, 3.0% were overweight, and 0.9% obese. In the present study, 86 (85%) of the total 101 overweight and 31 (100%) of the total 31 obese subjects were from the private schools. [5]
Foregoing literature explains about
clear evidence of demographic,
epidemiological and nutritional transition fuelling the epidemic of overweight, obesity and chronic disease particularly in urban areas of India. With continuous increasing levels of obesity there is corresponding
increase in diabetes, cardiovascular
diseases, hypertension and ultimately
mortality rates.
Need for study
“Prevention is better than cure”. Therefore as a nurse, the researcher has a pivotal role in creating awareness among adolescent girls about the modification of lifestyle and prevention of future complications, which can help to improve the quality of life by providing education and support.
Today most of the research studies among adolescents have focused on the nutritional problems, anemia and menstrual
problems. Very little information is
available on knowledge and attitude of adolescents regarding obesity in urban and rural areas.
As an Investigator, I found
adolescent girls are spending more time on mobile phone, playing video games, watching television and work on computers without doing any activity. Adolescent girls have lack of knowledge regarding obesity and were neglecting to take care of their health according to their age group.
Hence Investigator felt a strong need to conduct a study in a local setting. It is
better to prevent obesity and its
complications in adolescent period by conducting health awareness programme
regarding lifestyle modification. The
massive health education programme were urgently needed both in urban & rural areas in India. The awareness and knowledge regarding obesity is grossly inadequate among adolescents in India. Adolescent period may be the best time to mount
primary and secondary prevention
METHODS
One group pre-test post-test research design used for the study. The population of the study were adolescent girls between the age group of 13-18 years.
Inclusion criteria
1. Adolescent girls between the age group of 13-18 years.
2. Adolescent girls who were willing to participate in the study.
3. Adolescent girls who were able to
understand English.
4. Adolescent girls who were available during the time of data collection.
Exclusion criteria
1. Government school students.
2. Adolescent girls who were irregular in attending the school.
3. Adolescent girls who were having
mental stress.
An evaluatory approach with pre-experimental one group pre-test post-test design was used for the study. The present study was conducted at two conveniently selected schools of district Mandi. The schools were selected on the basis of expected availability of adolescent girls, giving permission to conduct the study and convenience in terms of distance. The population for the study was 60 adolescent girls (13-18 years) in selected randomly from selected schools of District Mandi, Himachal Pradesh. The group included only those adolescent girls who were present at the time of data collection and who were willing to participate in the study.
Out of 60 randomly selected (lottery method) subjects, 30 subjects were selected from Gurukul and 30 subjects from Navjyoti senior secondary school of Joginder Nagar. Researcher took 10 students from each class. Duration of data collection was up to 4 weeks in the month of November, 2015. The tool was constructed after extensive review of literature and discussion with the subject-experts.
Description of the tool: The tool consisted of following 4 sections.
Section A: It consisted of personal profile of the subjects‟ which included age, class in
which studying, religion, type of family, area of residence, education of mother, education of father, monthly family income, family history of obesity, dietary habits and sources of information.
Section B: It consisted of structured knowledge questionnaire which contained 20 items regarding prevention of obesity.
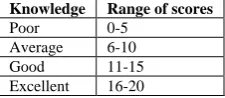
Table No 3.1: Scoring key to assess the knowledge regarding prevention of obesity among adolescent girls.
Knowledge Range of scores Poor 0-5
Average 6-10 Good 11-15 Excellent 16-20
Section C: It consisted of structured attitude scale which contained 24 items regarding prevention of obesity.
Table No 3.2: Scoring key to assess the attitude regarding prevention of obesity among adolescent girls.
Attitude Range of scores Unfavorable 1-32
Moderately favorable 33-64 Favorable 65-96
Scoring key
In structured knowledge
questionnaire which contained 20 items regarding prevention of obesity, each right response carried one mark and wrong response carried zero marks.
For structured attitude scale which
contained 24 items regarding prevention of obesity, for positive and for negative statements highest score was four.
The 24 questions in Section- C are rating questions. The scoring scale consists of four options Strongly agree(4) – agree(3) – disagree(2)– Strongly disagree(1). There are 12 positively stated items and 14 negatively stated items. In positively stated items the scores awarded in the order of 1, 2, 3 and 4. Negatively stated items the scores awarded in the order of 4, 3, 2 and 1.
The reliability of the tool was established by test-retest and split-half method by administering the tool for 6 adolescent girls from Mount Maurya International senior secondary school, Joginder Nagar, Mandi District, Himachal Pradesh. Reliability was established by test-retest method to assess the structured knowledge questionnaire and split-half method to assess the structured attitude scale. Karl Pearson‟s correlation coefficient formula was used. The reliability for the tool was found to be 0.87 for knowledge and 0.81 for attitude respectively, which showed that the tool was reliable. Data was collected and was tabulated according to objectives of the study using descriptive and inferential statistics.
Written permission was obtained from the concerned authorities before the
data collection and the investigator
familiarized herself with her subjects and explained the purpose of the study to them. After giving necessary instructions to the subjects, the baseline information was
collected along with knowledge
questionnaire. Pre-test knowledge level and attitude were assessed by structured knowledge questionnaire and structured attitude scale. Time taken for the pre-test was 30 minutes. Immediately after the pre-test, planned teaching programme regarding prevention of obesity was administered to the subjects. Post-test was conducted on the 7th day using the same structured knowledge questionnaire and structured attitude scale.
RESULTS
Main findings are discussed under the following headings
SECTION A: Personal profile of the subjects.
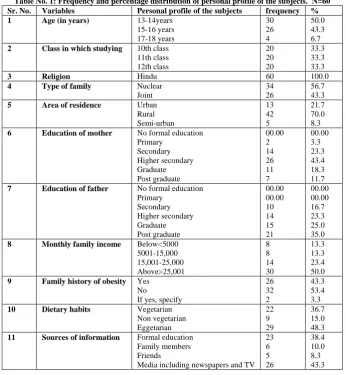
Table No. 1: Frequency and percentage distribution of personal profile of the subjects. N=60 Sr. No. Variables Personal profile of the subjects frequency %
1 Age (in years) 13-14years
15-16 years 17-18 years 30 26 4 50.0 43.3 6.7 2 Class in which studying 10th class
11th class 12th class 20 20 20 33.3 33.3 33.3
3 Religion Hindu 60 100.0
4 Type of family Nuclear
Joint
34 26
56.7 43.3
5 Area of residence Urban
Rural Semi-urban 13 42 5 21.7 70.0 8.3 6 Education of mother No formal education
Primary Secondary Higher secondary Graduate Post graduate 00.00 2 14 26 11 7 00.00 3.3 23.3 43.4 18.3 11.7 7 Education of father No formal education
Primary Secondary Higher secondary Graduate Post graduate 00.00 00.00 10 14 15 21 00.00 00.00 16.7 23.3 25.0 35.0 8 Monthly family income Below<5000
5001-15,000 15,001-25,000 Above>25,001 8 8 14 30 13.3 13.3 23.4 50.0 9 Family history of obesity Yes
No
If yes, specify
26 32 2 43.3 53.4 3.3
10 Dietary habits Vegetarian
Non vegetarian Eggetarian 22 9 29 36.7 15.0 48.3 11 Sources of information Formal education
Family members Friends
Fig.No.1: Percentage distribution according to age
SECTION B: PRE-TEST AND POST-TEST KNOWLEDGE REGARDING PREVENTION OF OBESITY AMONG ADOLESCENT GIRLS.
Table No. 2: Pre-test and post-test knowledge regarding prevention of obesity among adolescent girls. N=60
Fig.No.1: Percentage distribution according to the pre-test knowledge.
Fig.No.2: Percentage distribution according to the post-test knowledge
SECTION C: PRE-TEST AND POST-TEST ATTITUDE REGARDING PREVENTION OF OBESITY AMONG ADOLESCENT GIRLS.
Table No. 3: Pre-test and post-test attitude regarding prevention of obesity among adolescent girls. N=60
Level of knowledge Pre-test score Post-test score
Range of scores F % Range of scores frequency %
Poor 0-5 2 3.3 0-5 0 0
Average 6-10 43 71.7 6-10 4 6.7
Good 11-15 14 23.3 11-15 23 38.3
Excellent 16-20 1 1.7 16-20 33 55.0
Mean± SD=9.30±2.204 Mean± SD=15.28±2.799
Level of attitude Pre-test score Post-test score
Range of scores frequency % Range of scores frequency %
Unfavorable 0-32 0 0 0-32 0 0
Moderately favorable 33-64 2 3.3 33-64 0 0
Favorable 65-96 58 96.7 65-96 60 100
Fig.No.3: Percentage distribution according to the pre-test
attitude. Fig.No.4: Percentage distribution according to the post-test
attitude.
SECTION D: EFFECTIVENESS OF PLANNED TEACHING PROGRAMME ON KNOWLEDGE AND ATTITUDE REGARDING PREVENTION OF OBESITY AMONG ADOLESCENT GIRLS.
Table No. 4: Pre-test and post-test knowledge regarding prevention of obesity among adolescent girls. N=60 Knowledge Pre-test Post-test Paired ‘t’ test Table ‘t’ value p-value
f % f % -15.363 df=59
0.05 0.01 .001*** Poor 2 3.3 0 0 2.00 2.66
Average 43 71.7 4 6.7 Good 14 23.3 23 38.3 Excellent 1 1.7 33 55.0 Mean ±SD 9.30±2.204 15.28±2.799
*Statistically significant at p<0.05 ***statistically highly significant at p<0.001
The data in table 6 depicts the mean knowledge of the pre-test and post- test score regarding prevention of obesity among adolescent were mostly different. The pre-test mean score was 9.30 with a standard deviation of 2.204 and post-test mean score was 15.28 with a standard deviation of 2.799 which showed that there
was increase in excellent knowledge of the subjects.
The statistical paired „t‟ test indicated that the sample mean, namely the pre-test and post-test differed significantly from each other indicating rejection of the null hypothesis and upholding the alternate hypothesis pointing to the effectiveness of the planned teaching programme.
Table No. 5: Pre-test and post-test attitude regarding prevention of obesity among adolescent girls. N=60 Attitude Pre-test Post-test Paired ‘t’ test Table ‘t’ value p-value
f % f % -9.861 df=59
0.05 0.01 .001*** Unfavorable 0 0 0 0 2.00 2.66
Moderately favorable 2 3.3 0 0 Favorable 58 96.7 60 100 Mean± SD 75.83±5.654 82.00±5.932
*Statistically significant at p<0.05 ***statistically highly significant at p<0.001
The data in table 7 depicts the mean attitudes of the pre-test and post-test score regarding prevention of obesity among adolescent. The pre-test mean score was 75.83 with a standard deviation of 5.654 and post-test mean score was 82.00 with a standard deviation of 5.932 which showed
that there was a visible increase in favorable attitude of the subjects.
SECTION E: ASSOCIATION BETWEEN THE PRE-TEST KNOWLEDGE AND ATTITUDE WITH PERSONAL PROFILE OF THE SUBJECTS.
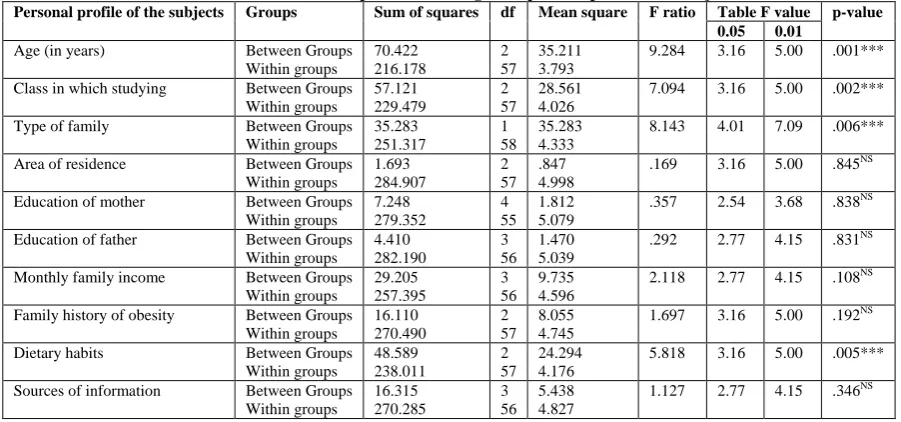
Table No. 6: Association between the pre-test knowledge with personal profile of the subjects. N=60
Personal profile of the subjects Groups Sum of squares df Mean square F ratio Table F value p-value 0.05 0.01
Age (in years) Between Groups Within groups 70.422 216.178 2 57 35.211 3.793
9.284 3.16 5.00 .001***
Class in which studying Between Groups Within groups 57.121 229.479 2 57 28.561 4.026
7.094 3.16 5.00 .002***
Type of family Between Groups Within groups 35.283 251.317 1 58 35.283 4.333
8.143 4.01 7.09 .006***
Area of residence Between Groups Within groups 1.693 284.907 2 57 .847 4.998
.169 3.16 5.00 .845NS
Education of mother Between Groups Within groups 7.248 279.352 4 55 1.812 5.079
.357 2.54 3.68 .838NS
Education of father Between Groups Within groups 4.410 282.190 3 56 1.470 5.039
.292 2.77 4.15 .831NS
Monthly family income Between Groups Within groups 29.205 257.395 3 56 9.735 4.596
2.118 2.77 4.15 .108NS
Family history of obesity Between Groups Within groups 16.110 270.490 2 57 8.055 4.745
1.697 3.16 5.00 .192NS
Dietary habits Between Groups Within groups 48.589 238.011 2 57 24.294 4.176
5.818 3.16 5.00 .005***
Sources of information Between Groups Within groups 16.315 270.285 3 56 5.438 4.827
1.127 2.77 4.15 .346NS
*Statistically significant at p<0.05 ***statistically highly significant at p<0.001
The above table presents the summary of ANOVA analysis which was used to bring out the relationship between the pre-test knowledge and personal profile of the subjects. The personal profile of the subjects such as age, class in which studying, type of family and dietary habits were statistically highly significantly
associated with the pre-test knowledge (p<0.001). Area of residence, education of mother, education of father, monthly family income, family history of obesity and sources of information were not found to be statistically significantly associated with the pre-test knowledge (p=0.05).
Table No. 7: Association between the pre-test attitude with personal profile of the subjects. N=60
Personal profile of the subject Groups Sum of squares df Mean square F ratio Table F value p-value 0.05 0.01
Age (in years) Between Groups Within groups 227.518 1658.815 2 57 113.759 29.102
3.909 3.16 5.00 .026*
Class in which studying Between Groups Within groups 11.417 1874.916 2 57 5.709 32.893
.174 3.16 5.00 .841NS
Type of family Between Groups Within groups 112.247 1774.086 1 58 112.247 30.588
4.00 4.01 7.09 .060NS
Area of residence Between Groups Within groups 114.398 1771.936 2 57 57.199 31.087
1.840 3.16 5.00 .168NS
Education of mother Between Groups Within groups 496.831 1389..50 4 55 124.208 25.264
4.916 2.54 3.68 .002***
Education of father Between Groups Within groups 429.229 1457.105 3 56 143.076 26.020
5.499 2.77 4.15 .002***
Monthly family income Between Groups Within groups 411.592 1474.742 3 56 137.197 26.335
5.210 2.77 4.15 .003***
Family history of obesity Between Groups Within groups 226.304 1660.029 2 57 113.152 29.123
3.885 3.16 5.00 .026*
Dietary habits Between Groups Within groups 179.228 1707.105 2 57 89.614 29.949
2.992 3.16 5.00 .058NS
Sources of information Between Groups Within groups 26.638 1859.695 3 56 8.879 33.209
.267 2.77 4.15 .849NS
*Statistically significant at p<0.05 ***statistically highly significant at p<0.001
The above table presents the summary of ANOVA analysis which was used to bring out the relationship between
education of father and monthly family
income were statistically highly
significantly associated with the pre-test attitude (p<0.001). Age and family history of obesity were statistically significantly associated with the pre-test attitude (p<0.05) whereas class in which studying, type of family, area of residence, dietary habits and sources of information were not found to be statistically significantly associated with the pre-test attitude (p=0.05).
DISCUSSION
The aim of the study was to improve
the knowledge and change attitude
regarding prevention of obesity among adolescent girls. This study finding revealed that the planned teaching programme is one of the effective strategies to improve the
knowledge and change attitude of
adolescent girls. A similar study was conducted by Prashanth et al. (2013) the „t‟ value computed between the pre-test and post-test knowledge scores was statistically significant at 0.05 level of significance. The calculated „t‟ value (t=10.57) was greater than the table value (t (49) =2.0096). This indicates that the teaching programme on prevention of obesity was effective in improving the knowledge of adolescents. The „t‟ value (table2) computed between the pre-test and post-test attitude scores was statistically significant at 0.05 level of significance. The „t‟ value (t =3.75) computed was greater than the table value (t(49)=2.0096) and showed that the teaching programme on prevention of obesity was effective in improving the attitude of adolescents. [6] In present study the statistical paired „t‟ test indicated that the mean knowledge found to be increase at the level p<0.001 revealing the effectiveness of planned teaching programme. Hence, H1
was accepted and H01 was rejected.
Attitudes results showed that the statistical paired „t‟ test indicated that the attitude mean score found to be increase at the level p<0.001 revealing the effectiveness of the planned teaching programme. Hence, H2
was accepted and H02 was rejected. A
similar study was conducted by Kaur et al. (2014) that age, sex, family income, area of residence, type of family, dietary habits
were statistically significant whereas
education status, education of mother and hobbies were not statistically significant. [7]
The pre-test knowledge with
personal profile of the subjects‟ such as age, class in which studying, type of family and dietary habits were statistically highly significantly associated with the pre-test knowledge (p<0.001). Area of residence, education of mother, education of father, monthly family income, family history of obesity and sources of information were not found to be statistically significantly associated with the pre-test knowledge (p=0.05).
The pre-test attitude with personal profile of the subjects‟ such as education of mother, education of father and monthly family income were statistically highly significantly associated with the pre-test attitude (p<0.001). Age and family history of obesity were statistically significantly associated with the pre-test attitude (p<0.05) and class in which studying, type of family, area of residence, dietary habits and sources of information were not found to be statistically significantly associated with the pre-test attitude (p=0.05).
CONCLUSION
The study findings revealed that there was significant improvement in post-test knowledge and attitude which showed the effectiveness of planned teaching programme. So educating the adolescent girls regarding prevention of obesity will definitely help to reduce the incidence of
obesity. It was the most effective
intervention and was concerned with promoting health and preventing diseases. In the light of the above findings and personal experience of the investigator the following recommendations are offered. 1. The study can be replicated on all
population samples with different
can be generalized for a larger population.
2. A similar study may be conducted to assess the knowledge, attitudes of mothers regarding obesity of their children.
3. A planned teaching programme can be conducted for adults regarding obesity and its health consequences.
4. A similar study can be replicated in community area.
5. A similar study can be conducted to compare the knowledge and attitude among adolescent girls of urban and rural communities.
6. A comparative study can be conducted to find the prevalence of childhood obesity between urban and rural school children.
Financial and material support:Self
Conflicts of interest:None
REFERENCES
1. Kalra S, Unnikrishnan AG. Obesity in India: The weight of the nation. Indian J EndocrinolMetab, IJEAR [Internet]. 2012 Jan [cited 2015 Oct 16]; 16(1):4-6. Available from: http://www.ijear.org
2. Centre for disease control and prevention. Division of nutrition, Physical Activity and Obesity. Journal of obesity [Internet].2008
[cited 2015 Oct 16]; 88-9. Available from: http://www.cdc.gov/obesity
3. World Health Organization. Childhood overweight and obesity [Internet]. 2014 [cited 2014 Sep 25]. Available from: http://www.who.int/dietphysicalactivity/ childhood/en/.
4. Ghosh A. Explaining overweight and obesity in children and adolescents of Asian Indian origin. Indian J Public Health [Internet]. 2014 May 12[cited 2016 Mar 2]; 58(2):125-128. Available from: http:// www.ijph.in
5. Mahajan A, Negi PC. Prevalence of overweight and obesity in urban school going adolescents in Shimla city. International Journal of Nutrition, Pharmacology, Neurological Diseases [Internet]. 2014 [cited 2015 Oct 17]; 4(5):
23-28. Available from:
http://wwwijnpnd.com
6. Prashanth K & Umarani J. Effect of teaching programme on knowledge and attitude regarding prevention of obesity. International Journal of Bioassays [Internet]. 2013 April 25 [cited 2016 Feb 20]; 2(5):780-782. Available from: http://www.ijbio.com
7. Kaur R, Kumari R, Samuel. A study to assess the knowledge and attitude of adolescents on obesity. International Journal of Education and applied research IJEAR [Internet]. 2014 June [cited 2016 Feb 20]; 4(1):34-39. Available from: http: URL : http://www.ijear.org
***********