* To whom all correspondence should be addressed. Tel: +919739177023;
E-mail: yag_sad@yahoo.com
Analysis and Identification of Mutation in
Chronic Myelogenous Leukemia (CML) and BCR_ABL
in Leukemia Patients aged 40 to 50 Year
Rashmita Sahoo¹, Vidya Harini V.¹,
Fatemeh Esfandiari Ghalati² and Yaghoub Sadeghi²*
¹Head of Triesta Lab. HCG Hospital, Bangalore, India.
²Department of Biotechnology, Bangalore University, Bangalore, India.
(Received: 27 March 2012; accepted: 09 May 2012)
Chronic Myelogenous Leukemia (CML) is one of the few cancers that is known to caused by a single, specific genetic mutation in more than 90% of cases. The transformation to CML is caused by a reciprocal translocation of the BCR gene on chromosome 22 (at q11) and the ABL gene on chromosome 9 (at q34), resulting in a fused BCR-ABL gene dubbed the “Philadelphia chromosome”, approximately 44,000 people in the United States are diagnosed with some form of leukemia. The tyrosine kinase inhibitors (TKIs) Imatinib, Dasatinib, and Nilotinib inhibit activity of the BCR-ABL fusion protein, resulting in both hematologic responses. The aim of my study was to determine and confirm presence of Philadelphia chromosome and presence of BCR-ABL in patient with CML. Determination of the presence of the Ph chromosome by karyotyping at diagnosis is necessary as part of differential diagnosis and as prognosis. The standard methods of banding are the Q, G, R, and C banding techniques. In this study chromosomes have been treated to trypsin for taking different bands. karyotyping and FISH were equal, as shown in the present work, except for the fact that FISH was faster. In cases that did not present metaphases by karyotyping, FISH was extremely useful in providing a result. In daily practice, FISH can be very helpful since index of karyotyping, when the patient is receiving myelotoxic drugs, there may not be enough metaphases for analysis. RT-PCR is still more sensitive but its clinical meaning has to be clarified. Most of PCR include the detection of the translocation at the level of the RNA transcript. The method usually consists of two steps. The first reaction is that of obtaining cDNA from RNA by means of reverse transcription (RT). Subsequently, an aliquot of cDNA is transferred to another tube and subjected to the second reaction, that is, PCR amplification. Two different enzymes are used, namely, reverse transcriptase for the RT step and Taq polymerase for the PCR. Flow cytometry is a technique for analyzing large populations of single cells. For this method, the diagnostician has to analyze multiple bivariate dot plots from the cytometer. The flow cytometric immune bead assay is a fast and easy technique for specific detection of BCR-ABL proteins in leukemic cells. It is not dependent of the breakpoint position in the BCR gene, does not need special laboratory facilities other then a routine flow cytometer, provides results within several hours and it can be run in parallel to routine immunophenotyping.
Key words: Chronic Myelogenous Leukemia, Cancer, Mutation, Mid-age.
Leukemia
All of these forms of blood cancer affect various types of white blood cells, which are made by the bone marrow and help the body fight infections and other diseases. However, a major difference among these cancers is how they grow. The chronic forms of leukemia tend to grow slowly; the acute forms of leukemia grow more quickly
(Margie Patlak, 1998).
Clinical Recommendations
Given the strong evidence demonstrating benefit with BCR-ABL TKIs in patients with CML, NCCN Clinical Practice Guidelines recommends their use in patients with CML with confirmed BCR-ABL transcripts in bone marrow or evidence of translocation on cytogenetics. Treatment-naive patients with chronic phase CML should be started on imatinib, or dasatinib or nilotinib if resistant to or intolerant of imatinib. Patients in accelerated phase should be started on dasatanib or nilotinib, and patients in blast phase should be started on dasatinib. Importantly, if patients are BCR-ABL negative or Ph-negative, diagnosis of CML should be reconsidered (John Goldman, 2008). 4
Mechanism of BCR-ABL in the Pathogenesis of Chronic Myelogenous
If the ABL tyrosine-kinase activity is essential for BCR-ABL-mediated leukaemogenesis, then why are all the leukaemic cells in patients with CML not eradicated by imatinib treatment? Can studies using mouse models of BCR-ABL-mediated leukaemogenesis provide useful information about the mechanisms of this residual disease? (http://www.ncbi.nlm.nih.gov/pubmed).
In examining the role of the ABL kinase activity in mouse BMT models, bone-marrow cells that expressed an ABL-kinase-deficient form of BCR-ABL seemed to propagate normally in mice, although they did not become leukaemogenic. Similarly, human CD34+ cells that express the ABL-kinase-deficient form of BCR-ABL respond to cytokines like normal CD34+ cells. So how does the imatinib, which blocks the kinase activity of ABL, induce apoptosis in CML cells? (http:// www.ncbi.nlm.nih.gov/pubmed).
Cytokines maintain the homeostasis of normal haematopoietic cells, by regulating their proliferation, survival and differentiation. As described above, BCR-ABL can promote the survival and proliferation of myeloid cells
by activating cytokine-receptor signalling. In addition, BCR-ABL induces overproduction of certain cytokines. These activities are likely to account for the massive expansion of haematopoietic cells that occurs during CML development. As the tyrosine-kinase activity of ABL is essential for most, if not all, of the activities of BCR-ABL in regulating cell survival and proliferation, inhibition of the ABL kinase could lead to inhibition of BCR-ABL signalling and reduced production of cytokines. The return to normal level of cytokine concentrations would not be able to support the excessive amount of haematopoietic cells, so the excess CML cells would die of growth-factor starvation (http:// www.ncbi.nlm.nih.gov/pubmed).
Inhibition of the tyrosine-kinase activity of BCR-ABL by imatinib does not simply cause cells to revert to cytokine-dependent growth, however. Imatinib induces apoptosis of patients’ leukaemic progenitor cells that are cultured in the presence of cytokines, with little effect on normal haematopoietic cells. These results indicate that the cytokine signalling is disrupted in CML cells, and that the survival of CML cells has become BCR-ABL dependent. It is possible that 5
BCR-ABL, in activating intracellular signalling pathways, might suppress the normal cytokine response through an unknown mechanism (http://www.ncbi.nlm.nih.gov/ pubmed).
Although in vitro colony formation by
CML progenitor cells is significantly inhibited by imatinib, not all CML cells are sensitive to the drug a subset of CML cells can grow in response to external cytokines independently of the tyrosine kinase activity of BCR-ABL. Furthermore, CD34+ progenitor cells isolated from nucleated bone-marrow cells of patients with a complete cytogenetic response (assayed on unsorted nucleated bone-marrow cells, in which CD34+ cells are rare) to imatinib therapy tested positive for the presence of BCR - ABL when cells were analysed
by fluorescence in situ hybridization. Quantitative
PCR assays have also demonstrated the level of the BCR - ABL transcript was higher in the CD34+
cells isolated from imatinib-treated patients retain functional committed and primitive progenitor capacity. So CML progenitor cells seem to be refractory to imatinib therapy, compared with more mature cells (M.W. Drummond,T.L. Holyoake, 2001).
The mechanism of resistance of CML progenitor cells to imatinib treatment is not known. It is possible that the intracellular concentration of the drug in these cells is low because of their unique efflux-pump activity. More potent BCR-ABL tyrosine-kinase inhibitors, or combinations of BCR-ABL kinase inhibitors, might overcome this problem. It is also possible that residual leukaemic cells express mutant forms of BCR-ABL that are resistant to imatinib. It has been shown that imatinib-resistant mutant forms of BCR-ABL exist in some patients even before imatinib treatment. Furthermore, genetic defects other than t (9; 22) (q34; q11) might cause resistance of CML cells to imatinib. However, rapid expansion of such mutant cells and relapse of the disease are expected. Therefore, this mechanism might not apply to most imatinib-treated patients with a durable and complete cytogenetic response (M.W. Drummond,T.L. Holyoake, 2001).
The most worrisome possibility, with regard to minimal residual disease in patients undergoing treatment with imatinib, is that the survival and even proliferation of some CML progenitors is not fully dependent on BCR-ABL. This would mean that such kinase inhibitors might not be able to kill the cancer stem cells, even when they can fully inhibit the kinase activity of BCR-ABL. 6
There is some evidence to support this idea. BCR-ABL expression promotes cytokine-independent growth of haematopoietic cell lines, such as the murine myeloid cell line 32D and the human megakaryocytic cell line MO7e. Imatinib treatment did not inhibit the proliferation of these cells in the presence of IL-3 (for 32D cells) or GM-CSF (for MO7e cells), although it did induce apoptosis of BCR-ABL-expressing 32D cells and MO7e cells in the absence of cytokines. The proliferative capacity of BCR-ABL expressing 32D, but not MO7e cells, in the presence of imatinib, however, could be rescued by addition of exogenous cytokines. So, imatinib just causes some cells to regain cytokine-dependent proliferation
(Ruibao Ren, 2005).
What does this mean for treatment of patients? Residual disease in CML patients on imatinib might be maintained, at least partially, by the normal haematopoietic environment. A study of human CML cells showed that imatinib functioned by inhibiting the abnormally increased proliferation rates of progenitor cells, rather than by selective induction of apoptosis. Stem-cell quiescence could contribute to such imatinib resistance. So, haematopoietic cells might differ in terms of developing BCR-ABL dependency. In addition, the tyrosine-kinase-defective form of BCR-ABL retains the ability to dysregulate cell adhesion and migration. The effects of these altered cell activities in the maintenance of residual disease in CML patients on imatinib therapy will require further study (Ruibao Ren, 2005).
There are other ways in which CML cells might survive and proliferate even in the presence of a BCR-ABL kinase inhibitor such as imatinib. Recent studies have shown that expression of the AML-associated oncogene MOZ - TIF2, formed
by a fusion of the gene encoding the acetyltransferase MOZ with the gene encoding the nuclear receptor coactivator TIF2, in committed myeloid progenitors such as common myeloid progenitors and GMPs (which have no self-renewing capacity) can induce leukaemia in a BMT mouse model. However, expression of BCR-ABL in these same cell types, using the same model system, fails to induce disease. These results indicate that MOZ-TIF2, but not BCR-ABL, can confer properties of leukaemic stem cells to some haematopoietic progenitors. So it is possible that BCR-ABL-mediated leukaemogenesis relies on the self-renewal capacity of the original haematopoietic stem cell, and that the activity of BCR-ABL might be dispensable for the self-renewal capacity of CML stem cells, (Ruibao Ren, 2005).
Maps for BCR-ABL and BCR_ABL mRNA Transcripts
MATERIAL AND METHODS
Karyotyoing
Spread Chromosome
5ml of patient’s blood (for 12 patients) has taken and centrifuged at 2000 rpm for 5 minutes, at that time the erythrocytes settled by gravity, approximately 4 ml of leukocyte-rich plasma on the top has been left, and a white Buffy coat of leukocytes was formed in the middle. Very carefully this buffy coat has been removed by using of a needle without any mixing. Slowly expel the leukocyte-rich plasma and the buffy coat into a sterile tissue culture flask containing 8 ml of Eagle’s spinner modified media supplemented with 0.1 ml of phytohemagllutin (PHA). Cultures have been incubated for 66-72 hours at 37° C and gently agitate the culture once or twice daily during the incubation period.
0.1ml of colcemid (10 micrograms/ml) was added to the all culture flasks and incubated for an additional 2 hours. The colcemid-treated cells were transferred to a 15 ml centrifuge tube and centrifuged at 225 xg for 10 minutes. Then aspirated and discarded all but 0.5 ml of the supernatant. The bottom of the centrifuge tube has been gently taped to resuspend the cells in the remaining 0.5 ml of culture media. 10 ml of 0.075 M KCl, was added dropwise at first, and then with gentle agitation to the centrifuge tube, gently mixed with each drop. The cells has been stand exactly 6 minutes in the hypotonic KCl. The cells were centrifuged at 225 xg for 6 minutes. The KCl was discarded but 0.5 ml of the supernatant, gently resuspended the cells in this small volume of fluid. 10 ml freshly prepared fixative was added dropwise at first and then with gentle agitation. If the cells were not properly resuspended in previous step, the cells will clump beyond any further use. The cells ha been allowed to stand in fixative at room temperature for 30 minutes. Centrifuged at 200 xg for 5 minutes and removed all but 0.5 ml of supernatant. Resuspend the cells in fresh fixative. The cells were washed twice more in 10 ml volumes of fixative. The fixative was added slowly, recentrifuge, and aspirate the fixative as previously directed (table2). 9
A piece of dry ice against the side of a styrofoam container was kept and lace a clean slide onto the dry ice to chill the slide, then the slide
was removed and air dried, after dried the slide, drop few drops of DNA sample with optimum distance (2 to 3 feet) on the slide, and perform suitable stain (Repeat for all samples).
Staining and banding
Slides before staining have been dried (air dried only); the banding which used in this study was G-banding. Treat fixed and flamed slides in alkaline solution, kept at room temperature for 30 seconds. They have been rinse in saline-citrate solution, 3changes for 5-10 minutes, and then they were incubated in saline-citrate solution, 65° C for 60-72 hours. All the slides treated with 3 changes of 70% ethanol and 3 changes of 95% ethanol (3 minutes). They treated with trypsin for 45 seconds. Air dried and Stained in buffered Giemsa for 5 minutes, briefly was rinsed in distilled water, finally air dried and mounted. Trypsine has been used for detection of bands (Banding) in chromosome.
Photograph from the chromosomes was taken by which have been detected under camera, and then printed them out, arranged the chromosomes and identified the Philadelphia chromosome (figure 3).
Fluorescence in Situe Hybridization (FISH)
Fluorescent in situ hybridization (FISH) is a molecular cytogenetic method used to investigate chromosomal abnormalities associated with leukemias, solid tumors, bone marrow transplants and genetic disorders. The chief advantage of FISH is that it can be applied to non-dividing, uncultured cells (interphase nuclei) when applicable to help establish or confirm diagnoses; whereas, classical cytogenetics require dividing cells. FISH is performed on a variety of specimen types such as blood, bone marrow and paraffin-embedded tissue sections. Because of the higher sensitivity, FISH testing can detect mosaicism for clonal chromosome changes, and is therefore useful in the detection of minimal residual disease following treatment (e.g., interferon for chronic myelogenous leukemia [CML]. Because the majority of specific deletions is sub-microscopic and can only be detected by molecular tests, FISH plays a critical role in the confirmation of microdeletion syndromes (Gordon W, et al, 1998).
dehydrated sequentially in 70%, 85% and 100 % ethanol series, 2 min each, all has been air dried. Probe was prepared in following procedure, 7 μl buffer was added to 1 μl of distilled water, then 1 μl of each probe (in this paper CEP6 Spectrum Green probe and CEP17 Spectrum Orange probe) has been Centrifuged 1-3 seconds (short spin), and they have been Vortex, Recentrifuged and were Heated for 5 min. at 73 °C in a water bath to denaturation process. Denaturant solution (70% Formamide/ 2xSSC) has been placed in 73 °C water bath inside coplin jar; slides were denatured for 5 min, dehydrated in 70%, 85% and 100% ethanol for 2 min. each, and air dried. 10 μl denatured probe has been applied and cover with a cover glass. Hhybridizing area was marked on the all slides used a diamond scribe, they were sealed carefully with rubber cement.the slides has been placed in a prewarmed humidified box (wrapped in metal foil to protect against light) and wereincubated overnight at 42°C. 0.4 X SSC/ 0.3% NP-40 has been placed in a 73°C water bath, cover glasses were removed and immediately placed into wash tank with 0.4xSSC/ 0.3% NP-40. All slides were left in coplin jar for 2 min. The slides were placed in 2xSSC/ 0.1% NP-40 at room temperature for 1 min and air dried in darkness. 20
μl of probe (DAPI) solution has been applied to the target area and putted on cover glass (it has covered hybridized area). Examined slides on a fluorescence microscope. Slides showing more than 50% cells with fluorescent dots were selected for analysis. From each slide, at least 100 overlap signals. Red dots (Rhodamine) corresponded to the ABL (9q34.1) gene and green dots (Fluorescein) to the BCR (22q11) gene, so when one cell with two isolated red and green dots was seen, it was counted as normal, without rearrangement. When a cell with one isolated red dot, one isolated green dot and one fused red and green signal was seen, this was considered as presenting rearrangement (Figure 4). All slides were analyzed by at least two observers. One samples of normal blood donors served as a control. The control provided an estimation of overall hybridization quality of the test material
PCR
Extraction of RNA from the blood sample of the patient
Sample has taken from 12 patients 40 to 50 years and RNA isolation from leukocytes from
fresh peripheral blood samples was performed by TRI method. In this method I have used of TRI solution, which is composed of the following solutions:
· TRI reagent 750 μl · Patient blood 200 μl · Acetic acid 20 μl
Tri-RNA reagent is a reagent from the improved phenol and guanidine isothiocyanate (GSN) method for the single-step RNA isolation. During sample homogenization or lysis, Tri-RNA reagent maintains the integrity of the RNA, while disrupting cells and dissolving cell components. The composition of Tri-RNA reagent includes phenol and GSN in a mono-phase solution. A biological sample is homogenized or lysed in Tri-RNA reagent and homogenate is separated into the aqueous and organic phases by chloroform addition, vortexing and centrifugation. RNA remains exclusively in the aqueous phase (clear upper phase), DNA in the interphase, and proteins remain in the organic phase (red color). RNA is precipitated from aqueous phase by addition of isopropanol and solubilized/concentrated. If needed, DNA and proteins can be sequentially precipitated from the interphase and organic phase with ethanol and isopropanol respectively, and solubilized/concentrated.
In the first step of my project, 200 μl of patient sample was taken and 750 μl of TRI reagent has been added followed by 20 μl of acetic acid, vortexing till gain a uniform solution. Incubate at room temperature for five minutes. 200 μl of chloroform was added and shake it vigorously for 30 seconds, whenever a uniform solution has been formed incubate at room temperature for another five minutes.
Centrifuged the sample at 12000 rcf for 8 minutes at 4°C, in this stage we have observed three layers which, upper layer was RNA middle was DNA and precipitated layer was include protein and other organic matter, I have taken the upper layer which was involved RNA in the separate tube. 500 μl of isopropanol was added to that and incubate at room temperature for 5 to 10 minutes. Centrifuged at 12000 rcf for 8 minutes at 4°C, discard supernatant and pellet was taken, 1 μl ethanol (70%) was added for washing of the pellet, vortexing the solution properly.
5 minutes at 4°C, supernatant was discarded and pellet has been dried which was RNA sample (between 5 to 10 min at room temperature), 20 μl nuclease free water has been added to dried pellet and kept in thermo mixer at 55°C for 10 minutes. It has kept in nano drop spectrophotometer now for quantification of RNA sample (steps have been repeated for all samples).
RT-PCR for bcr-abl
For some years, this chromosomal damage has been detected cytogenetically. However, recently, cytogenetic procedures have been extensively replaced by polymerase chain reaction (PCR) based protocols. The advantages of PCR detection of BCR-ABL translocation lie in its high specificity and unique sensitivity5-7: PCR is able to detect the mutated gene even in some cytogenetically normal (Ph negative) leukaemic clones and can even detect it in the presence of thousands of normal genomes. Thus, PCR is much more informative than cytogenetics alone as a means of t (9, 22) detection (S. Menif, et al, 2007).
RT-PCR was used to amplify the chimeric BCR-ABL mRNA. The nucleotide sequences of
the PCR primers used in BCR-ABL amplification
are listed in Table 3. For all PCR reactions a1025 and 1026 dilution of an Amplichek BCR/ABL positive CML control RNA (BioRad, Hercules, CA) into the Amplichek BCR/ABL negative RNA served as the positive controls. Negative controls included a no-RNA PCR mix (“blank”) and the Amplichek negative control RNA. A separate amplification of ²2m was used as a control of RNA integrity and was performed as previously described. Precautions to eliminate PCR carryover contamination included separate rooms for pre-PCR and amplification procedures, aerosol-resistant pipette tips, and no–nucleic acid PCR reactions as negative controls in all PCR amplification reactions.
First step was creation of the complimentary DNA (cDNA) from RNA with the help of RTPCR which was as follow:
2.2μl of magnesium chloride (MgCl2), 2.5 mMolar was added to the sample, and then 2μl of dNTPs (A, G, C and T) followed by random hexamer or primer 0.5 μl was added to the tube. After that 0.25 μl of enzyme (Reverse transcriptase or RTase) has been added, in the last stage for prevention of degradation of RNA by enzymes (RNase), the
RNase inhibitor has been add 0.2 μl to the tube, this used for all vessels (table 4).
In this stage the samples have transferred to the PCR set and regulate that to convert RNA to cDNA in the following stage which is involve three major stages as follow:
In the first stage samples in the set have regulated to keep at 25ºC for 10 minutes, in the second stage set was at 95 ºC for 5 minutes and in the last stage it was set at 48 ºC for 30 minutes.
Qualitative PCR
After preparation of the cDNA the qualitative PCR has been done by below protocol: First 8μl of positive control (PC) was added to a vessel, after that 2μl of the sample has been added to that, in this stage I have added 1μl of NTC (major β2M), which was reagent of negative control for this experiment, it was followed by adding of 9μl of NT (β2M). The samples were ready for PCR now and samples have kept that in following pattern: Stage i) kept at 94 ºC for 2 minutes which is called
as predenaturation.
Stage ii) puts at 94 ºC for 30 seconds (denaturation satage), followed by 58 ºC for 30 seconds (Annealing stage) and 72 ºC for 1 minutes (extension stage).
Stage iii)again kept at 72 ºC for 7 minutes (final extension stage), in case of any forgetting or later requiring of sample PCR set are able to preserve that at 4 ºC at least for 24 hours. Note: β2M negative control has to be house kept for taking proper result.
After PCR amplified cDNA patient sample was loaded in 1.2% agaros electrophoresis gel, the 1X, TE buffer and electric field was applied. The running of sample was takes place and observed under UV radiation.
Quantitative RT-PC
BCR-ABL breakpoint and an 84-bp product for the b3a2 breakpoint. The amplification product for the β2m gene was 70 bp.
In the Q-PCR assay, 100 nmol/L of a template-specific (either BCR-ABL or β2m) oligonucleotide probe was used. The probes were labeled at the 59 end with 6-carboxy fluorescein and at the 39 end with 6-carboxy-tetramethyl rhodamine. Labeled probes were synthesized by Synthegen (Houston, TX). RT-PCR was carried out in 50-mL reactions containing 1 X PCR buffer (PerkinElmer, Foster City, CA), 1.5 mmol/L MgCl2, 100 μM each deoxynucleoside triphosphate, template-specific primers, 7.5 U Prime Rnase Inhibitor (5 Prime–3 Prime, Boulder, CO), 50 U Superscript II RT (Gibco BRL), 1.25 U Amplitaq DNA Polymerase (PerkinElmer), and 1.25 U Platinum Taq Antibody (Gibco BRL). In addition, each reaction contained a 6-mer attached to a fluorescent dye, 6-carboxy-X-rhodamine to serve as a passive internal reference. The sequences of the primers and probes used for the BCR-ABL and β2m Q-PCR assays are listed in Table 3. The specific primers and amounts for the Q-PCR reaction were as follows: for b2a2, ABLTM (37.5 pmol) and BCRTM2 (37.5 pmol); for b3a2, ABLTM (37.5 pmol) and BCRTM3 (25pmol); and for β2m, β2TMF (12.5 pmol) and β2TMR (12.5 pmol). In the Q-PCR assay,
the initial RT step was carried out at 42°C for 30 minutesfollowed by an inactivation step at 95°C for 5 minutes. The complementary DNA was immediately subjected to 40 cycles of a 2-step PCR. Each cycle consisted of a 15-second denaturation step at 95°C and a 1-minute combined annealing/ extension step at 60°C.
RESULTS
The aim of my study was to determine and confirm presence of Philadelphia chromosome and presence of BCR-ABL in patient with CML. Following data acquisition, plots such as those shown in Figure 6 can be generated using software such as BD FACSDiva™ software. After the capture beads have been identified, the presence of sandwich complexes is confirmed by the bead population’s median fluorescence intensity (MFI) as generated by the detector reagent. A sample positive for BCR-ABL fusion proteins is identified by a PE MFI higher than a predetermined analytical detection limit.
In this study for this test I have used of two different types of blood sample, one from Ph negative (a person with BCR-ABL negative) and another one from a Ph positive (a person with BCR-ABL positive), which the difference is detectable
Table 2. Material requirement for karyotyping(for each slide)
S. No. Compound Name Amount of Compound
Spread DNA
1. Eagle’s spinner 8 ml
2. phytohemagllutin (PHA) 0.1 ml
3. colcemid (10 ¼g/ml) 0.1ml
4. KCl (0.075 M) 10 ml
Sataining & Banding
1. saline-citrate solution Enough amount 2. Ethanol (70% & 95%) Enough amount
3. Giemsa 2-3 drops
4. Trpsin Enough amount
Table 1. Classification of Leukemia (Margie Patlak, 1998)
Cell type Acute Chronic
Lymphocytic Leukemia (or “lymphoblastic”) Acute Lymphoblastic Chronic Lymphocytic
Leukemia (ALL) Leukemia (CLL)
Myelogenous Leukemia (also “Meyloid” Acute Myelogenous Chronic Myelogenous
Table 3. Rt-pcr Primers and Probes
Qualitative RT-PCR First-round RT-PCR
CMLNA 59TGGAGCTGCAGATGCTGACCAACTCG39
CMLNB 59ATCTCCACTGGCCACAAAATCATACA39
Second-round nested PCR
CMLNH 59GATCTCCTCTGACTATGAGCGTCCA39
CMLNI 59-TTCACCTTTAGTTATGCTTAGAGTG39
Quantitative RT-PCR (Q-PCR) bcr-abl b2a2 primers
BCRTM2 59CAT TCC GCT GAC CAT CAA TAA39
ABLTM 59AAC GAG CGG CTT CAC TCA GA39
bcr-abl b3a2 primers
BCRTM3 59CCA CTG GAT TTA AGC AGA GTT CA39
ABLTM 59AAC GAG CGG CTT CAC TCA GA3
bcr-abl probe
ABLTMPROBE 59AGCGGCCAGTAGCATCTGACTTTGAGC39
β2-microglobulin primers
β2TMF 59CAT TCG GGC CGA GAT GTC39
β2TMR 59CTC CAG GCC AGA AAG AGA GAG TAG39
β2-microglobulin probe
Table 4. Qualitative RTPCR material requirement
S. No Compound name Amount of compound (μl)
1. Mgcl2 2.2μl
2. dNTPs 2μl
3. primer 0.5μl
4. RTase 0.25μl
5. RNase inhibitor 0.2μl
6. DNA sample 4μl
7. H2O 0.85
Total 10μl
Table 5. DNA Extraction Result
Purity in 260/280 Purity in 260/230 Concentration of RNA (ng/μl)
1.91 1.13 244.5
in the following figure (figure 6). However it is preferred to use of karyotyping and PCR method due to highly specificity for BCR-ABL.
BCR-ABL
The karyotyping of erythrocytes from the patient’s samples has been done by G-banding staining, and Philadelphia chromosome was observed as it is illuminated in the figure 7, so presence of Ph chromosome is showing that sample is positive for BCR-ABL t(9;22) (q34;q11.1) by conventional karyotyping
The chromosomes were observed under fluorescence microscope, by which three different signals have been detected, green, orange and yellow. Green signals were BCR, orange signal were ABL and yellow signals has detected the BCR-ABL gene present in the chromosome. The green signal is seen in the entire nucleus possessing t (9; 22).
BCR
Fig. 1. Maps of BCR, ABL, and BCR-ABL mRNA transcripts. Primers BCR-C, 828, CA3-, and C5e- were used for multiplex PCR for BCR and BCR-ABL; primers BCR-C and CA3- were used for single-step PCR for BCR-ABL; and primers Nbl, Gly, Me-, and BE16- were used for nested PCR for ABL-BCR (adapted from: A. Hochhaus, et al, 1996)
Fig. 5. The electrophoresis of the samples showed e20a2 band with 436bp size, when analyzed by qualitative and quantitative PCR methods
Fig. 3. Presence of Ph (Philadelphia) chromosome t(9;22)(q34;q11.1) by conventionl karyotyping
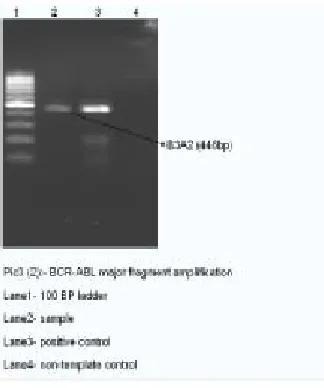
Fig. 7. Implication for BCR-ABL major fragment amplification with RQ-PCR and b3a2 brake point (446 bp) Fig. 6. Shows the implication for micro fragment. Positive for both micro and minor breakage point a clear product size corresponding to this translocation has been detected, which detected e1a3 with 223 bp sizes orange and green signal is seen in all the nucleus
possessing t(9;22).
ABL
In this sample amount of the purification of RNA has been calculated according to the Nanodrop Spectroscopy in the wave length of 260 nm, 280 nm and 230 nm. In this purity in 260/280 was 1.91 and purity in 260/230 was 1.13 by which
the concentration has estimated 244.5 ng/μl. This has shown that the RNA sample is present in good and reliable concentration; we can start other procedure of determination of BCR-ABL.
Graph 1. Implication for house keeping gene β2M by RQ-PCR method. Clear implication has been noted here which qualified the sample for further analysis of fusion quant BCR-ABL. The unknown β2M is blue
Graph 2. The implication of the BCR-ABL major fragment by RQ-PCR method quantities by using known standards. BCR-ABL yellowish graph methods. Figure 4 shows PCR product for minor
fragment run along with electrophoresis gel with no template control and positive control. In this e20a2 band is clear with 436 base pair (bp) size. In the figure 10 the implication for micro fragment has been shown, since the sample was positive for both micro and minor breakage point a clear product size corresponding to this translocation has been detected, which detected e1a3 with 223 bp size. Figure 12 has shown implication for BCR-ABL major fragment amplification with RQ-PCR and b3a2
Table 6. The determination of Philadelphia chromosome by Karyotyping and FIS. Identification of BCR/ABL by flowcytometry. RT-PCR, quantification of the BCR/ABL transcripts in
Ph-positive CML according to age and sex of patients
Case Age/sex Karyotype FISH Flowcytometry MFI RTPCR TT/HD
1 43/M 46,XY,t(9;22)(q34.1;q11) 93% 210 b2a2
2 48/M 46,XY,t(9;22)(q34.1;q11) 89% 177 b3a2
3 44/M 46,XY,t(9;22)(q34.1;q11) 62.5% 112 b2a2-b3a2
4 40/M 46,XY,t(9;22)(q34.1;q11) 95% 213 e1a2-b2a2-b3a2
5 41/M 46,XY,t(9;22)(q34.1;q11) WM 160 b2a2
6 40/F 46,XX,t(9;22)(q34.1;q11) 66% 116 b3a2
7 49/F 46,XX,t(9;22)(q34.1;q11) 98% 217 b2a2
8 44/F 46,XX,t(9;22)(q34.1;q11) 84% 170 b3a2
9 46/M 46,XY,t(9;22)(q34.1;q11) 76% 133 b2a2
10 44/F Without Metaphases 68% 119 b2a2-b3a2
11 48/M Without Metaphases 71% 126 b2a2
12 48/F Without Metaphases 69% 121 b3a2
F=female, M=male, WM=without metaphase
DISCUSSION
Karyotyping
Determination of the presence of the Ph chromosome by karyotyping at diagnosis is necessary as part of differential diagnosis and as prognosis. This is an entirely manual test with a turnaround time of 7 to 15 days .Chromosomes were extracted from erythrocytes of the patient’s blood sample, and dropped on the slide with proper distance. If distance be less the dispread of chromosomes were not proper and many overlapping will be take place, in case of high distance, fraction of chromosome will be formed which detection will be very difficult. A band is an area of a chromosome which is clearly distinct from its neighboring area, but may be lighter or darker than its neighboring region. The standard methods of banding are the Q, G, R, and C banding techniques. In this study chromosomes have been treated to trypsin for taking different bands. The time has to be shorter regarding to high concentration of trypsine and longer in low concentration. Trypsin has specific on the chromosome for cleavage. If more detail is desired, the chromosomes can be treated with various enzymes in combination with stains to yield banding patterns on each chromosome. Three major effects of trypsin are as follow: 1) under digestion which the particular in this stage uptaking high amount of stain (hyper stain), 2) optimum
digestion which can uptake the best amount of stain, 3) over digestion which will not take stain.
Would there be advantages in replacing karyotype detection of Ph by FISH at diagnosis? The initial answer is no, since karyotyping and FISH were equal, as shown in the present work, except for the fact that FISH was faster. In cases that did not present metaphases by karyotyping, FISH was extremely useful in providing a result. In daily practice, FISH can be very helpful since index of karyotyping, when the patient is receiving myelotoxic drugs, there may not be enough metaphases for analysis. The FISH technique is especially valuable in these situations, as it is more sensitive even though it is faster. RT-PCR is still more sensitive but its clinical meaning has to be clarified. FISH allows later study using stored samples that is valuable. The fact that fixed cells were being utilized was useful in this work, although there were some limitations. Many samples from other patients that fitted the aims of this work were not included, often because the stored material was not in an adequate condition or there were not enough interphases for analysis.
RT-PCR
by means of reverse transcription (RT). Subsequently, an aliquot of cDNA is transferred to another tube and subjected to the second reaction, that is, PCR amplification. Two different enzymes are used, namely, reverse transcriptase for the RT step and Taq polymerase for the PCR. RT-PCR can be simplified significantly if another thermostable enzyme, namely Tth, is used instead. Tth is known to possess both RT and DNA polymerase activity.’2 Thus, only minimal adjusting of the reaction mixture in the tube is necessary to switch the process from RT to PCR. Such “one tube” RT-PCR protocols have been developed already for many widely used procedures.’3 ‘4 However, there are no published accounts of the potential benefits of this rapid RT-PCR strategy for the detection of BCR-ABL translocation. In this paper, we present a one tube protocol for BCR-ABL chimaera detection. The method is cheap and time saving. Also, the reduction in the numbers of manipulations minimises the risk of contamination. Finally, this modification combines both the specificity and sensitivity of traditional PCR procedures.
Stage 1: The first step is reverse transcription (RT),
in which RNA is reverse transcribed to cDNA using reverse transcriptase. This step is very important in order to perform PCR since DNA polymerase can act only on DNA templates. The RT step can be performed either in the same tube with PCR (one-step PCR) or in a separate one (two-step PCR) using a temperature between 40°C and 50°C, depending on the properties of the reverse transcriptase used. In this paper I have used of 25 ºC for this stage.
Stage 2: involves the denaturation of the dsDNA
at 95°C, so that the two strands separate and the primers can bind again at lower temperatures and begin a new chain reaction. Duration of this stage was 5 minutes and the enzyme has to be resistance to the high temperature like “Tag Polymerase” which in RTPCR is Tth, it possess both RT and DNA polymerase activity.
Stage 3: Then, the temperature is decreased until
it reaches the annealing temperature which can vary depending on the set of primers used, their concentration, the probe and its concentration, and the cations concentration. The main consideration when choosing the optimal annealing temperature is the melting temperature (Tm) of the primers and probes. The annealing temperature chosen for a
PCR depends directly on length and composition of the primers. This is the result of the difference of hydrogen bonds between A-T (2 bonds) and G-C (3 bonds). An annealing temperature about 5 degrees below the lowest Tm of the pair of primers is usually used, in this experiment I have used of 48 ºC for 30 minutes. Tm can calculate according to the below formula (Stephen A. BUSTIN and Reinhold MUELLER, 2005):
Tm= 4(G+C) +2(A+T)
The final step of PCR amplification is DNA extension from the primers. This is done with thermostable Tth polymerase, usually at 72°C, the temperature at which the enzyme works optimally. The length of the incubation at each temperature, the temperature alterations, and the number of cycles are controlled by a programmable thermal cycler. The analysis of the PCR products depends on the type of PCR applied. If a conventional PCR is used, the PCR product is detected using agarose gel electrophoresis and ethidium bromide.
FISH
Flow cytometery
Flow cytometry is a technique for analyzing large populations of single cells. For this method, the diagnostician has to analyze multiple bivariate dot plots from the cytometer. I developed a simple flow cytometric bead assay for detection of the BCR-ABL fusion protein in cell lysates, using a bead-bound catching antibody against one side of the fusion protein and a fluorochrome-conjugated detection antibody against the other side of the fusion protein. The flow cytometric immune bead assay is a fast and easy technique for specific detection of BCR-ABL proteins in leukemic cells. It is not dependent of the breakpoint position in the BCR gene, does not need special laboratory facilities other then a routine flow cytometer, provides results within several hours and it can be run in parallel to routine immunophenotyping (no extra technician time needed).
CONCLUSIONS
To conclude since karyotyping and FISH were equal, as shown in the present work, except for the fact that FISH was faster. In cases that did not present metaphases by karyotyping, FISH was extremely useful in providing a result. With karyotyping Philadelphia chromosome can be detected in a clear pattern. In daily practice, FISH can be very helpful since index of karyotyping, when the patient is receiving myelotoxic drugs, there may not be enough metaphases for analysis. The FISH technique is especially valuable in these situations, as it is more sensitive even though it is faster. RT-PCR is still more sensitive but its clinical meaning has to be clarified. By RT-PCR b3a2 brake point has been detected and by RQ-PCR method house keeping gene ²2M has been detected and also by PCR method BCR-ABL can be recognize which is highly sensitive, but still no demonstrable Ph chromosome and no M-bcr rearrangement in this method. The flow cytometric immune bead assay is a fast and easy technique for specific detection of BCR-ABL proteins in leukemic cells. It is not dependent of the breakpoint position in the BCR gene, within several hours provide results. But still no detection of particular gene is in this method, so more suitable for diagnostic. 26
ACKNOWLEDGMENTS
With grateful thanks to Dr. Amit Verma for his helpful aid and Triesta Reference Lab at HCG hospital to providing facilities, equipments and material requirements as well as supplying a perfect area to work. Also with special thanks to Dr. Morteza Atri for giving his attention in order to edition of this paper.
REFERENCES
1. Tannock I.F, Hill R.P et al. (eds.) (2005). The Basic Science of Oncology 4th ed. McGraw-Hill. ISBN 0-07138-774-9.
2. Silke Appel, Andreas M. Boehmler, Frank Grünebach, Martin R. Müller, Anette Rupf, Markus M, Weck, Ulrike Hartmann, Volker L. Reichardt, Lothar Kanz, Tim H. Brümmendorf and Peter Brossart (2004)/ Imatinib mesylate affects the development and unction of dendritic cells generated from CD34 (+) peripheral blood progenitor cells/ Washington DC 20036/ 103: 538-544.
3. Dasatinib (BMS-354825)/ Oncologic Drug Advisory Committee (Odac) Briefing Document (2006)/ Bristol Myers Squibb Company/ Wallingford, CT 06492-7660.
4. John Goldman (2008)/ Recommendations for the Management of BCR-ABL-positive Chronic Myeloid Leukemia/ British Committee for Standards in Haematology/ London W12 0NN.
5. Mercedes E. Gorre, Katharine Ellwood-Yen, Gabriela Chiosis, Neal Rosen and Charles L. Sawyers (2002)/ BCR-ABL point mutants isolated from patients with imatinib mesylate resistant chronic myeloid leukemia remain sensitive to inhibitors of the BCR-ABL chaperone heat shock protein 90/ doi: 10.1182/ blood-1361.
6. Alfonso Quintas-Cardama, Hagop Kantarjian, Dan Jones, Claude Nicaise, Susan O’Brien, Francis Giles, Moshe Talpaz and Jorge Corte (2006)/ Dasatinib (BMS-354825) is active in Philadelphia chromosome–positive therapy failure chronic myelogenous leukemia after imatinib and nilotinib (AMN107)/ doi:10.1182/ blood-07-035493
J. Giles, Kapil N. Bhalla, Javier Pinilla-Ibarz, Richard A. Larson, Norbert (2010)/ results phase after imatinib resistance or intolerance: 24-month follow-up Nilotinib is effective in patients with chronic myeloid leukemia in chronic/
doi:10.1182/blood-277152.
8. Weisberg. E, Manley. P, Mestan. J, Cowan-Jacob. S, Ray. A, Griffin JD (2006)/ “AMN107 (nilotinib)/ a novel and selective inhibitor of BCR-ABL”/ Br. J. Cancer 94 (12): 1765–doi:10.1038/ sj.bjc.6603170.
9. A. Hochhaus, A. Reiter, H. Skladny, J.V. Melo, C. Sick, U. Berger, J.Q. Guo, R.B. Arlinghaus, R. Hehlmann, J.M. Goldman and N.C. Cross (1996)/ chromosome-negative chronic myelogenous leukemia A novel BCR-ABL fusion gene (e6a2) in a patient with Philadelphia/
1996 88: 2236-2240.
10. Mary E. D. Flowers, Keith Kerkof, Ross Nelson and Frederick R. Appelbaum Jerald P. Radich, Ted Gooley, Eileen Bryant, Tom Chauncey, Reginald Clift, Lan Beppu, Scott Edmands/ patients ‘’late,’’ 18 months or more after transplantationThe significance of bcr-abl
molecular detection in chronic myeloid leukemia/
doi:10.1182/blood.V98.6.1701.
11. S. Menif, , S. Zarrouki, R. Jeddi, N. ben Alaya, Z. BelHadj Ali, H. Ben Abid, S. Hdeiji, M. Elloumi, A. Khlif, B. Meddeb and K. Dellagi (2007)/ Quantitative detection of bcr-abl
transcripts in chronic myeloid leukemia, Quantification du transcrit bcr-abl dans la
leucemie myeloide chronique/ doi:10.1016/ j.patbio.12.010
12. Sidorova JYu, L. B. Saltykova, A. A. Lyschov, Zaritskey AYu, K. M. Abdulkadyrov, and M. N. Blinov. A rapid RT-PCR based method for the detection of BCR-ABL translocation/ Mol Pathol. 50(5): 266–268 (1997).
13. Yuan Wei, Mats Hardling, Bob Olsson, Rahil Hezaveh, Anne Ricksten, Dick Stockelberg and Hans Wadenvik (2006)/ Not all imatinib resistance in CML are BCR-ABL kinase domain
mutations/ Volume 85, Number 12, 841-847, DOI: 10.1007/ss00277-006-0171-8.
14. Masayoshi Masuko, Tatsuo Furukawa, Takashi Abe, Reiko Wada, Soichi Maruyama, Toshiki Kitajima,Yasuhiko Shibasaki, Ken Toba, Masahiko Okada and Yoshifusa Aizawa (2009)/ A chronic myeloid leukemia patient with atypical karyotype and BCR–ABLe13a3 transcript caused
by complex chromosome rearrangement/ DOI: 10.1007/s12185-009-0368-4.
15. Reena R.M.Z, Julia Munchar. M.J, Salwati. S, Zubaidah. Z, Hamidah. N.H, Sharifah N.A,Cheong. S.K (2006)/Detection of BCR/
ABL Gene in Chronic Myeloid Leukaemia: Comparison of Fluorescence in situ Hybridisation (FISH), Conventional Cytogenetics and Polymerase Chain Reaction (PCR) Techniques/ Med & Health; 1(1): 5-13.
16. Stephen A. BUSTIN and Reinhold MUELLER (2005)/Real-time reverse transcription PCR (qRT-PCR) and its potential use in clinical diagnosi/ doi: 10.1042/CS20050086.
17. Jalal, Jack L. Spurbeck and Richard T. Silver Gordon W. Dewald, William A. Wyatt, Amy L. Juneau, Richard O. Carlson, Alan R. Zinsmeister, Syed. M (1998)/ Myeloid Leukemia Double BCR/ABL Fusion and Monitor Response to Therapy in Chronic Highly Sensitive Fluorescence in Situ Hybridization Method to Detec/ 1998 91: 3357-3365.
18. Prochi Madon, Arundhati Athalye, Vijay Bandkar, Suresh Dhumal, Arifa Sopariwala and Firuza Parik (2003)/ Fluorescence in-situ Hybridization (FISH) – A Rapid and Useful Technique for Diagnosis and Management in Leukemi/ Int J Hum Genet, 3(2): 115-119.
19. Margie Patlak (2002)/ Targeting Leukemia from Bench to Bedside/ 12, suppl.1, 556.
20. Ruibao Ren (2005)/ Mechanisms of BCR-ABL in the Pathogenesis of Chronic Myelogenous Leukemia/ Nat Rev Cancer, 5(3):172-183.
21. Su Chu, Melissa Holtz, Mamta Gupta and Ravi Bhatia (2003)/ BCR/ABL kinase inhibition by imatinib mesylate enhances MAP kinase activity in chronic myelogenous leukemia CD34+ cells/
doi: 10.1182/blood-04-1271.
22. Arnauld C.Verschur (2004)/ Department of Pediatric Oncology Academic Medical Center, University of Amsterdam, Emma Children Hospital AMC/ Acute Myelomonocytic Leukemia. 23. Helen Moore and Natasha K. Li (2004)/ A
mathematical model for chronic myelogenous leukemia (CML) and T cell interaction/ Journal of Theoretical Biology 227 513–523/ CA 94305, USA.
24. M.W. Drummond,T.L. Holyoake (2001)/ Tyrosine kinase inhibitors in the treatment of chronic myeloid leukaemia: so far so good/ Blood Reviews/ doi: 10.1054/blre.2001.0152.