Volume 11 Issue 1 2019
DOI: 10.21315/eimj2019.11.1.3
ARTICLE INFO
Submitted: 17-12-2018 Accepted: 03-02-2019 Online: 29-03-2019
CORRESPONDING AUTHOR Gerard Urimubenshi, Institute of Cardiovascular and Medical Sciences, University of Glasgow, University Avenue, Glasgow, G12 8QQ, United Kingdom | Email: [email protected]
To cite this article: Urimubenshi G, Dahir JA, Niyotwiringiye S, Furaha D, Asingizwe D. Exploring the perception of the educational environment among health sciences students at the University of Rwanda: a mixed methods study. Education in Medicine Journal. 2019;11(1):21–30. https://doi. org/10.21315/eimj2019.11.1.3
To link to this article: https://doi.org/10.21315/eimj2019.11.1.3
ABSTRACT
The educational environment (EE) plays a very important role in effective learning. However, information about the quality of the EE at the University of Rwanda (UR) is limited. We aimed to
explore the perception of health sciences students about their EE at UR. Weused a mixed methods
design. Of 606 health sciences students in total, 241 participants were recruited for a quantitative survey using the Dundee Ready Education Environment Measure (DREEM) questionnaire. Additionally, we purposively recruited 10 participants for the qualitative data collection using an
interview guide. We used descriptive statistics, independent samples t-test and analysis of variance
(ANOVA) test to analyse the quantitative data. The interview verbatims were transcribed and analysed using a thematic approach. The overall mean score of DREEM was 133.74±20.00 which indicates a
more positive environment. Female students had higher score than males in the academic (p = 0.005)
and social (p = 0.001) perception sub-domains. There were also differences in academic
self-perception (p = 0.008) and learning atmosphere (p = 0.002) across the departments. The qualitative
interviews revealed some specific problems that need to be addressed such as the shortage of financial means during clinical placements; occasional lack of lecturers; insufficient time for hands-on-practice;
insufficient chairs in classrooms; and delays in providing feedback to students. Health sciences
students at the UR had a positive perception towards their EE. However, there is a need for more efforts to make the environment more positive.
Keywords: Dundee ready education environment measure, Educational environment, Health sciences students, Mixed methods, University of Rwanda
Exploring the Perception of the Educational
Environment among Health Sciences Students
at The University of Rwanda: A Mixed Methods
Study
Gerard Urimubenshi1,2, Jabarti Ahmed Dahir1, Seraphin Niyotwiringiye1, Donath Furaha1, Domina Asingizwe1,3
1Department of Physiotherapy, College of Medicine and Health
Sciences, University of Rwanda, Kigali, RWANDA
2Institute of Cardiovascular and Medical Sciences, University of
Glasgow, Glasgow, UNITED KINGDOM
3Wageningen University and Research, Wageningen,
in need of change to achieve a desirable and convenient EE for all the students.
METHODS
Ethical Statement
Ethical clearance and permission to conduct the study were respectively granted by the research committee of the School of Health Sciences (Ref. No. 061/UR-CMHS-SHS/2018) and the Principal of the College of Medicine and Health Sciences, University of Rwanda (Ref. No. 172/UR-CMHS/18). The students were formally briefed about the study and were informed that participation was voluntary and that they had the right to withdraw from the study at any time. Additionally, the data collection was anonymous.
Study Design
We used a concurrent mixed methods design consisting of a quantitative cross-sectional survey and a qualitative method by in-depth interviews. The quantitative cross-sectional approach provided participants with opportunities to evaluate their EE with structured measurement scales while the qualitative in-depth interviews enabled them to deeply clarify their experiences regarding their EE.
Participants
The study population (N) consisted of 606 students registered in all academic levels in the School of Health Sciences, College of Medicine and Health Sciences, UR, academic year 2017–2018. The sample for the quantitative data collection was determined in three stages. First, the sample size was calculated using a formula (14) which is recommended when nothing is known about the behaviour of a population:
n = N / (1 + Ne2) where e was 0.05, giving
n = 241 participants. Second, we
determined the number of students to recruit from each department and
INTRODUCTION
Health care students experience a variety of learning activities in their educational environment (EE) which is usually complex and unique (1). The EE can be described as the spirit and personality of an educational institution (2), and consists of three major components including the physical environment, the emotional climate and the intellectual climate (3). There is a connection between EE as experienced by the students and their achievement, satisfaction and success in medical schools (4–6).Consequently, the World Federation for Medical Education has considered EE as one of the targets for the evaluation
of medical education programmes to
help adjust, manage and change training programmes with the aim of improving learning quality (7).
of the perceived experiences, and they were related to all DREEM domains and individual items.
Data Collection
Both quantitative and qualitative data were collected from April to June 2018.
Quantitative data collection
The students were requested to provide their demographic details and mark their responses to each of the 50 statements.
Qualitative data collection
Interviews were conducted in English in a convenient locations to ensure good quality recordings and without possible interruptions and distractions. They were face-to-face and took around 40 minutes in average for each participant. All interviews were audiotape-recorded, and one researcher was taking field notes.
Data Analysis
Quantitative data analysis
Out of a total of 50 DREEM questions, nine nega tive items (Items 4, 8, 9, 17, 25, 35, 39, 48, and 50) were scored in a reverse manner prior to analysis and interpretation (6). The quantitative data were then analysed using the Statistical Package for the Social Sciences (IBM Corp., USA) Version 24. First, we computed the descriptive statistics including frequency, mean and standard deviations of the perceptions’ scores for individual items, sub-domains and total DREEM. A guide to score interpretation was provided in a similar publication (12).
Second, we performed analytical statistical tests to explore the relationship between the perception scores and participants’ gender using independent samples t-test and participants’ department and academic level using one-way analysis of variance
(ANOVA) test. For minimising the risk
for Type I error, we used the Bonferroni academic level based on their proportions
within the total population. Third, a systematic approach called an Nth name
selection technique was used to select the required number of participants from each department and academic level. The sampling interval was determined based on the size of the class and a starting number was chosen randomly.
The sample for qualitative data collection consisted of 10 participants drawn from the quantitative sample. The qualitative sampling procedure was mainly purposive, and we selected the participants that represent male and female students, all departments and all academic levels as much as possible. These characteristics were found to be significantly associated with the perception of EE among students (15) and were expected to contribute to a richer variation of the views about the study topic.
Materials
Dundee Ready Education Environment Measure (DREEM)
DREEM was developed (16) as a generic instrument for measuring students’ perceptions of their EE and was found to have high concurrent validity (r = 0.84) and internal consistency reliability (r = 0.93) coefficients (17). It consists of 50 statements and gives a universal score of a maximum of 200. It is capable of measuring five separate elements directly relevant to the EE: learning, lecturers, academic atmosphere, as well as social and academic self-perception (16). For each item on the questionnaire, students provided a score ranging from 0 to 4 (0 = strongly disagree, 1 = disagree, 2 = unsure, 3 = agree and 4 = strongly agree).
Qualitative interview guide
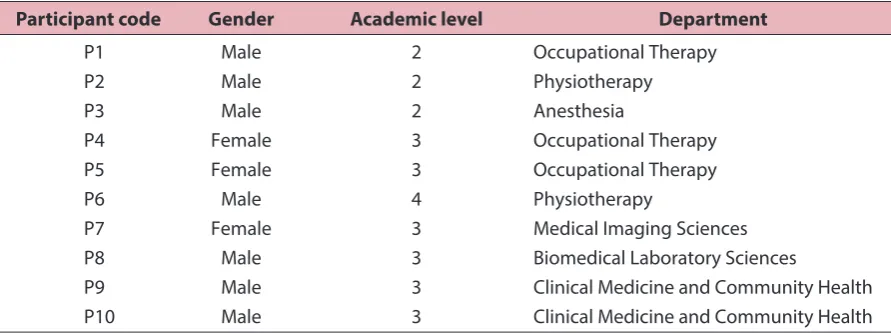
For the qualitative in-depth interviews, of 10 participants, six were in third year and seven were males as illustrated in Table 2.
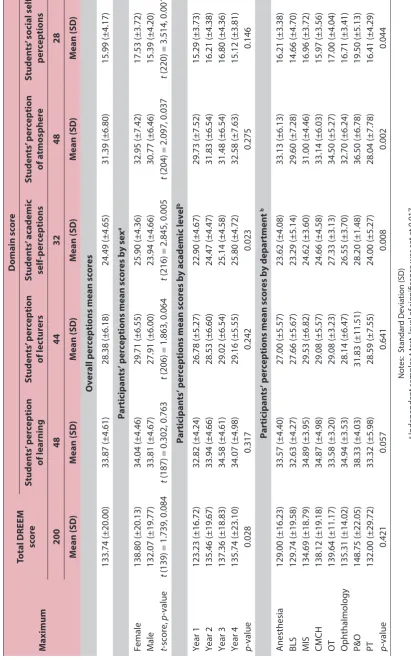
The total mean DREEM score from the students’ perception was 133.74±20.00 out of a total of 200 points (Table 3), which can be interpreted as a “more positive than negative” perception of the EE at the UR. The mean scores for all the students also indicated that all the DREEM sub-domains were perceived as “more positive than negative”. Generally female students had higher mean scores than male students in total DREEM score and all sub-domains, but the differences were statistically significant only for the academic (p = 0.005) and social (p = 0.001) self-perception sub-domains. The results also indicated that there were differences in perception of the EE across the departments. However, the differences were statistically significant only for the domains of academic self-perception
(p = 0.008) and teaching atmosphere
(p = 0.002).
Qualitative Results
Generally, the interview participants expressed that they were satisfied with their education at the UR:
correction method to determine the critical p-value (alpha). As we had three independent variables in the analysis, we divided p = 0.05 by 3 and we got the Bonferroni critical value p = 0.017 as the level of significance.
Qualitative data analysis
The qualitative data were analysed using a thematic approach. Tape-recorded interviews were transcribed, and common concepts were coded to generate themes that were then classified into broader categories according to the DREEM sub-domains. To enhance trustworthiness of the findings, we used peer checking by having three authors read the raw data and having in-depth discussions on the findings.
RESULTS
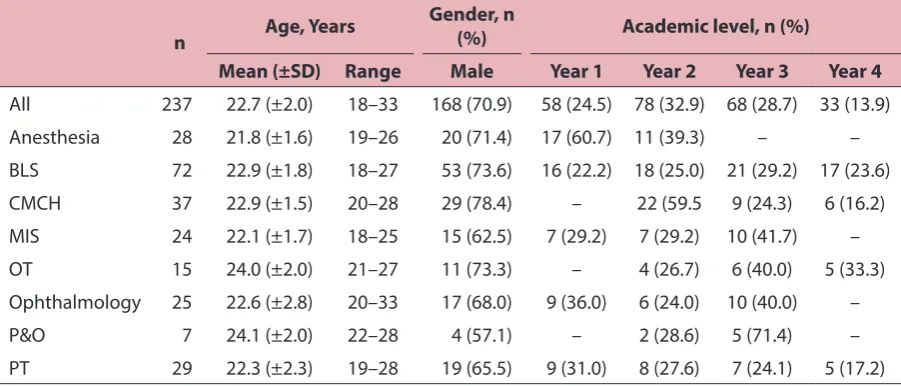
Of 241 questionnaires that were distributed, 237 were completed and returned, giving the response rate of 98.34%. The mean age of the study participants was 22.7 (±2.0) years. Only 29% of the participants were females. Table 1 shows the quantitative survey participants by gender, academic level and department.
Table 1: Distribution of the quantitative survey participants by gender, academic level and department
n Age, Years
Gender, n
(%) Academic level, n (%)
Mean (±SD) Range Male Year 1 Year 2 Year 3 Year 4
All 237 22.7 (±2.0) 18–33 168 (70.9) 58 (24.5) 78 (32.9) 68 (28.7) 33 (13.9)
Anesthesia 28 21.8 (±1.6) 19–26 20 (71.4) 17 (60.7) 11 (39.3) – –
BLS 72 22.9 (±1.8) 18–27 53 (73.6) 16 (22.2) 18 (25.0) 21 (29.2) 17 (23.6)
CMCH 37 22.9 (±1.5) 20–28 29 (78.4) – 22 (59.5 9 (24.3) 6 (16.2)
MIS 24 22.1 (±1.7) 18–25 15 (62.5) 7 (29.2) 7 (29.2) 10 (41.7) –
OT 15 24.0 (±2.0) 21–27 11 (73.3) – 4 (26.7) 6 (40.0) 5 (33.3)
Ophthalmology 25 22.6 (±2.8) 20–33 17 (68.0) 9 (36.0) 6 (24.0) 10 (40.0) –
P&O 7 24.1 (±2.0) 22–28 4 (57.1) – 2 (28.6) 5 (71.4) –
PT 29 22.3 (±2.3) 19–28 19 (65.5) 9 (31.0) 8 (27.6) 7 (24.1) 5 (17.2)
Notes: Biomedical Laboratory Sciences (BLS); Clinical Medicine and Community Health (CMCH); Medical Imaging Sciences (MIS); Occupational Therapy (OT); Prosthetics and Orthotics (P&O); Physiotherapy (PT); Standard Deviation (SD);
Our lecturers have knowledge and skills about what they teach.
However, some participants complained about lecturers who do not provide enough explanation during classes and those who delay providing feedback to students:
Some lecturers tell the students to go and read without enough explanation!
Most of the time we do the exams without knowing the continuous assessment marks.
Academic self-perception
Different interview participants expressed that they were confident with their knowledge and skills.A participant said:
I got a lot of skills and now I know how to handle many cases related to my programme.
Academic atmosphere
Participants revealed many barriers related to atmosphere such noise from car traffic for one campus located in Kigali City and lack of enough chairs:
In Remera Campus there is a lot of noise outside which is a barrier for students to be attentive in class. I am very happy and generally, I
can say that the education in the UR is good.
Responding to different probes, several themes emerged as barriers or weaknesses in their education system. These were categorised in the five DREEM sub-domains.
Lecturing
The interview results revealed that there were some areas that needed to be improved such as lack of lecturers sometimes, insufficient time for hands-on-practice, and shortage of financial means during clinical placement. Examples of the participants’ expression are provided below:
I cannot say lecturing is good or bad. There are many problems. For example, sometimes lecturers don’t teach students regularly.
…the lecturers teach more theories than practical skills”.
Regarding clinical placements, students are struggling because of lack of financial resources.
Lecturers
The qualitative results indicated that the participants viewed their lecturers as being knowledgeable and moving in the right direction. For instance, a participant said:
Table 2: Distribution of the qualitative participants by gender, academic level and department
Participant code Gender Academic level Department
P1 Male 2 Occupational Therapy
P2 Male 2 Physiotherapy
P3 Male 2 Anesthesia
P4 Female 3 Occupational Therapy
P5 Female 3 Occupational Therapy
P6 Male 4 Physiotherapy
P7 Female 3 Medical Imaging Sciences
P8 Male 3 Biomedical Laboratory Sciences
P9 Male 3 Clinical Medicine and Community Health
Table 3:
C
ompar
ison of the par
ticipan
ts
’ per
ceptions b
y se
x, academic lev
el and depar
tmen t M aximum Total DREEM sc or e Domain sc or e Studen ts ’ p er ception of learning Studen ts ’ p er ception of lec tur ers Studen ts ’ ac ademic self -p er ceptions Studen ts ’ p er ception of a tmospher e Studen ts ’ so cial self -per ceptions 200 48 44 32 48 28 M ean (SD ) M ean (SD ) M ean (SD ) M ean (SD ) M ean (SD ) M ean (SD )
Overall perceptions mean scores
133.74 (±20.00) 33.87 (±4.61) 28.38 (±6.18) 24.49 (±4.65) 31.39 (±6.80) 15.99 (±4.17)
Participants’ perceptions mean scores by sex
a Female 138.80 (±20.13) 34.04 (±4.46) 29.71 (±6.55) 25.90 (±4.36) 32.95 (±7.42) 17.53 (±3.72) Male 132.07 (±19.77) 33.81 (±4.67) 27.91 (±6.00) 23.94 (±4.66) 30.77 (±6.46) 15.39 (±4.20) t -score, p -value t
(139) = 1.739, 0.084
t
(187) = 0.302, 0.763
t
(206) = 1.863, 0.064
t
(216) = 2.845, 0.005
t
(204) = 2.097, 0.037
t
(220) = 3.514, 0.001
Participants’ perceptions mean scores by academic
level b Year 1 123.23 (±16.72) 32.82 (±4.24) 26.78 (±5.27) 22.90 (±4.67) 29.73 (±7.52) 15.29 (±3.73) Year 2 135.46 (±19.67) 33.94 (±4.66) 28.53 (±6.60) 24.47 (±4.47) 31.83 (±6.54) 16.21 (±4.38) Year 3 137.36 (±18.83) 34.58 (±4.61) 29.02 (±6.54) 25.14 (±4.58) 31.48 (±6.54) 16.80 (±4.36) Year 4 135.74 (±23.10) 34.07 (±4.98) 29.16 (±5.55) 25.80 (±4.72) 32.58 (±7.63) 15.12 (±3.81) p -value 0.028 0.317 0.242 0.023 0.275 0.146
Participants’ perceptions mean scores by department
b Anesthesia 129.00 (±16.23) 33.57 (±4.40) 27.00 (±5.57) 23.62 (±4.08) 33.13 (±6.13) 16.21 (±3.38) BLS 129.74 (±19.58) 32.63 (±4.27) 27.66 (±5.67) 23.29 (±5.14) 29.60 (±7.28) 14.66 (±4.70) MIS 134.69 (±18.79) 34.89 (±3.95) 29.53 (±6.82) 24.62 (±3.60) 31.00 (±4.46) 16.96 (±3.72) CMCH 138.12 (±19.18) 34.87 (±4.98) 29.08 (±5.57) 24.66 (±4.58) 33.14 (±6.03) 15.97 (±3.56) OT 139.64 (±11.17) 33.58 (±3.20) 29.08 (±3.23) 27.33 (±3.13) 34.50 (±5.27) 17.00 (±4.04) Ophthalmology 135.31 (±14.02) 34.94 (±3.53) 28.14 (±6.47) 26.55 (±3.70) 32.70 (±6.24) 16.71 (±3.41) P&O 148.75 (±22.05) 38.33 (±4.03) 31.83 (±11.51) 28.20 (±1.48) 36.50 (±6.78) 19.50 (±5.13) PT 132.00 (±29.72) 33.32 (±5.98) 28.59 (±7.55) 24.00 (±5.27) 28.04 (±7.78) 16.41 (±4.29) p -value 0.421 0.057 0.641 0.008 0.002 0.044 Not
es: S
tandar
d D
evia
tion (SD
)
a Independen
t samples
t
-t
est
, lev
el of sig
nificanc
e w
as set a
t 0.017
b One
-w
ay analy
sis of v
ar ianc e ( ANOV A ) t est , lev
el of sig
nificanc
e w
as set a
between male and female participants with caution. Studies in India (20) and Sri Lanka (21) have reported different results, and this is likely due to socio-cultural elements of communities under study (10).
We also found that the participants from the departments of Prosthetics and Orthotics, and Occupational Therapy responded more positively than those from other departments regarding statements assessing academic-self (p = 0.008) and institutional atmosphere (p = 0.002) perceptions. In contrast, in a similar study(22) conducted at Yazd University of Medical Sciences in Iran, there were no differences between the mean total scores in different departments. Our findings may indicate the variations in the EE domains across the departments of the School of Health Sciences, UR. However, the departments of Prosthetics and Orthotics (n = 7) and Occupational Therapy (n = 15) had smaller sample sizes than other departments, and hence, there could have been an overestimation of perception mean scores for the two departments.
The quantitative results were corroborated by the qualitative ones, and these highlighted some specific issues that need to be addressed. For instance, the quantitative finding that the social domain had the lowest perception score (14.58/28), and which was consistent with results from other similar studies (13, 23), was confirmed by the qualitative findings. During the interviews, it appeared that the most overwhelming challenge for the students in general was the overpopulation in the students’ rooms as mentioned by all the interview participants.
Other qualitative participants’ specific concerns were the need for financial support during clinical placement, enough chairs in classrooms, and timely provision of feedback to students.
To the best of our knowledge, this was the first study that explored the perception of the EE among health sciences students at the UR. Our study sample involved Some students don’t find chairs!
It’s very difficult to find where to sit.
Social self-perception
Regarding social self-perception, all the participants said that they had friends on campus and enjoyed interacting with their classmates:
Social environment is good, students respect each other.
By contrast, all interview participants said that their accommodation was not good because of too many students living in one small room:
Definitely my accommodation is not pleasant because I am living in a small room with many colleagues.
DISCUSSION
Overall, the students perceived their EE as being more positive than negative across all the five domains. This was consistent with the findings from similar studies conducted in India (15), Iran (10), and Philippines (11). However, the total mean score in our study (133.74) was higher than the ones found in Iran [106] (10), India [120.2] (15), and Philippines [121.26](11),and this difference may suggest that the Rwandan students had a better EE or had an attitude of being more appreciative of their EE.
REFERENCES
1. Veerapen K, McAleer S. Students’ perception of the learning environment in a distributed medical program. Med Educ Online. 2010;5:1–18.
2. Holt MC, Roff S. Development and validation of the anaesthetic theatre educational environment measure (ATEEM). Med Teach. 2004;26(6):553–58. https://doi.org/10.1080/0142159041000171 1599
3. Clapham M, Wall D, Batchelor A. Educational environment in intensive care medicine: use of postgraduate hospital EE measure (PHEEM). Med Teach. 2007;29(6):184–91. https://doi.org/10.1080/ 01421590701288580
4. Al Rukban MO, Khalil MS, Al-Zalabani A. Learning environment in medical schools adopting different educational strategies. Educ Res Rev. 2010;5(3):126–9.
5. Soemantri D, Herrera C, Riquelme A.
Measuring the educational environ ment
in health professions studies: a systematic review. Med Teach. 2010;32(12):947–52. https://doi.org/10.3109/01421591003686229
6. Nahar N, Talukder MHK, Khan MTH, Mohammad S, Nargis T. Students’ perception of educational environment of medical colleges in Bangladesh. Bangabandhu Sheikh Mujib Medical University Journal. 2010;3(2):97–102.
7. The Executive Council of World Federation for Medical Education. International standards in medical education, assessment and accreditation of medical schools’educational programs. A WFME position paper. Med Educ. 1998;32(5):549– 58. https://doi.org/10.1046/j.1365-2923. 1998.00302.x
students from all the departments and academic levels in the School of Health Sciences. Additionally, we used a mixed method to collect the data for our aim, and the qualitative findings helped to confirm the quantitative ones and to deeply explore the weaknesses and strengths within the school. We used a standardised instrument for the quantitative survey and during the data analysis we adopted the Bonferroni correction method to control the Type I error.
However, our study is also subject to some limitations. First, the interpretation of the interview verbatims was not validated by the participants, but we used the peer checking technique to minimise the individual biases and to ensure accuracy during data analysis. Second, there were no first-year students among the qualitative interview participants while they could perhaps have some special issues to report as the new members of the university community. Finally, our study involved students from the School of Health Sciences only and the results cannot be generalised to the whole UR.
CONCLUSION
This study has revealed that the overall perception of the students in the School of Health Sciences, UR about their EE was more positive than negative and indicated that there were several areas that required more efforts for making the environment more positive. This study provided the initial data that could be used as a basis for further studies and interventions towards the improvement of the academic learning environment in the UR.
ACKNOWLEDGEMENTS
15. Sunkad MA, Javali S, Shivapur Y, Wantamutte A. Health sciences students’ perception of the educational environment of KLE University, India as measured with the Dundee Ready Educational Environment Measure (DREEM). J Educ Eval Health Prof. 2015;12:37–40. https://doi.org/10.3352/jeehp.2015.12.37
16. Roff S, McAleer S, Harden RM, Al-Qahtani M, Ahmed AU, Deza H, Groenen G, Primparyon P. Development and validation of the Dundee Ready Education Environment Measure (DREEM). Med Teach. 1997;19(4):295–9. https://doi. org/10.3109/01421599709034208
17. De Oliveira Filho GR, Vieira JE, Schonhorst L. Psychometric properties of the Dundee Ready Educational Environment Measure (DREEM) applied to medical residents. Med Teach. 2005;27(4): 343–7. https://doi. org/10.1080/01421590500046387
18. Makhdoom NM. Assessment of the quality of educational climate during undergraduate clinical teaching years in the college of medicine, Taibah University. Journal of Taibah University Medical Sciences. 2009;4(1):42–52. https://doi.org/10.1016/ S1658-3612(09)70092-7
19. Imran N, Khalid F, Haider II, Jawaid M, Irfan M, Mahmood A, IjlalHaider M, Sami-ud-din. Student’s perceptions of educational environment across multiple under-graduate medical institutions in Pakistan using DREEM inventory. J Pak Med Assoc. 2015;65(1):24–8.
20. Dashputra A, Chari S, Gade S. Perception of educational environment in a private medical college in central India. Int J Edu Sci. 2014;6(3):489–96. https://doi.org/10.10 80/09751122.2014.11890160
8. Palmgren PJ, Lindquist I, Sundberg T, Nilsson GH, Laksov KB. Exploring perceptions of the educational environment among undergraduate physiotherapy students. Int J Med Educ. 2014;5:135–46. https://doi.org/10.5116/ijme.53a5.7457
9. Chandran CR, Ranjan R. Students’ perceptions of educational climate in a new dental college using the DREEM tool. Adv Med Educ Pract. 2015;6:83–92. https://doi. org/10.2147/AMEP.S74314
10. Farajpour A, Raisolsadat SMA, Moghadam S, Mostafavian Z. Perception of educational environment among undergraduate students of health disciplines in an Iranian university. Int J Med Educ. 2017;8: 300–6. https://doi. org/10.5116/ijme.5977.7129
11. Barcelo JM. Medical laboratory science and nursing students’ perception of the academic learning environment at a Philippine university using the Dundee Ready Education Environment Measure. J Educ Eval Health Prof. 2016;13:33–9. https://doi. org/10.3352/jeehp.2016.13.33
12. Nosair E, Mirghani Z, Mostafa RM. Measuring students’ perceptions of educational environment in the PBL program of Sharjah Medical College. J Med Educ Curric Dev. 2015;2:71–9. https://doi. org/10.4137/JMECD.S29926
13. Urimubenshi G, Songa J, Kandekwe F. Assessment of the educational environment of physiotherapy students at the University of Rwanda using the Dundee Ready Educational Environment Measure (DREEM). AJHPE. 2017;9(3):103–6. https://doi.org/10.7196/AJHPE.2017.v9i3.828
23. Veasuvalingam B, Arzuman H. Physiotherapy students’ perception of their educational environment: a study to identify the areas of concern for remedial measures at two schools of physiotherapy in Malaysia. Educ in Med J. 2014;6(4):30–9. https://doi. org/10.5959/eimj.v6i3.233
21. Lokuhetty MD, Warnakulasuriya SP, Perera RI, De Silva HT, Wijesinghe HD. Students’ perception of the educational environment in a Medical Faculty with an innovative curriculum in Sri Lanka. South-East Asian Journal of Medical Education. 2010;4(1):9– 16.