*Corresponding Author: Ezatollah Farshadfar, Campus of Agriculture and Natural Resources, Razi University, Kermanshah, Iran ([email protected])
A R T I C L E I N F O A B S T R A C T
Article history: Received: 15 Oct 2017 Revised: 25 Nov 2017 Accepted: 31 Nov 2017 ePublished: 15 Dec 2017
Key words: Chickpea Genotype × environment interaction Path analysis
Introduction
Chickpea (Cicer arietinum L.) is one of the most important crop, belongs to pulse group, in the world (FAO, 2004). The potential yield of chickpea seems to be much higher than 0.78 ton/ha that is average annual yield world-wide for this crop (Singh and Reddt, 1994; Sudupak et al, 2002). Having narrow genetic base and sexual incompatibility with other wild species are major reasons for the low performance of cultivated chickpea, so in order to improve this plant in all over the world,
germplasm diversity is needed (Robertson et al, 1997). Improving the genetic potential with regard to increase yield is the main goal of many chickpea breeding programs (Robertson et al, 1997; Collard et al, 2003). Drought is one of the most serious problems versus yield of crops all over the world and different changing climates. Nowadays, scientists are trying to understand and assess of mechanisms that plants use to overcome drought stress by application of several approaches (Reyazul et al, 1997; Farshadfar et al, 2013). Interaction between genotype (G) and environment (E) often reduce
International Journal of Advanced Biological and Biomedical Research 5(4) (2017) 168– 173
Journal homepage: www.ijabbr.com
Original Article
Evaluation of Genotype × Environment Interaction in Chickpea Genotypes Using Path
Analysis
Ezatollah Farshadfar*1, Elham Mahtabi2, Mohammad Mahdi Jowkar2
1Campus of Agriculture and Natural Resources, Razi University, Kermanshah, Iran
2Department of Agronomy and Plant Breeding, Kermanshah Branch, Islamic Azad University, Kermanshah, Iran
169 Farshadfar et al./ Int. J. Adv. Biol. Biomed. Res., 2017; 5 (4), 168-173
association between genotype and phenotype because of environment interfering. These interactions make some kind of complexity in plant breeding programs so selecting one superior genotype for some climates is a hard issue. To meet this challenge, it is essential to examine genotypes in several environments to determine their genetic potential (Yaghoutipor and Farshadfar, 2007). Both parametric and non-parametric statistical methods are used to study of interaction between G and E (Mohammadi et al, 2010). Path analysis is one of the most popular multivariate techniques in statistics science. Path analysis is a form of factor analysis that is similar to principal component method )Darvishzadeh et
al, 2011; Zobel et al, 1988). This model is one of the most
effective approaches to analysis of genotype and phenotype correlations lead to understand direct and indirect traits effects on yield as a complex trait. Such a complex characteristic in crop plants is a result of several physiological factors during growth (Grafius and Thomas, 1971). This complexity nature of yield trait is a main reason that we study its components instead of yield (Farshadfar et al, 2012). For example, number of heads per plant, kernel per head and kernel weight are components for grain yield so understanding sequential relationship between them and yield is essential to investigate a model to yield trait (Tai, 1975).The objectives of the present investigation were (1) assessment of phenotypic stability of different chickpea genotypes under stress and non-stress conditions and (2) determination of the contribution of yield components in the phenotypic stability of seed yield.
Materials and Methods
Plants Genetic Materials and Experimental Design
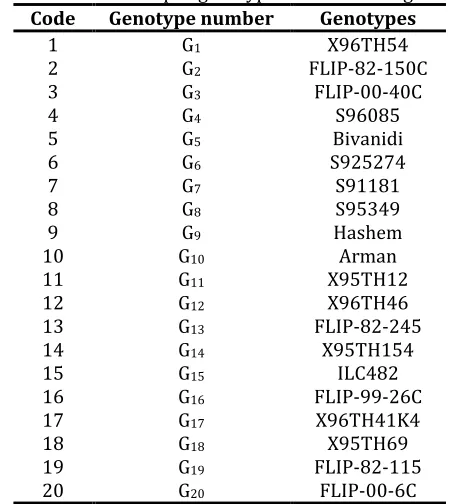
Twenty genotypes of chickpea (Cicer arietinum L.) listed in Table 1 were tested in a randomized complete block design with three replications under stress and non-stress conditions during 2008-2011 growing seasons. The experiment was carried out in the Experimental Field of College of Agriculture, Razi university, Kermanshah, Iran (47° 20 N latitude, 34 ° 20 E longitude and 1351.6 m altitude). The location of the experiment is classified as semi-arid climate and the soil of field was clay loam with pH 7.1. The genotypes were planted in 1.5 m rows and at 25×30 cm inter-plant and inter-row, respectively. No fertilizer was used but delta metrin
pesticide was used once to control of Liriomyza
huidobrensis (Blanchard) and Cotton boll worm pests. At
harvest time, hundred seed weight (HSW), number of pod per plant (NPPL), number of seed per pod (NSPO) and grain yield (GY) were measured. All traits were recorded from 2 rows of 1 m in length after elimination of border effects.
Statistical analaysis
Analysis of variance and comparison of means with Tukey test were performed using SAS (2003) software. The path analysis was done by SPSS software. The model of path analysis is as follows:
Wij=µwi+V1iR1j+V2iR2j+V3iR3j+eij
Where the observed yield (Wij) is composed of mean
genotypic effect (µwi), genotype environment interaction
effects (V1i,V2i and V3i), environmental components (R1j,
R2j and R3j) and error deviate (eij).Vgi in this formula is the
variance of yields of genotype (Tai, 1975, 1979; Tai et al, 1994).
Table 1. List of chickpea genotypes under investigation Genotypes Genotype number Code X96TH54 G1 1 FLIP-82-150C G2 2 FLIP-00-40C G3 3 S96085 G4 4 Bivanidi G5 5 S925274 G6 6 S91181 G7 7 S95349 G8 8 Hashem G9 9 Arman G10 10 X95TH12 G11 11 X96TH46 G12 12 FLIP-82-245 G13 13 X95TH154 G14 14 ILC482 G15 15 FLIP-99-26C G16 16 X96TH41K4 G17 17 X95TH69 G18 18 FLIP-82-115 G19 19 FLIP-00-6C G20 20
Table 2. Analysis of variance for yield and yield components
Source df GY HSW NPPL NSPP
Replication 2 7689.527ns 4.906ns 13.629ns .071ns
Environment 5 460591.2** 179.272** 3746.125** 0.137**
Genotype 19 9668.1** 148.4** 96.6** 0.047**
Environment × Genotype 95 2987.2ns 12.952** 16.573** 0.012ns
Error 238 2820.961 7.032 10.68 0.015
Results and Discussion Descriptive diagrams
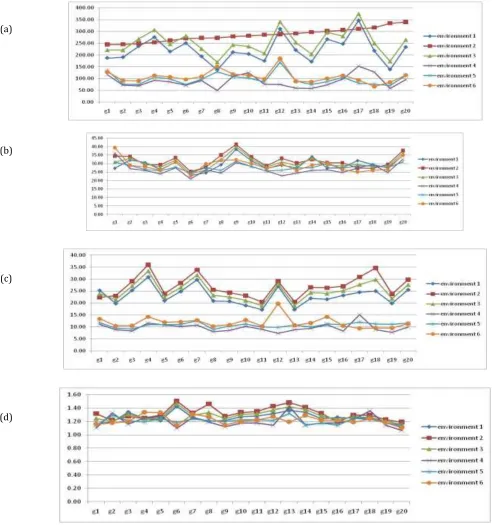
Descriptive diagrams of the measured traits (Figure 1) showed GE interaction and high variability for all traits. GY variation was high for genotypes 12 and 17, while low for 8 and 19. Very low GE interaction was found for GY in environment 2 (Figure 1a) indicating specific adaptation of GY in this environment. Interaction between genotype and environment of HSW was lower than that of GY and almost the same for all genotypes with a little higher in genotypes 1 and 9 (Figure 1b). The variation and genetic interaction for NPPL trait (Figure 1c) was higher than
HSW but lower than GY. Genotypes 11 and 13 displayed lower variation in comparison to other genotypes, hence they are more stable. Variation of environments 4 and 5 was lower than others and this variation is almost similar in three initial environments. Descriptive diagram for NSPP (Figure 1d) showed very low variation among genotypes. Only genotypes 6 and 13 showed a little higher variation among others. Farshadfar et al, (2012) showed different values of variability and GE interactions Between 14 genotypes of bread wheat (Triticum aestivum L.) in six environments for yield and yield components.
(a)
(b)
(c)
(d)
171 Farshadfar et al./ Int. J. Adv. Biol. Biomed. Res., 2017; 5 (4), 168-173
Analysis of variance and mean comparisons
Analysis of variance revealed highly significant difference (P< 0.01) for both genotype and environment (Table 3) indicating the presence of variability between genotypes and environments. GE interaction was highly significant for HSW and NPPL, exhibiting the effect of environment in GE interaction, but non-significant for GY and NSPO. As the genotype× environment was significant for two of measured traits, so more estimation of phenotypic stability is possible for these traits ( Farshadfar and Sutkla, 2006). But as F-test in the analysis of variance can only detect large differences between the genotypes, therefore non-significancy in the table of analysis of variance does not mean no significant between genotypes for the characters GY and NSPO, therefore
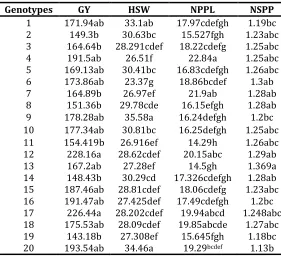
mean comparisons classified these traits into different groups ( Farshadfar et al, 2008). Mean comparisons for all measured traits is illustrated in Table 3. For the grain yield, values ranged from 143.18 g for genotype 19 to 228.18 g for genotype12. Totally 2, 7, 8 and 3 classes of genotypes were found based on mean comparison for GY, HSW, NPPL and NSPO, respectively. Observed variability among genotypes was higher for HSW and NPPL. Genotypes 1, 9 and 20 occupied first class for HSW, exhibited higher values, and others located in classes 2 to 7. Genotypes 4, 7, 12, 17 and 18 showed maximum value of NPPL locating in the first class with significant differences with other genotypes. There were three classes for NSPO, hence low variability was found in this trait for all 20 genotypes.
Table 3. Mean comparison of yield and yield component
Genotypes GY HSW NPPL NSPP
1 171.94ab 33.1ab 17.97cdefgh 1.19bc
2 149.3b 30.63bc 15.527fgh 1.23abc
3 164.64b 28.291cdef 18.22cdefg 1.25abc
4 191.5ab 26.51f 22.84a 1.25abc
5 169.13ab 30.41bc 16.83cdefgh 1.26abc
6 173.86ab 23.37g 18.86bcdef 1.3ab
7 164.89b 26.97ef 21.9ab 1.28ab
8 151.36b 29.78cde 16.15efgh 1.28ab
9 178.28ab 35.58a 16.24defgh 1.2bc
10 177.34ab 30.81bc 16.25defgh 1.25abc
11 154.419b 26.916ef 14.29h 1.26abc
12 228.16a 28.62cdef 20.15abc 1.29ab
13 167.2ab 27.28ef 14.5gh 1.369a
14 148.43b 30.29cd 17.326cdefgh 1.28ab
15 187.46ab 28.81cdef 18.06cdefg 1.23abc
16 191.47ab 27.425def 17.49cdefgh 1.2bc
17 226.44a 28.202cdef 19.94abcd 1.248abc
18 175.53ab 28.09cdef 19.85abcde 1.27abc
19 143.18b 27.308ef 15.645fgh 1.18bc
20 193.54ab 34.46a 19.29bcdef 1.13b
Covariance of yield with other characters
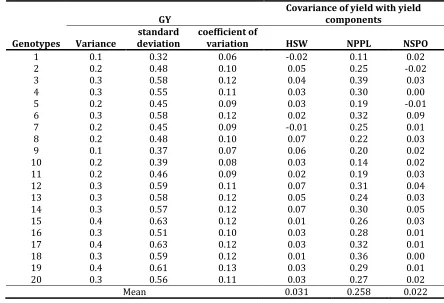
Successful application of genotypic and phenotypic variances to study of complex traits such as yield depends on the attitude of researcher (Mehdi, 1986). Genetic covariance between yield and another trait shows that selection on yield will affect response to selection on the other (Guillaume and Whitlock, 2007). The results revealed higher phenotypic covariance between NPPL and GY with the average of 0.25 followed by HSW (0.033) and NSPO (0.022). Variance, standard deviation and coefficient of variation for each genotype are indicated in Table 4. High values of genetic and/or phenotypic covariance between two traits may represent a high level of variation that can be very useful in plant breeding programs.
Path analysis over environments
Generally, the aim of path analysis is using correlation
exhibited that absolute value of r1 and r3 in all
environments was higher than r2 indicating that
sensitivity of NPPL and HSW to the environmental variation was higher than NSPL. Therefore high grain
yield and stability of chickpea genotypes were because of higher genotypic component V2 (NSPO) and lower
environmental components r2 (NSPP).
Table 4. Variance, standard deviation, coefficient of variation and covariance of yield and yield components
GY Covariance of yield with yield components
Genotypes Variance deviation standard coefficient of variation HSW NPPL NSPO
1 0.1 0.32 0.06 -0.02 0.11 0.02
2 0.2 0.48 0.10 0.05 0.25 -0.02
3 0.3 0.58 0.12 0.04 0.39 0.03
4 0.3 0.55 0.11 0.03 0.30 0.00
5 0.2 0.45 0.09 0.03 0.19 -0.01
6 0.3 0.58 0.12 0.02 0.32 0.09
7 0.2 0.45 0.09 -0.01 0.25 0.01
8 0.2 0.48 0.10 0.07 0.22 0.03
9 0.1 0.37 0.07 0.06 0.20 0.02
10 0.2 0.39 0.08 0.03 0.14 0.02
11 0.2 0.46 0.09 0.02 0.19 0.03
12 0.3 0.59 0.11 0.07 0.31 0.04
13 0.3 0.58 0.12 0.05 0.24 0.03
14 0.3 0.57 0.12 0.07 0.30 0.05
15 0.4 0.63 0.12 0.01 0.26 0.03
16 0.3 0.51 0.10 0.03 0.28 0.01
17 0.4 0.63 0.12 0.03 0.32 0.01
18 0.3 0.59 0.12 0.01 0.36 0.00
19 0.4 0.61 0.13 0.03 0.29 0.01
20 0.3 0.56 0.11 0.03 0.27 0.02
Mean 0.031 0.258 0.022
Figure 2. Path analysis of yield and yield components over environments
Conclusion
It is common that plant breeders use grain yield to study genotype × environment interaction. As yield is a complex trait with low heritability, therefore it is essential to detect which of the yield components contribute more to the yield stability over environments. The reason is that yield components are simple
173 Farshadfar et al./ Int. J. Adv. Biol. Biomed. Res., 2017; 5 (4), 168-173
more effective role in the phenotypic stability of grain yield in chickpea.
References
Collard, B.C.Y., Pang, E.C.K., Ades, P.K., Taylor, P.W.J., 2003. Preliminary investigation of QTLs for seedling resistance to ascochyta blight from Cicer echinospermum, a wild relative of chickpea. Theoretical Applied Genetic, 107:719 –729.
Darvishzadeh, R., HatamiMaleki, H., Sarrafi, A., 2011. Path analysis of the relationships between yield and some related traits in diallel population of sunflower (Helianthus annuus L.) under well-watered and water-stressed conditions. Australian
Journal of Crop Science, 5 (6): 674-680.
Falak, N., Ashraf, M., Ghafoor, A., 2003. Path analysis and relationship among quantitative traits in chickpea (Cicer
arietinum L.). Pakistan Journal of Biological Science, 6 (6):
551-555.
FAO. 2004. Food and Agriculture Organization of the United Nations, Rome, Italy.
Farshadfar, E., Rasoli, V., Mohammadi, R., Veisi, Z., 2012. Path analysis of phenotypic stability and drought tolerance in bread wheat ( Ttiticum aestivum L.). International Journal of Plant
Breeding, 6(2): 106-112.
Farshadfar, E., Sutka, j., 2006. Biplot analysis of genotype-environment interaction in durum wheat using AMMI model.
Acta Agronomica Hungarica, 54(4): 459-467.
Farshadfar, E., Haghparast, R., Qaitoli, M., 2008. Chromosomal localization of the genes controlling agronomic and physiological indicators of drought tolerance in barley using disomic addition lines. Asian Journal of Plant Science, 7(6): 536-543.
Farshadfar, E., Mohammadi, R., Mohsen Farshadfar, M., Dabiri, S.H., 2013. Relationships and repeatability of drought tolerance indices in wheat-rye disomic addition lines. Australian Journal of Crop Science, 7(1):130-138.
Grafius, J. E., Thomas, R.L., 1971. The case for indirect genetic control of sequential traits and the strategy of deployment of environmental resources of the plant. Heredity, 26: 433-442.
Guillaume, F., Whitlock, M.C., 2007. Effects of migration on the genetic covariance matrix. Journal of Evolutionary Biology, 61:2398–2409.
Mehdi, S.S., 1986. Predicted response to S1 selection for yield and disease resistance traits in two sunfower populations. Ph.D. Thesis, South Dakota State Univ., Brookings, SD, U.S.A.
Mohammadi, R., MozaffarRoostaei, M., Yousef, A., Mostafa, A., Amri, A., 2010. Relationships of phenotypic stability measures for genotypes of three cereal crops. Canadian Journal of Plant
Science, 90: 819-830.
Reyazul, R.M., Zaman-Allah, M., Sreenivasulu, N., Trethowan, R., Varshney, R.K., 2012. Integrated genomics, physiology and breeding approaches for improving drought tolerance in crops.Theoretical Applied Genetic. DOI 10.1007/s00122-012-1904-9.
Robertson, L.D., Ocampo, B., Singh, K.B., 1997. Morphological variation in wild annual Cicer species in comparison to the cultigen. Euphytica, 95: 309-319.
Singh, K.B., Reddy, M.V., 1994. Registration of eight ascochyta blight-resistant, early-maturing, large-seeded chickpea germplasms. Crop Science, 34:1416–1417.
Sudupak, M. A., Akkaya, M.S., Kence, A., 2002. Analysis of genetic relationships among perennial and annual Cicer species growing in Turkey using RAPD markers. Theoretical Applied Genetic, 105:1220–1228.
Tai, G.C.C., 1975. Analysis of genotype-environment interactions based on the method of path coefficient analysis. Canadian
Journal of Genetic and Cytology, 17: 141 – 149.
Tai, G.C.C., 1979. Analysis of genotype environment interaction of potato yield. Crop Science, 19: 434 – 438.
Tai, G.C.C., Levy, D., Coleman, W.K., 1994. Path analysis of genotype-environment interaction of potatoes exposed to increasing warm climate. Euphytica, 75:49-61.
Yaghotipoor, A., Farshadfar, E., 2007. Non-parametric estimation and component analysis of phenotypic stability in chickpea (Cicer
aritinum L.). Pakistan j biological Sci, 10: 2646-2648.
Zobel, R.W., Wright, M.J., Gauch, H.G., 1988. Statistical analysis of a
yield trial. Agronomy Journal, 80:388-393.
How to cite this manuscript: Ezatollah Farshadfar, Elham Mahtabi, Mohammad Mahdi Jowkar. Evaluation of Genotype ×