http: // www.ijrsm.com © International Journal of Research Science & Management
1
APPLICATION OF A LINEAR REGRESSION ANALYSIS TO AIRTEST PM2500
1Ha-Young Woo,
2Yong-Cheol Kim,
*3Gyu-Sik Kim
1
Undergraduate student
2,3Professor, Dept. of Electrical and Computer Eng., University of Seoul,
Korea
DOI: 10.5281/zenodo.272921
Keywords
:
indoor air quality, PM10 concentration, subway system, light scattering, linear regression analysisAbstract
Since an individual usually spends most of his/her working hours indoors, the ambient air quality refers to indoor air quality. In particular, PM10 concentration in the underground areas should be monitored to preserve
the health of commuters in the subway system. Seoul Metro and Seoul Metropolitan Rapid Transit Corporation measure several air pollutants regularly. In this paper, the accuracy of an instrument for PM measurement using the light scattering method was improved with the help of a linear regression analysis technique to continuously measure the PM10 concentrations in subway stations.
Introduction
People spend most of their time indoors—either at home, in the workplace or in transit. Thus, there has been an increasing concern over indoor air quality (IAQ) and its effects on public health. The US Environment Protection Agency (EPA) reported that in the US, the mean daily residential time spent indoors was 21 h, while the GerES II reported that this duration was 20 h in Germany. Thus, the IAQ has been recognized as a significant factor in the determination of the health and welfare of people [1]. The Korea Ministry of Environment (KMOE) enforced the IAQ act to control five major pollutants, including PM10, CO2, CO, VOCs,
and formaldehyde in indoor environments. Out of these, the IAQ standard for PM10 concentration is 150 μg/m3.
The IAQ is critical not only in buildings, but also in underground areas and public transportation systems. Much effort has been made for the improvement of the IAQ in subway stations [2-5]. Among the various types of indoor environments, underground subway stations have especially unique features. The confined space occupied by the underground subway system can accumulate the pollutants entering from the outside in addition to those generated within the system. Therefore, it is likely that the subway system in the Seoul metropolitan area contains different types of hazardous pollutants due to the old ventilation and accessory systems [3, 6]. The IAQ in the subway stations can be affected by many factors, such as the number of passengers, the outside conditions and the natural ventilation rate, etc. The management and monitoring of IAQ in subway stations has become an important issue of public interest. Some environmental sensors are important for monitoring IAQ in subway systems and they provide the data needed for continuous online implementation. In this paper, the accuracy of the instrument for PM measurement using light scattering method was improved with the help of a linear regression analysis technique to continuously measure the PM10 concentrations in the subway stations.
PM measuring instruments
Particulate matter with an aerodynamic diameter less than 10 μm (PM10) is one of the major pollutants in
subway environments. The PM10 concentration in the underground areas should be monitored to protect the
health of the commuters in the underground subway system. Seoul Metro and Seoul Metropolitan Rapid Transit Corporation measure several air pollutants regularly. As for the PM10 concentration, generally, measuring
instruments based on β-ray absorption method are used. In order to keep the PM10 concentration below a healthy
limit, the air quality in the underground platform and tunnels should be monitored and controlled continuously. The PM10 instruments using light scattering method can measure the PM10 concentration every once in several
seconds. However, the accuracy of the instruments using light scattering method has still not been proven since they measure the particle number concentration rather than the mass concentration [7]. The purpose of this work is to study the accuracy improvement of the instruments which use light scattering method to continuously measure the PM10 concentrations in the underground subway stations. Two different instruments using light
http: // www.ijrsm.com © International Journal of Research Science & Management
2
• Particle Channels: 1.0-5.0 μm, 5.0+ μm; • Flow Rate: 0.06 cfm nominal;
• Concentration Limit: Coincidence loss less than 10% at 1,000,000 particles/cubic foot; • Display Format: Particles/cubic foot (divided by 100) averaged over 1 minute;
• Data Storage: 60 minutes of minute averages, 24 hours of hourly averages, 30 day of daily averages; • Dimensions:7.5 x 5.0 x 3.5 inches;
• Weight: Approximately 12 oz;
• Power: 9VDC, 400mA, 110VAC plug-in transformer provided;
Figure 1. The PM measuring instrument Airtest PM2500 installed at a subway station
Performance improvement using a linear regression analysis
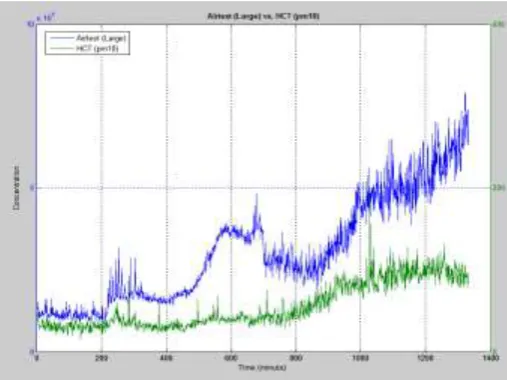
A linear regression analysis method was used to improve the accuracy of Airtest PM2500 using the light scattering method. The data measured by this PM measuring instrument had to be converted to actual PM10
concentrations using some factors. Two different instruments using light scattering method, i.e. Airtest PM2500 (Heyoka solutions, USA) and HCT-PM326 (HCT, Korea) were installed on the platform at a subway station of Seoul metro line number 1 and measurements were taken for 1350 minutes as shown in Fig. 2.
http: // www.ijrsm.com © International Journal of Research Science & Management
3
Figure 3. Linear regression analysis
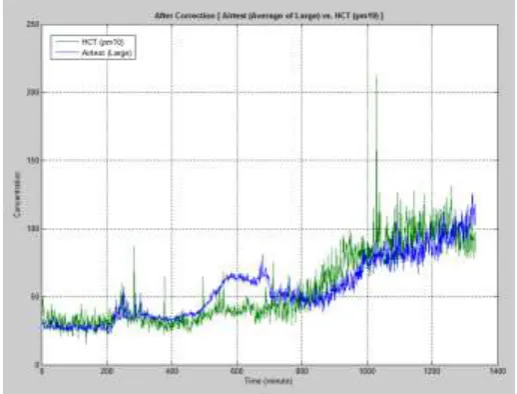
Figure 4. PM10 concentrations corrected using a linear regression analysis
Using the linear regression analysis technique shown in Fig. 3, the measured PM10 concentration of Airtest
PM2500 in Fig. 2 can be corrected as shown in Fig. 4. In Fig. 3, the correlation coefficient R2 was 0.7132. It can
be seen in Fig. 4 that the measured PM10 concentration of Airtest PM2500 is very similar to that of HCT-PM326
if they are corrected using a linear regression analysis technique. This finding suggests that the cheaper PM measuring instrument Airtest PM2500 using light scattering method can be used to measure and control the PM10 concentrations of the underground subway stations.
Monitoring of PM
10in a subway station
The PM measuring instrument Airtest PM2500 was installed in the waiting room, platform, tunnel, and at the outdoor site of a subway station of Seoul Metro line number 1 and PM10 was measured for 10,000 min at a
sampling interval of 1 min as shown in Fig. 5 – Fig. 8. As for the waiting room (Fig. 5), the PM10 concentration
was kept under 80 μg/m3 , which met the KMOE's IAQ standard for PM
10 concentration (150 μg/m3). As for the
platform (Fig. 6), the PM10 concentration was kept under 70 μg/m3 , which was lower than that in the waiting
http: // www.ijrsm.com © International Journal of Research Science & Management
4
(x-axis : minute, y-axis : μg/m3)
Figure 5. PM10 concentrations measured in the waiting room of a subway station
(x-axis : minute, y-axis : μg/m3)
Figure 6. PM10 concentrations measured in the platform of a subway station
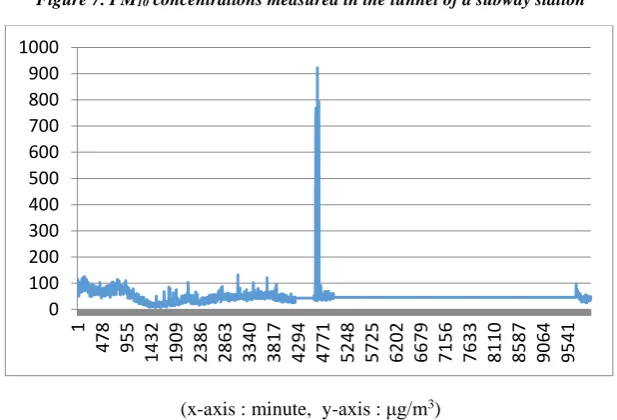
Most of the ventilation fans may not have been in working condition because of their deterioration and high running cost. Therefore, the PM10 concentration in tunnels might have been high for a long period of time.
Finally, the data for the outdoor site at a subway station are shown in Fig. 8. The PM10 concentration was
approximately 10–100 μg/m3 except for a case in which it was higher than 900 μg/m3. The air quality of the
outdoor site at a subway station was relatively good. The cause of the generation of a pulse data is that the PM10
concentration was measured using light scattering method. One of the demerits of light scattering method is that, sometimes, it gives very large values. PM10 sensors are important components for monitoring the IAQ in
subway systems, as they provide the data needed for continuous online implementation. Sometimes, these sensors suffer from poor data quality and sensor reliability due to the hostile environment in the subway stations in which the measuring instruments are installed for monitoring. They may even fail for a long period of time as Fig. 8. These failures could reduce the accuracy and reliability of the measurement, which may result in an erroneous control action and false perception regarding the performance of the monitoring system. Faulty sensors that have either completely or partially failed could provide incorrect information regarding monitoring and control. Therefore, many researchers have tried to prevent these problems [8–10].
http: // www.ijrsm.com © International Journal of Research Science & Management
5
(x-axis : minute, y-axis : μg/m3)
Figure 7. PM10 concentrations measured in the tunnel of a subway station
(x-axis : minute, y-axis : μg/m3)
Figure 8. PM10 concentrations measured in the outdoor site of a subway station
Conclusion
An air quality monitoring system based on environmental sensors was implemented to display and record the data of PM10 of a waiting room, a platform, a tunnel and an outdoor site at an underground subway station. The
accuracy of the PM measuring instruments using light scattering methods was improved with the help of a linear regression analysis technique to continuously measure the PM10 concentrations in the subway stations. Even
though the accuracy was greatly improved, this approach had its demerits, such as the generation of very large measured data and the need to repeat the linear regression analysis every time the PM measuring instruments were moved to other places.
Acknowledgements
This work was supported by the Korea Ministry of Environment (MOE) as ‘‘the Environmental Health Action Program.’’ This work was also supported by the National Research Foundation of Korea (NRF) grant funded by the Korea government (MSIP) (No. 2016011249).
http: // www.ijrsm.com © International Journal of Research Science & Management
6
[2] Jihan Song, Heekwan Lee, Shin-Do Kim, and Dong-Sool Kim, How about the IAQ in subway environment and its management, Asian Journal of Atmospheric Environment, vol.2, no.1, pp.60-67, June, 2008
[3] Youn-Suk Son, Young-Hoon Kang, Sang-Gwi Chung, Hyun Ju Park, and Jo-Chun Kim, Efficiency evaluation of adsorbents for the removal of VOC and NO2 in an underground subway station, Asian Journal of Atmospheric Environment, vol.5, no.2, pp.113-120, June, 2011
[4] Kyung Jin Ryu, MakhsudaJuraeva, Sang-Hyun Jeong, and Dong Joo Song, Ventilation efficiency in the subway environment for the indoor air quality, World Academy of Science, Engineering and Technology, vol.63, pp.34-38, March, 2012
[5] Youn-Suk Son, Trieu-Vuong Dinh, Sang-Gwi Chung, Jai-hyo Lee, and Jo-Chun Kim, Removal of particulate matter emitted from a subway tunnel using magnetic filters, Environmental Science & Technology, vol.48, pp.2870-2876, Feb., 2014
[6] Ki Youn Kim,, Yoon Shin Kim, Young Man Roh, Cheol Min Lee, Chi Nyon Kim, Spatial distribution of particulate matter (PM10 and PM2.5) in seoul metropolitan subway stations, Journal of Hazardous Material, vol.154, pp.440-443, June, 2008
[7] Hans Grimm, Delbert J. Eatough, Aerosol Measurement: The Use of Optical Light Scattering for the Determination of Particulate Size Distribution, and Particulate Mass, Including the Semi-Volatile Fraction, Journal of the Air & Waste Management Association, vol.59, pp.101-107, Jan., 2009
[8] Ricardo Dunia, S. Joe Qin, Joint diagnosis of process and sensor faults using principal component analysis, Control Engineering Practice, vol.6, no.4, pp.457-469, April, 1998
[9] Shengwei Wang, Youming Chen, Sensor validation and reconstruction for building central chilling systems based on principal component analysis, Energy Conversion and Management, vol.45, no.5, pp.673-695, March, 2004