Economic Burden of Obesity in Youths Aged 6 to 17 Years: 1979 –1999
Guijing Wang, PhD, and William H. Dietz, MD, PhD
ABSTRACT. Objective. To examine the trend of obe-sity-associated diseases in youths and related economic costs.
Methods. Using a multiyear data file of the National Hospital Discharge Survey, 1979 –1999, we analyzed the changes in obesity-associated diseases and economic costs in youths (6 –17 years of age) over time. Diabetes, obesity, sleep apnea, and gallbladder disease were exam-ined to explore the trend of the disease burden. Other obesity-associated diseases for which obesity was listed as a secondary diagnosis were also analyzed. Obesity-associated hospital costs were estimated from the dis-charges with obesity listed as a principal or secondary diagnosis.
Results. From 1979 –1981 to 1997–1999, the percentage of discharges with obesity-associated diseases increased. The discharges of diabetes nearly doubled (from 1.43% to 2.36%), obesity and gallbladder diseases tripled (0.36% to 1.07% and 0.18% to 0.59%, respectively), and sleep apnea increased fivefold (0.14% to 0.75%). Ninety-six percent of discharges with a diagnosis of obesity listed obesity as a secondary diagnosis. Asthma and some mental disorders were the most common principal diagnoses when obesity was listed as a secondary diagnosis. Obesity-associated annual hospital costs (based on 2001 constant US dollar value) increased more than threefold; from $35 million (0.43% of total hospital costs) during 1979 –1981 to $127 million (1.70% of total hospital costs) during 1997–1999.
Conclusions. Among all hospital discharges, the pro-portion of discharges with obesity-associated diseases has increased dramatically in the past 20 years. This increase has led to a significant growth in economic costs. These findings may reflect the impact of increasing prev-alence and severity of obesity. Diet and physical activity interventions should be developed for weight loss and prevention of weight gain in youths. Pediatrics 2002; 109(5). URL: http://www.pediatrics.org/cgi/content/full/ 109/5/e81; children, adolescents, obesity, hospitalization, comorbidities, costs.
ABBREVIATIONS. NHDS, National Hospital Discharge Survey, ICD-9, International Classification of Diseases, Ninth Revision.
T
he prevalence of overweight and obesity among children has been increasing rapidly worldwide.1In the United States, the age-ad-justed prevalence of obesity based on the 95th per-centile of body mass index nearly doubled from1976 –1980 to 1988 –1994 for children in the 6 to 11 years and the 12 to 17 years age groups.2,3,4 This trend has continued since 1994. Recent data have shown that prevalence of overweight among chil-dren (6 –11 years old) and adolescents (12–19 years old) was 13% and 14%, respectively, in 1999.5
Obesity in children and adolescents has been as-sociated with several important chronic diseases such as diabetes, asthma, sleep apnea, and gallblad-der disease.6,7Several studies have documented that prevalence of type 2 diabetes mellitus is increasing among children and adolescents, and obesity may be a major contributor to the increase.8 –11 However, neither trends in the prevalence of diseases associ-ated with obesity in youths nor their impact on health care costs have previously been examined. This study explores the trends of disease and eco-nomic burden of obesity in youths from 1979 to 1999 with use of a nationally representative population sample of hospital discharges, the National Hospital Discharge Survey (NHDS).
The term overweight is used to describe children and adolescents whose body mass index is ⱖ95th percentile for youths of the same age and gender. The NHDS, however, lists obesity as a principal or a secondary diagnosis. Therefore, we will use the term obesity in this manuscript, although the use of the term reflects the provider’s judgment and likely un-derestimates the true prevalence of overweight-asso-ciated conditions and costs.
METHODS Data Source
We used a multiyear data file of the NHDS, 1979 –1999, con-ducted by the National Center for Health Statistics. This survey collects data from inpatient records acquired from a national sample of hospitals. The NHDS records annual discharges from noninstitutional hospitals, exclusive of federal, military, Veterans’ Administration hospitals, and hospital units of institutions, such as prison hospitals, located in the 50 States and the District of Columbia. Only short-stay hospitals (those with an average length of stay for all patients of⬍30 days), general (medical or surgical) hospitals, and children’s hospitals are included in the survey. Because persons with multiple discharges during the year may be sampled more than once, and no personal identifiers were avail-able, discharges rather than persons were used for this study.
The survey design, sampling, and estimation procedures were planned to produce calendar-year estimates of inpatient stays. A detailed description of the sample design of the survey is pro-vided elsewhere.12In the survey, the medical information manu-ally recorded on the sampled patients’ abstract was coded by National Center for Health Statistics staff who used the Interna-tional Classification of Diseases, Ninth Revision, Clinical Modification (ICD-9-CM). A maximum of 7 diagnostic codes was assigned for each abstract sampled. The diagnostic code listed first was used as the principal diagnosis, and subsequent diagnostic codes (second through seventh) were used as secondary diagnoses.
From the Division of Nutrition and Physical Activity, National Center for Chronic Disease Prevention and Health Promotion, Centers for Disease Control and Prevention, Atlanta, Georgia.
Received for publication Oct 16, 2001; accepted Feb 12, 2002.
Reprint requests to (G.W.) 4770 Buford Hwy, MS K-46, Atlanta, GA 30341. E-mail: gbw9@cdc.gov
The survey also provided demographic information, such as age, sex, and race. Data for race were missing for a total of about 13% of all discharges from all years, and no attempt was made to impute those missing values. In addition, because most obesity-related diseases occurred with a relatively low prevalence, we did not include race or other demographic variables in our analyses.
Analyses
We analyzed the hospital discharges from 1979 to 1999 of children and adolescents 6 to 17 years of age. We selected diabetes (ICD-9250), obesity (ICD-9278), sleep apnea (ICD-9780.5, 786.09, and 789.03–789.07 for the year 1999 because of code changes), and gallbladder disease (ICD-9574 and 575) for the analyses of trends. Because type 1 and type 2 diabetes cannot be reliably differenti-ated in our analyses, we considered only the hospitalizations in which diabetes and obesity were both listed as diagnoses as the criteria for type 2 diabetes when we analyzed hospital costs. Sleep apnea included sleep disturbances and other symptoms involving the respiratory system, and other chest symptoms such as apnea, shortness of breath, and wheezing. Gallbladder disease included cholelithiasis and cholecystitis. To examine the trend of the fre-quency of these diseases over the study period, we used the total number of diagnoses, including principal and secondary diag-noses during a year, and then pooled discharges from 3 consecu-tive years for additional analyses.
To quantify the health burden of these obesity-associated dis-eases over time, we estimated the number of discharges in the earliest 3-year (1979 –1981) and the most recent 3-year (1997–1999) periods by principal and secondary diagnoses, separately. To understand better the obesity-associated health burden, we exam-ined the other frequent principal diagnoses for discharges where obesity was listed as a secondary diagnosis.
On the basis of the health burden, we derived annual hospital cost by multiplying the total number of hospital stays (days of care) by the average hospital cost per day. We used an average cost per day of $249 for the community hospitals as the estimate of patient direct costs for hospital treatment during the period of 1979 –1981.13 The average cost per day during 1997–1999 was $1066.14For comparison purposes, we derived the hospital costs using year 2001 constant US dollars. We used a 5% inflation rate for this purpose. In 2001 constant dollars, the average cost per day was $694 for 1979 –1981 and $1234 for 1997–1999. Because of the potential for double counting and uncertainty about the linkage between obesity and obesity-associated diseases, we included only the discharges with a diagnosis of obesity for the estimate of economic burden.
Because the NHDS used a stratified, multistage probability design, for data analysis we used SUDAAN (Research Triangle Park, NC), a statistical software package to take the complex sample design effects into account.15
RESULTS
The percentage of hospital discharges of youths increased for all obesity-associated diseases over the period of 1979 –1999 (Fig 1). The percentage of
dia-betes diagnoses increased from below 1.5% in 1979 to nearly 2.5% in 1999. The percentage of obesity dis-charges increased from below 0.5% to nearly 1.2%, and the increase was consistent and rapid after 1995. The frequency of sleep apnea and gallbladder dis-ease also incrdis-eased over the years.
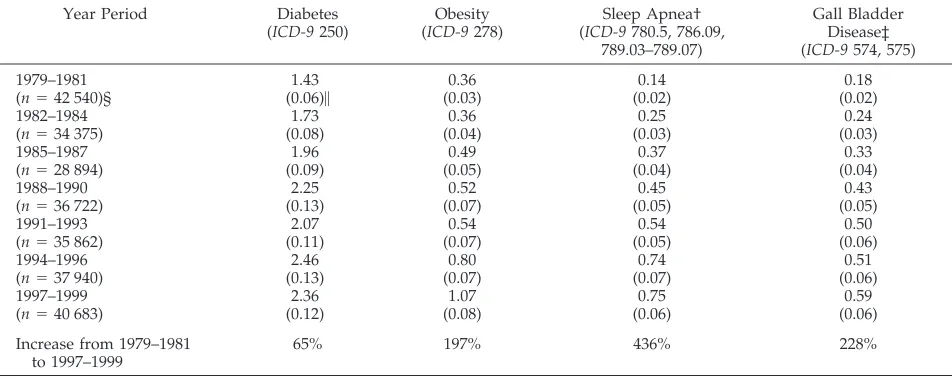
The pattern of increase was more apparent and consistent when we pooled the discharges over 3 consecutive years (Table 1). From the 1979 –1981 to the 1997–1999 period, the prevalence of diabetes in-creased from 1.43% to 2.36%, obesity from 0.36% to 1.07%, sleep apnea from 0.14% to 0.75%, and gall-bladder disease from 0.18% to 0.59%. The trends were similar in children 6 to 11 years old and ado-lescents 12 to 17 years old, although the prevalence was higher in adolescents than in children for all diseases except sleep apnea (Fig 2A-D).
Table 2 presents the number of national hospital discharges extrapolated from the NHDS by sample weight for the 4 diseases during the earliest 3-year (1979 –1981) and the most recent 3-year (1997–1999) study period. Most discharges with a diagnosis of diabetes listed it as a principal diagnosis (83% during 1979 –1981 and 75% during 1997–1999). Over 70% of discharges with a gallbladder disease diagnosis listed it as a principal diagnosis. Only 4% of dis-charges with an obesity diagnosis listed it as a prin-cipal diagnosis during 1997–1999, and in that same period only 4% of discharges with a sleep apnea diagnosis listed it as a principal diagnosis. From 1979 –1981 to 1997–1999, the total number of dis-charges increased by 55% for obesity, 175% for sleep apnea, and 74% for gallbladder disease.
During 1997–1999, the most frequent principal agnoses when obesity was listed as a secondary di-agnosis were asthma, disturbance of conduct such as unsocialized conduct and depressive disorders, and diabetes (Table 3). The frequency of disturbance of conduct in the earliest period (1979 –1981) was very low. The rate of asthma as an obesity-associated comorbidity increased from 5.9% in 1979 –1981 to 8.1% in 1997–1999. Outcome of delivery was a com-mon principal diagnosis in 1997–1999 (4.6% vs 1.3% in 1979 –1981). This diagnosis applied to girls 15 to 17 years of age with a single liveborn.
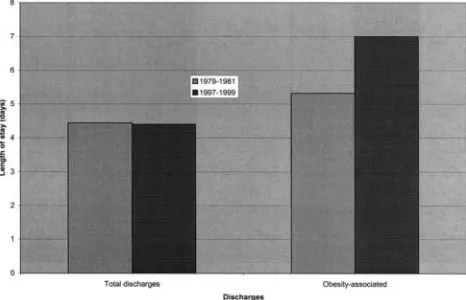
For both principal and secondary diagnosis of obe-sity, the length of stays were longer in 1997–1999 (13.46 days and 6.76 days, respectively) than in 1979 – 1981 (6.35 days and 5.01 days, respectively; Table 4). The total days of care associated with obesity in-creased from about 152 000 days in 1979 –1981 to about 310 000 days in 1997–1999. In 1997–1999, the length of stay was 7.0 days for discharges with an obesity diagnosis and 4.4 days for overall discharges (Fig 3). The length of stay for obesity-associated dis-charges increased from 5.32 days in 1979 –1981 to 7 days in 1997–1999, and it slightly decreased for the overall discharges.
Based on hospital utilization and average hospital cost per day, the annual hospital cost of $12.6 million during 1979 –1981 increased to $110 million during 1997–1999 (Table 4). A major proportion of the cost was for discharges that listed obesity as a secondary diagnosis. After adjusting for inflation, in 2001 con-Fig 1. Discharge frequency of obesity-associated diseases in
stant dollars, annual hospital costs were about $35 million (0.43% of total hospital costs) during 1979 – 1981 and increased more than threefold to about $127 million (1.70% of total hospital costs) during 1997– 1999.
DISCUSSION
The increase in the percentage of discharges with obesity-associated diseases may reflect the medical consequences of the obesity epidemic. Although the numbers of percentage are small, the increases are substantial, especially for obesity (197% increase), sleep apnea (436%), and gallbladder disease (228%). These data may suggest that the increasing preva-lence of obesity in children and adolescents has led to increased hospital stays related to obesity-associ-ated diseases. The increasing proportion of hospital discharges with obesity-associated diseases in the last 20 years may also reflect the impact of increasing severity of obesity.2The higher proportion of hospi-tal discharges of obesity-associated diseases in ado-lescents than in children for all of the diseases except sleep apnea may suggest further that obesity compli-cations increase with age.
In the NHDS data reviewed for this study, obesity was usually listed as a secondary diagnosis. One potential explanation for this finding is that obesity is not generally a reimbursable diagnosis or medical health benefit. Health care payers may not reimburse for hospitalizations for obesity, even when obesity is the disease that causes diabetes, sleep apnea, or gall-bladder disease. Therefore, doctors may not list obe-sity as a principal or even a secondary diagnosis. Lack of reimbursement may delay the treatment of obesity and lead to lost opportunities to prevent obesity-associated diseases. Reluctance to list obesity as a diagnosis may also make our estimates of dis-ease burdens conservative.
The frequency with which other diseases have obesity listed as a secondary diagnosis suggests that obesity may lead to many other medical conditions. Asthma and some mental disorders have been linked to obesity.6,7,16 –18The frequencies with which obesity was listed as a secondary diagnosis for asthma and for several mental disorders increased from 1979 – 1981 to 1997–1999. Especially for mental disorders, no discharges listed obesity as a co-morbidity during 1979 –1981, but by 1997–1999, obesity had become a common co-morbidity. For asthma, the frequency of discharges associated with obesity increased nearly 40%. Outcome of delivery was another common dis-charge that listed obesity as a co-morbidity during 1997–1999. The diagnosis frequency increased from 1.3% in 1979 –1981 to 4.6% in 1997–1999. All of the patients in this category were girls 15 to 17 years of age with single liveborn. This increase may reflect the contribution of obesity to pregnancy complica-tions and adverse pregnancy outcomes, such as ce-sarean delivery and pregnancy-induced hyperten-sion.19
The length of stay for discharges associated with obesity was longer than that for overall discharges. Discharges with a principal or secondary diagnosis of obesity yielded more days of hospital stay in recent years (1997–1999) than in earlier years (1979 – 1981), whereas the days of hospital stay decreased slightly for the overall discharges. When obesity was listed as a principal diagnosis, the average length of stay was twice that of discharges listing obesity as a secondary diagnosis (13.5 days vs 6.8 days). These data may reflect the time needed to treat obesity or to implement dietary or exercise strategies, or the time necessary to implement changes within families. The increased length of stay may also suggest that obe-sity treatment has become more complicated in re-cent years. For example, because of the increasing TABLE 1. Hospital Discharge Frequency (Weighted %) of Diseases Among Youths Aged 6 to 17 Years, 1979 –1999 NHDS
Year Period Diabetes
(ICD-9250)
Obesity (ICD-9278)
Sleep Apnea† (ICD-9780.5, 786.09,
789.03–789.07)
Gall Bladder Disease‡ (ICD-9574, 575)
1979–1981 1.43 0.36 0.14 0.18
(n⫽42 540)§ (0.06)㛳 (0.03) (0.02) (0.02)
1982–1984 1.73 0.36 0.25 0.24
(n⫽34 375) (0.08) (0.04) (0.03) (0.03)
1985–1987 1.96 0.49 0.37 0.33
(n⫽28 894) (0.09) (0.05) (0.04) (0.04)
1988–1990 2.25 0.52 0.45 0.43
(n⫽36 722) (0.13) (0.07) (0.05) (0.05)
1991–1993 2.07 0.54 0.54 0.50
(n⫽35 862) (0.11) (0.07) (0.05) (0.06)
1994–1996 2.46 0.80 0.74 0.51
(n⫽37 940) (0.13) (0.07) (0.07) (0.06)
1997–1999 2.36 1.07 0.75 0.59
(n⫽40 683) (0.12) (0.08) (0.06) (0.06)
Increase from 1979–1981 to 1997–1999
65% 197% 436% 228%
* Percentages are weighted to be nationally representative.
† Sleep apnea includes sleep disturbance (ICD-9780.5, excludes that of nonorganic origin) and other symptoms (ICD-9786.09, 786.03– 786.07 for year 1999 because of code changes) involving respiratory system and other chest symptoms (apnea, shortness of breath, cheyne-stokes respiration, tachypnea, wheezing, respiratory distress, or insufficiency).
‡ Gall bladder disease includes cholelithiasis (ICD-9574) and cholecystitis (ICD-9575). §n⫽total number of discharges in the sample.
severity of obesity, more obese individuals may re-quire gastric surgery.
The hospital costs associated with obesity may have risen to more than $127 million per year (in 2001 constant dollars) in recent years. These costs represent more than a threefold increase. As a per-centage of costs for overall hospital discharges, obe-sity-associated costs increased from 0.43% in 1979 – 1981 to 1.7% in 1997–1999. The disparity between the changes in costs and the changes in prevalence of obesity may reflect the disproportionate increase in severe obesity from the 1970s to the 1990s.
This study had several limitations. First, the dis-charge frequency cannot be used to assess disease prevalence because a person with multiple dis-charges during a year may be sampled more than
once. Second, physicians’ awareness of obesity or willingness to list obesity as a diagnosis may change over time. We did not consider this effect in analyz-ing discharge frequency because of lack of informa-tion. Third, only 4 obesity-associated diseases were examined for the trend analysis of diseases, and type 1 and type 2 diabetes were not differentiated, al-though we included only discharges that listed both obesity and diabetes for the analysis of economic costs. Fourth, we used only discharges with an obe-sity diagnosis to estimate the economic burden of obesity. Therefore, our estimates are probably con-servative because many persons with obesity-associ-ated diagnoses may not have a severe enough weight problem for obesity to be listed, or doctors may not have listed obesity as a diagnosis for reimbursement Fig 2. A, Discharge frequency of diabetes diagnoses for children aged 6 to 11 years and adolescents aged 12 to 17 years. B, Discharge frequency of obesity diagnoses for children aged 6 to 11 years and adolescents aged 12 to 17 years. C, Discharge frequency of sleep apnea diagnoses for children aged 6 to 11 years and adolescents aged 12 to 17 years. D, Discharge frequency of gallbladder disease diagnoses for children aged 6 to 11 years and adolescents aged 12 to 17 years.
TABLE 2. National Estimates of Discharges of Diseases Among Youths Aged 6 to 17 Years During 1979 –1981 and 1997–1999
Disease 1979–1981 1997–1999 Increase (Decrease)
of Total From 1979–1981 to
1997–1999 Principal
Diagnosis
Secondary Diagnosis
Total Principal
Diagnosis
Secondary Diagnosis
Total
Diabetes 94 914 (83%) 20 023 (17%) 114 937 (100%) 73 014 (75%) 24 511 (25%) 97 525 (100%) (15%)
Obesity 6567 (23%) 22 044 (77%) 28 611 (100%) 1618 (4%) 42 597 (96%) 44 215 (100%) 55%
Sleep apnea 966 (9%) 10 319 (91%) 11 285 (100%) 1371 (4%) 29 671 (96%) 31 042 (100%) 175%
reasons. Finally, we analyzed hospital costs only. Other costs— costs for physician visits, medication, and indirect costs such as the effect of obesity on future earnings—are considerable.20 Inclusion of these costs would further increase the economic bur-den.
Several strengths of this study should also be noted. First, because this study used large, nationally representative samples collected over the past 20 years, we were able to examine trends and produce national estimates of hospital use and the economic burden of obesity. Although the proportion of obe-sity-associated discharges was low, the trend of the
proportion and its economic costs are accelerating. Second, because principal and secondary diagnoses were available, we were able to examine other major comorbidities associated with obesity. Finally, al-though our estimates of diseases and economic costs associated with obesity are likely to be conservative in absolute values, the data from this 20-year period portray a disturbing increase of hospital diagnoses of obesity-associated diseases and in health care costs.
CONCLUSION
The increasing frequency of hospital discharges of obesity-associated diagnoses suggests a rising dis-ease burden associated with obesity among children and adolescents. If the prevalence of obesity contin-ues to grow, the disease burden will surely increase further. As overweight children become overweight adults,21–26 the diseases associated with obesity and health care costs are likely to increase even more. Because disproportionate weight gains have oc-curred among heavier children,2the rate of obesity-associated diseases will rise even faster if the ex-panding prevalence of obesity continues. Clearly, both primary and secondary prevention of childhood obesity are required to address this epidemic.
REFERENCES
1. World Health Organization.Obesity: Preventing and Managing the Global Epidemic.Report of a WHO Consultation. Geneva, 3–5 June 1997.Geneva, Switzerland: WHO; 1998. WHO/NUT/98.1.
2. Troiano RP, Flegal KM. Overweight children and adolescents:
descrip-TABLE 3. Most Frequent Principal Diagnoses of Discharges Where Obesity Was Listed as Secondary Diagnosis in Youths in 1979 –1981 and 1997–1999
Disease ICD-9 Percentage
(1979–1981)
Percentage (1997–1999)
Difference in Percentages From 1979–1981 to 1997–1999
1 Asthma 493 5.9 8.1 2.2
2 Disturbance of conduct 312 0.0 4.7 4.7
3 Diabetes 250 7.6 4.6 ⫺3.0
4 Outcome of delivery V27 1.3 4.6 3.3
5 Other cellulitis and abscess 682 0.0 4.2 4.2
6 Depressive disorder 311 0.0 3.9 3.9
7 Neurotic disorders 300 1.1 3.9 2.8
8 Adjustment reaction 309 0.0 2.7 2.7
9 Gall bladder disease 574, 575 1.1 2.3 1.2
10 Chronic disease of tonsils and adenoids 474 1.1 2.2 1.1
11 Disturbance of emotions specific to childhood and adolescence
313 0.0 1.5 1.5
TABLE 4. Length of Stay and Hospital Costs of Discharges With an Obesity Diagnosis Among Youths Aged 6 to 17 Years During 1979 –1981 and 1997–1999
Items 1979–1981 1997–1999
Principal Diagnosis
Secondary Diagnosis
Total Principal
Diagnosis
Secondary Diagnosis
Total
Number of discharges 6567 22 044 28 611 1618 42 597 44 215
Length of stay (d/discharge) 6.35 5.01 5.32 13.46 6.76 7.00
Total days of care (⫻103d) 417.00 110.44 152.21 21.78 287.96 309.51
3-y hospital cost* ($ million) 10.30 27.50 37.90 23.22 306.96 329.93
Annual hospital cost ($ million) 3.43 9.17 12.60 7.74 102.32 110.09
Year 2001 value of annual hospital cost† ($ million)
9.56 25.55 35.10 8.96 118.45 127.44
* Based on the average cost per day of $1066 during 1997–1999, from US Bureau of Census, Statistical Abstract of the United States, 2000, and based on the average cost per day of $249 during 1979 –1981, from US Bureau of Census, Statistical Abstract of the United States, 1990. † Using 5% inflation rate. For the period of 1997–1999, dollar value inflated from 1998 to 2001, for the period of 1979 –1981, dollar value inflated from 1980 to 2001.
tion, epidemiology and demographics.Pediatrics. 1998;101:497–504 3. Update. prevalence of overweight among children, adolescents, and
adults—United States, 1988 –1994.MMWR Morb Mortal Wkly Rep. 1997; 46:198 –202
4. Troiano RP, Flegal KM, Kuczmarski RJ, Campbell SM. Overweight prevalence and trends for children and adolescents: the National Health and Nutrition Examination Surveys, 1963 to 1991.Arch Pediatr Adolesc Med. 1995;149:1085–1091
5. More American children and teens are overweight. Prevalence of over-weight among children and adolescents: United States, 1999 [news release]. Hyattsville, MD: National Center for Health Statistics; 2001 6. Must A, Strauss RS. Risks and consequences of childhood and
adoles-cent obesity.Int J Obesity Relat Metab Disord. 1999;23(suppl 2):S2–S11 7. Dietz WH. Health consequences of obesity in youth: childhood
predic-tors of adult disease.Pediatrics. 1998;(suppl):518 –525
8. Fagot-Campagna A, Pettitt DJ, Engelgau M, et al. Type 2 diabetes among North American children and adolescents: an epidemiologic review and a public health perspective.J Pediatr. 2000;136:664 – 672 9. American Diabetes Association. Type 2 diabetes in children and
ado-lescents.Diabetes Care. 2000;23:381–389
10. Rosenbloom AL, Joe JR, Young RS, Winter WE. Emerging epidemic of type 2 diabetes in youth.Diabetes Care. 1999;22:345–354
11. Pinhas-Hamiel O, Dolan LM, Daniels SR, Standiford D, Khoury PR, Zeitler P. Increased incidence of non-insulin-dependent diabetes melli-tus among adolescents.J Pediatr. 1996;128:608 – 615
12. National Hospital Discharge Survey. 1979 –1999 Multi-year Public-use Data File Documentation. Hyattsville, MD: National Center for Health Statistics; 2001
13. US Census Bureau.Statistical Abstract of the United States: 1990.110th ed. Washington, DC: US Census Bureau; 1990
14. US Census Bureau.Statistical Abstract of the United States: 2000.120th ed. Washington, DC: US Census Bureau; 2000
15. Shah BV.SUDAAN User’s Manual, Release 6.0. Research Triangle Park, NC: Research Triangle Institute; 1992
16. French SA, Story M, Perry CL. Self-esteem and obesity in children and adolescents: a literature review.Obes Res. 1995;3:479 – 490
17. Gortmaker SL, Must A, Perrin JM, Sobol AM, Dietz WH. Social and economic consequences of overweight in adolescence and young adult-hood.N Engl J Med. 1993;329:1008 –1012
18. Wadden TA, Stunkard AJ. Social and psychological consequences of obesity.Ann Intern Med. 1985;103:1062–1067
19. Baeten JM, Bukusi EA, Lambe M. Pregnancy complications and out-comes among overweight and obese nulliparous women.Am J Public Health. 2001;91:436 – 440
20. Gorstein J, Grosse RN. The indirect costs of obesity to society. Pharmaco-Economics. 1994;5(suppl 1):58 – 61
21. Whitaker RC, Wright JA, Pepe MS, Seidel KD, Dietz WH. Predicting obesity in young adulthood from childhood and parental obesity.
N Engl J Med. 1997;337:869 – 873
22. Serdula MK, Ivery D, Coates RJ, Freeman DS, Williamson DF, Byers T. Do obese children become obese adults? A review of the literature. Prev Med. 1993;22:167–177
23. Abraham S, Nordsieck M. Relationship of excess weight in children and adults.Public Health Rep. 1960;75:263–273
24. Rimm IJ, Rimm AA. Association between juvenile onset obesity and severe adult obesity in 73,532 women.Am J Public Health. 1976;66: 479 – 481
25. Srinivasan SR, Bao W, Wattigney WA, Berenson GS. Adolescent over-weight is associated with adult overover-weight and related multiple cardio-vascular risk factors: the Bogalusa Heart Study.Metabolism. 1996;45: 235–240
DOI: 10.1542/peds.109.5.e81
2002;109;e81
Pediatrics
Guijing Wang and William H. Dietz
1999
−
Economic Burden of Obesity in Youths Aged 6 to 17 Years: 1979
Services
Updated Information &
http://pediatrics.aappublications.org/content/109/5/e81
including high resolution figures, can be found at:
References
http://pediatrics.aappublications.org/content/109/5/e81#BIBL
This article cites 20 articles, 1 of which you can access for free at:
Subspecialty Collections
http://www.aappublications.org/cgi/collection/obesity_new_sub
Obesity
_sub
http://www.aappublications.org/cgi/collection/child_health_financing
Child Health Financing
http://www.aappublications.org/cgi/collection/endocrinology_sub
Endocrinology
following collection(s):
This article, along with others on similar topics, appears in the
Permissions & Licensing
http://www.aappublications.org/site/misc/Permissions.xhtml
in its entirety can be found online at:
Information about reproducing this article in parts (figures, tables) or
Reprints
http://www.aappublications.org/site/misc/reprints.xhtml
DOI: 10.1542/peds.109.5.e81
2002;109;e81
Pediatrics
Guijing Wang and William H. Dietz
1999
−
Economic Burden of Obesity in Youths Aged 6 to 17 Years: 1979
http://pediatrics.aappublications.org/content/109/5/e81
located on the World Wide Web at:
The online version of this article, along with updated information and services, is
by the American Academy of Pediatrics. All rights reserved. Print ISSN: 1073-0397.