Open Access
Research article
Seasonality and trend in blood lead levels of New York State
children
Valerie B Haley and Thomas O Talbot*
Address: Bureau of Environmental and Occupational Epidemiology, New York State Department of Health, 547 River Street, Troy, New York 12180, USA
Email: Valerie B Haley - vbh03@health.state.ny.us; Thomas O Talbot* - tot01@health.state.ny.us * Corresponding author
Abstract
Background: Environmental exposure to lead remains a significant health problem for children. The costs of lead exposure in children are estimated to be considerably more than other childhood diseases of environmental origin. While long-term trends in blood lead levels (BLLs) among children are declining, seasonal variation persists. Cross-sectional studies have found a peak in summer months. Part of this variation may be due to increased exposure to lead paint on window sills and through increased contact with soils containing lead during the summer. The current study represents the largest published population-based study on seasonality and trends in the BLLs of children to date. In addition, the results offer a comparison of recent data on seasonality of BLLs in New York State children, to studies conducted over the past three decades.
Methods: 262,687 New York State children born between 1994 and 1997 were screened for blood lead within 2 weeks of their first or second birthdays. Time series analyses of blood lead data from these children were conducted to study the seasonality and trends of BLLs.
Results: Children's blood lead values showed a distinct seasonal cycle on top of a long-term decreasing trend. The geometric mean BLL declined by about 24% for children born between 1994 and 1997. The prevalence of elevated BLLs in two-year-olds was almost twice that in one-year-olds over the time period. Nearly twice as many children had elevated BLLs in the late summer compared to late winter/early spring. In this and previous cross-sectional studies, the amount of seasonality as a proportion of the mean ranged between 15% and 30%.
Conclusion: Pediatricians should be aware of the seasonality of BLLs. For example, if a two-year-old receives a borderline result during the winter, it is possible that the levels would have been higher if he had been tested during the summer. However, physicians should continue to screen children at their normally scheduled well-child visits rather than delaying until summertime and possibly postponing the discovery of an elevated BLL. Age, season, and time trends still need to be considered in lead studies and result interpretation.
Background
Seasonal variation in children's blood lead levels has been well documented. Cross-sectional studies of children in
New York City [1], New Haven [2,3], Chicago [4], Mil-waukee [5], Syracuse [6], and Los Angeles [7], and of cord blood in Boston [8] and Taipei [9], all found a primary
Published: 04 June 2004
BMC Pediatrics 2004, 4:8 doi:10.1186/1471-2431-4-8
Received: 18 February 2004 Accepted: 04 June 2004
This article is available from: http://www.biomedcentral.com/1471-2431/4/8
peak in the summer months. Longitudinal studies have shown conflicting results. Summer peaks were reported in Boston [10] and Jersey City [11], but not in New York City [12] or Sydney [13]. Small longitudinal studies may not control for changes in children's exposure with age, or the educational benefit of the screening process, as well as larger cross-sectional studies.
At least part of the seasonal variation in children may be explained by increased exposure to lead in summer. Sev-eral explanations have been suggested. Researchers have measured the greatest amounts of lead dust on floors and windowsills in the summer [11]. Lead may be tracked in on shoes and blown in through windows [14,15], and lead dust may be created when windows with lead paint are repeatedly opened and closed [16]. Children also play outdoors more in the summer, where they contact soil and street dust that may contain high levels of lead [11]. Complex interactions involving vitamin D and calcium may also play a role, but results are inconsistent [11,17].
Exposure to lead is significant because it damages the cen-tral nervous system and adversely affects learning and behavior even at low levels [18]. Young children are at a heightened risk for several reasons [19]. Normal mouth-ing activity may result in the mouth-ingestion of contaminated dust and soil. Lead intake as a proportion of body mass and lead absorption are higher in children than in adults. In addition, the central nervous systems of children are more vulnerable during early childhood development. The toxicity of lead depends on the dose, the duration of exposure, and the developmental and nutritional suscep-tibility of the child [20,21].
While blood lead levels are declining [22,23], environ-mental exposure to lead remains a significant health prob-lem for children. The cost of the cognitive and behavioral consequences of lead exposure is estimated to be 43.4 bil-lion dollars annually in the United States, considerably more than other childhood diseases of environmental ori-gin [24]. The United States Centers for Disease Control and Prevention considers blood lead levels (BLLs) of 10 micrograms per deciliter [0.48 micromoles per liter] the threshold of concern that initiates follow-up [22]. In sev-eral inner-city urban areas in upstate New York, more than 25% of children born between 1994 and 1995 and screened prior to age two had BLLs at or above this thresh-old [25]. NYS requires all health care providers to screen the blood of one- and two-year-olds for lead [26]. We are using this rich database to report on the seasonality and trends in blood lead levels of NYS children, providing the largest published population-based study of seasonality to date. It is useful to compare these results with previ-ously published reports of seasonality, since blood lead
levels and sources of lead exposure have been decreasing over time.
Methods
The NYS Department of Health Laboratory Reporting Sys-tem provided data on the BLLs of children born between 1994 and 1997. Data included the name, address, and date of birth of the child, the name and telephone number of a parent or guardian, the sample date, the laboratory identification number, the blood lead value, and the method by which the blood sample was obtained (finger-stick or venipuncture). Over 80 clinical laboratories reported results, but approximately 75 percent of the reports came from just 10 labs. All the laboratories were certified by participating in the New York State proficiency testing program under the Clinical Laboratory Program Improvement Amendments of 1988 [27]. We do not expect that there would be a seasonal pattern to the preci-sion and accuracy of blood lead screening that would affect our results.
We selected only those children screened within 2 weeks of their first or second birthdays to control for the effect of age on BLLs, and to examine the sample of children screened normally at their well-care visits. If a child was screened more than once within two weeks of his first or second birthday (less than 1% of data), we used the aver-age BLL obtained by venipuncture since these samples are less susceptible to environmental contamination than fin-gerstick samples [28]. We used the average finfin-gerstick measure if no venipuncture measures were available for the child.
We analyzed the proportion of children with elevated BLLs (≥10 µg/dL) since it allows us to estimate the number of children within a community who will need follow-up blood lead screening and family lead educa-tion. Also, this proportion is not affected by extreme results that may be due to child specific traits such as pica or by laboratory detection limits. The detection limit of the test was at most 5 µg/dL for over 97% of our non-detects, and the average detection limit was 3 ug/dL. Six-teen percent of the data were reported as below the detec-tion limit. In order to compare our results with previous studies, we calculated the geometric mean BLL. To do this, we imputed the values below the detection limit based on the observed lognormal distribution. This process may have diluted the seasonal effects by up to 5%.
method (fingerstick or venipuncture) to verify that the seasonal results were not related to sampling method.
We plotted the percentage of children with elevated BLLs by month/year and age group to show the seasonal varia-tion in the data. We also calculated a long-term trend line by regressing the natural log of the percent of children with elevated BLLs over time. This transformation was selected to stabilize the variance of the cycle; the magni-tude of the variation was greater when the BLLs were higher in the earlier years. We also compared our results to previously published reports to see if the seasonality of BLLs has changed over time.
Results
The final dataset contained 262,687 children. This number may be lower than the true number of children screened within two weeks of their first or second birth-days since some children screened after age two were not included in the dataset used for this analysis. Since the ratio of the number of children screened to the number of children born was consistent by month, there was no sea-sonality to the selection of subjects that could bias our results.
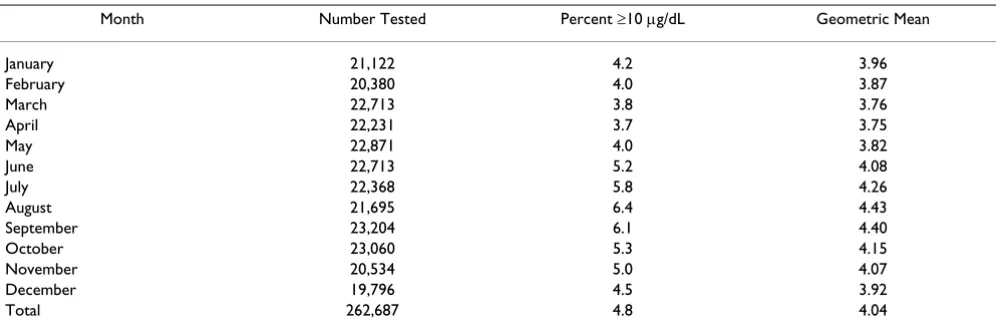
Table 1 summarizes the percent of children with BLLs greater than or equal to 10 µg/dL and the geometric mean blood lead level by month. For both measures, the maxi-mum occurred in late summer, and the minimaxi-mum occurred in late winter/early spring. The percent of chil-dren with elevated blood lead levels was 1.7 times higher in August compared to April, while the geometric mean BLL was only 1.2 times higher in August compared to April. This occurred because seasonality did not affect all of the values in the distribution equally; it affected higher levels more.
In our dataset, 59% of the children were screened using venipuncture, 36.5% had fingersticks, and 4.5% had no method recorded. The fingerstick values were slightly higher than the venipuncture values, however the propor-tions were reasonably stable over the study period. We observed very similar magnitudes of seasonal effect when we analyzed the fingerstick and venipuncture data separately.
Figure 1 shows a more detailed picture of the prevalence of elevated BLLs by subdividing the data by age group and year. The curves show a marked seasonal cycle over a slow exponential decline. The curves have a sharper profile in the summer compared to the winter. They peak around August, and dip in March/April each year. The prevalence of elevated BLLs in two-year-olds was almost twice that in one-year-olds over the time period.
Conclusion
The time series of children's blood lead values showed a distinct seasonal cycle on top of a long-term decreasing trend. Similar declines have been observed nationwide [22]. These declines have generally been attributed to public awareness, lead paint remediation, replacement of older homes, and the phase out of lead from gasoline.
The summertime elevations in BLLs that we observed are consistent with other studies. Consideration of multiple studies also revealed that the magnitude of the seasonality declines in proportion to BLLs. For example, by inspecting the graphs of Billick [1], we found that in New York City in the early seventies, the geometric mean seasonal differ-ence was on the order of 5 µg/dL when BLLs averaged 25
µg/dL. In Milwaukee in the early nineties, the mean differ-ence was on the order of 4 µg/dL when BLLs were 15 µg/ dL [5]. We observed a geometric mean seasonal difference of less than l µg/dL with BLLs around 4 µg/dL. In nine
Table 1: Summary of blood lead levels by month*
Month Number Tested Percent ≥10 µg/dL Geometric Mean January 21,122 4.2 3.96 February 20,380 4.0 3.87 March 22,713 3.8 3.76 April 22,231 3.7 3.75
May 22,871 4.0 3.82
June 22,713 5.2 4.08 July 22,368 5.8 4.26 August 21,695 6.4 4.43 September 23,204 6.1 4.40 October 23,060 5.3 4.15 November 20,534 5.0 4.07 December 19,796 4.5 3.92 Total 262,687 4.8 4.04
studies over the past thirty years, the amount of seasonal-ity as a proportion of the mean consistently ranged between 15% and 30% [1,3-9].
The decrease in BLLs over time suggests that exposures have changed, while continuing to support the current hypotheses regarding seasonality. Blood lead levels may be higher in summer due to increased indoor and outdoor exposure to lead in dust and soil. Source apportionment has shown that indoor lead is due to tracked-in soil, street dust, aerosol deposition, and lead paint [29].
Pediatricians should be aware of the seasonal phenome-non when interpreting blood lead results. For example, if a two-year-old receives a borderline result during the win-ter months, it is possible that the levels would have been higher if he had been tested during the summer. A large number of children near 10 µg/dL could be affected. How-ever, physicians should continue to provide information on lead poisoning prevention and screen children at their normally scheduled well-child visits rather than delaying
until summertime and possibly postponing the discovery of an elevated BLL. Age, season, and time trends still need to be considered in lead studies and result interpretation.
Competing Interests
None declared.
Authors' Contributions
VBH participated in the study design, literature review, data cleaning, data analysis, and manuscript preparation. TOT conceived of the study and participated in the study design, data cleaning, and manuscript preparation.
Acknowledgements
We thank Alexia Iasonos, and John Camadine, for their help cleaning and managing the data. We thank Sue Grady and Steve Forand for providing edi-torial comments.
References
1. Billick IH, Curran AS, Shier DR: Analysis of pediatric blood lead levels in New York City for 1970–1976.Environ Health Perspect
1979, 31:183-90.
Percent of children with elevated blood lead levels over time, by age
Figure 1
Publish with BioMed Central and every scientist can read your work free of charge "BioMed Central will be the most significant development for disseminating the results of biomedical researc h in our lifetime."
Sir Paul Nurse, Cancer Research UK
Your research papers will be:
available free of charge to the entire biomedical community
peer reviewed and published immediately upon acceptance
cited in PubMed and archived on PubMed Central
yours — you keep the copyright
Submit your manuscript here:
http://www.biomedcentral.com/info/publishing_adv.asp
BioMedcentral 2. Stark AD, Quah RF, Meigs JW, De Louise ER: Season as a factor in
variability of blood-lead levels in children. Conn Med 1980, 44(7):410-3.
3. Marrero O, Meigs JW, Stark AD, Quah RF: Seasonal patterns in children's blood-lead levels: A second peak in late winter.
Conn Med 1983, 47(1):1-5.
4. Hayes EB, McElvaine MD, Orbach HG, Fernandez AM, Lyne S, Matte TD: Long-term trends in blood lead levels among children in Chicago: Relationship to air lead levels. Pediatrics 1994, 93(2):195-200.
5. U.S. Environmental Protection Agency: Seasonal trends in blood lead levels in Milwaukee: Statistical methodology.Washington, D.C. Report No.:EPA-747-R-95-010 1996.
6. Johnson DL, McDade K, Griffith D: Seasonal variation in pediat-ric blood lead levels in Syracuse, NY, USA.Environ Geochem Health 1996, 18:81-88.
7. Rothenberg SJ, Williams FA Jr, Delrahim S, Khan F, Kraft M, Lu M, et al.: Blood lead levels in children in South Central Los Angeles.
Arch Environ Health 1996, 51(5):383-8.
8. Rabinowitz MB, Needleman HL: Temporal trends in the lead concentrations of umbilical cord blood. Science 1982, 216:1429-31.
9. Hwang Y-H, Wang J-D: Temporal fluctuation of the lead level in the cord blood of neonates in Taipei.Arch Environ Health 1990, 45(1):42-5.
10. U.S. Environmental Protection Agency: Seasonal rhythms of blood-lead levels: Boston, 1979–1983.Washington, D.C. Report No.: EPA-747-R-94-003 1995.
11. Yiin L-M, Rhoads GG, Lioy PJ: Seasonal influences on childhood lead exposure.Environ Health Perspect 2000, 108:177-82. 12. McCusker J: Longitudinal changes in blood lead level in
chil-dren and their relationship to season, age, and exposure to paint or plaster.Am J Public Health 1979, 69(4):348-52.
13. Gulson BL, Mizon KJ, Korsch MJ, Mahaffey KR, Pederson D: Limited seasonality effects on blood lead for a small cohort of female adults and children.Sci Total Environ 2000, 253:119-26.
14. Mielke HW, Reagan PL: Soil is an important pathway of human lead exposure.Environ Health Perspect 1998, 106(Suppl 1):217-29. 15. Schwartz J, Levin R: The risk of lead toxicity in homes with lead
paint hazard.Environ Res 1991, 54:1-7.
16. U.S. Environmental Protection Agency: Lead in your home: a par-ent's reference guide.Washington, D.C., Report No.: EPA-747-B-98-002 1998.
17. Hunter JM: The summer disease: an integrative model of the seasonality aspects of childhood lead poisoning. Soc Sci Medicine 1977, 11:691-703.
18. Canfield RL, Henderson CR Jr, Cory-Slechta DA, Cox C, Jusko TA, Lanphear BP: Intellectual impairment in children with blood lead concentrations below 10 µg per deciliter.N Engl J Med
2003, 348(16):1517-26.
19. Mushak P: Defining lead as the premiere environmental health issue for children in America: criteria and their quan-titative application.Environ Res 1992, 59:281-309.
20. American Academy of Pediatrics, commitee on Environmental Health: Screening for elevated blood lead levels. Pediatrics 1998, 101(6):1072-1078.
21. Agency for Toxic Substances and Disease Registry: Toxicological Profile for Lead. Atlanta, GA: U.S. Department of Health and Human Services; 1999.
22. Meyer PA, Pivetz T, Dignam TA, Homa DM, Schooner J, D Brody, Centers for Disease Control and Prevention: Surveillance for ele-vated blood lead levels among children – United States, 1997–2001.MMWR Surveill Summ 2003, 52:1-21.
23. New York State Department of Health: Protecting our children from lead: the success of New York's efforts to prevent child-hood lead poisoning.Albany, NY 2001.
24. Landrigan JL, Schechter CB, Lipton JM, Fahs MC, Schwartz J: Envi-ronmental pollutants and disease in American children: esti-mates of morbidity, mortality, and costs for lead poisoning, asthma, cancer, and developmental disabilities.Environ Health Perspect 2002, 110(7):721-28.
25. Talbot TO, Forand SP, Haley VB: Geographic analysis of child-hood lead exposure in New York State. In Proceedings of the 3rd National Conference on GIS in Public Health, San Diego, CA
[http:www.atsdr.cdc.gov/GIS/conference98/proceedings/proceed ings.html]. 17–20 August 1998
26. New York State: Public Health Law, section 206 and Title X of Article 13. 1993.
27. Parsons PJ, Reilly AA, Esernio-Jenssen D, Werk LN, Mofenson HC, Stanton NV, et al.: Evaluation of blood lead proficiency testing: Comparison of open and blind paradigms.Clin Chem 2001, 47(2):322-330.
28. Parsons PJ, Reilly AA, Esernio-Jenssen D: Screening children exposed to lead: an assessment of the capillary blood lead fingerstick test.Clin Chem 1997, 43(2):302-11.
29. Adgate JL, Willis RD, Buckley TJ, Chow JC, Watson JG, Rhoads GG,
et al.: Chemical mass balance source apportionment of lead in house dust.Environ Sci Technol 1998, 32:108-14.
Pre-publication history
The pre-publication history for this paper can be accessed here: