University of Pennsylvania
ScholarlyCommons
Publicly Accessible Penn Dissertations
1-1-2013
The Neural Representation of Value and individual
Differences in Human Intertemporal Choice
Nicole Cooper
University of Pennsylvania, [email protected]
Follow this and additional works at:
http://repository.upenn.edu/edissertations
Part of the
Neuroscience and Neurobiology Commons
, and the
Psychology Commons
Recommended Citation
Cooper, Nicole, "The Neural Representation of Value and individual Differences in Human Intertemporal Choice" (2013).Publicly Accessible Penn Dissertations. 845.
The Neural Representation of Value and individual Differences in Human
Intertemporal Choice
Abstract
Intertemporal choices, or decisions that involve tradeoffs between rewards and time, are ubiquitous in our
daily lives. The tendency to devalue, or discount, future rewards has been linked to maladaptive long-term
health and financial outcomes. Despite their broad clinical relevance, individual differences in discounting
preferences are poorly understood. In this thesis, we make progress on the understanding of the neural basis of
these decisions and factors that affect individual differences. The first two chapters focus on neurobiology.
Chapter 2 investigates the decision-related variables that best explain the observed patterns of BOLD activity
in ventromedial prefrontal cortex (VMPFC) and ventral striatum (VS) during intertemporal choice. We find
that these regions carry different signals and likely contribute to different stages of the choice process. Across
the brain, we find four kinds of value-responsive regions, each carrying different combinations of value-related
signals. Next, we examine whether we can predict participants' choices from any or all of these groups of
regions, and find that we can predict choice from most value-responsive regions, with interesting exceptions.
In Chapter 3, we identify a novel brain predictor of individual differences in discounting. When participants
are making judgments about how far away some number of days feels, discount rates, measured a week later,
can be predicted from how VMPFC and VS respond as a function of temporal distance. This difference in the
basic response to delayed time intervals could be a target for interventions aiming to reduce discount rates. In
the final chapter, we find several behavioral manipulations that are able to reduce discount rates persistently
and to a significant degree. We find that there is a general lack of knowledge about the normative strategy in
the monetary discounting task, and that providing information about this strategy - to accept all delayed offers
that provide higher interest rates than one could obtain elsewhere - reduces discounting significantly, for at
least one month. Information about peers' strategies for making these decisions also reduces discounting.
Taken together, this work advances our understanding of individual differences in discounting and further
suggests interventions that could be used to reduce discounting.
Degree Type
Dissertation
Degree Name
Doctor of Philosophy (PhD)
Graduate Group
Neuroscience
First Advisor
Joseph W. Kable
Keywords
Subject Categories
THE NEURAL REPRESENTATION OF VALUE AND INDIVIDUAL DIFFERENCES IN HUMAN
INTERTEMPORAL CHOICE.
Nicole Cooper
A DISSERTATION
in
Neuroscience
Presented to the Faculties of the University of Pennsylvania
in
Partial Fulfillment of the Requirements for the
Degree of Doctor of Philosophy
2013
Supervisor of Dissertation
_______________________
Joseph W. Kable
Assistant Professor, Psychology
Graduate Group Chairperson
______________________
Joshua I. Gold, Associate Professor, Neuroscience
Dissertation Committee
Anjan Chatterjee, Professor, Neurology
Sharon Thompson-Schill, Professor, Psychology
Geoffrey Aguirre, Assistant Professor, Neurology
THE NEURAL REPRESENTATION OF VALUE AND INDIVIDUAL DIFFERENCES IN HUMAN
INTERTEMPORAL CHOICE.
COPYRIGHT
2013
Nicole Cooper
This work is licensed under the Creative Commons Attribution- NonCommercial-ShareAlike 3.0 License
To view a copy of this license, visit
ABSTRACT
THE NEURAL REPRESENTATION OF VALUE AND INDIVIDUAL DIFFERENCES IN HUMAN
INTERTEMPORAL CHOICE.
Nicole Cooper
Joseph W. Kable
Intertemporal choices, or decisions that involve tradeoffs between rewards and time, are
ubiquitous in our daily lives. The tendency to devalue, or discount, future rewards has been linked
to maladaptive long-term health and financial outcomes. Despite their broad clinical relevance,
individual differences in discounting preferences are poorly understood. In this thesis, we make
progress on the understanding of the neural basis of these decisions and factors that affect
individual differences. The first two chapters focus on neurobiology. Chapter 2 investigates the
decision-related variables that best explain the observed patterns of BOLD activity in
ventromedial prefrontal cortex (VMPFC) and ventral striatum (VS) during intertemporal choice.
We find that these regions carry different signals and likely contribute to different stages of the
choice process. Across the brain, we find four kinds of value-responsive regions, each carrying
different combinations of value-related signals.Next, we examine whether we can predict
participants’ choices from any or all of these groups of regions, and find that we can predict
choice from most value-responsive regions, with interesting exceptions. In Chapter 3, we identify
a novel brain predictor of individual differences in discounting. When participants are making
judgments about how far away some number of days feels, discount rates, measured a week
later, can be predicted from how VMPFC and VS respond as a function of temporal distance. This
difference in the basic response to delayed time intervals could be a target for interventions
aiming to reduce discount rates. In the final chapter, we find several behavioral manipulations that
are able to reduce discount rates persistently and to a significant degree. We find that there is a
that providing information about this strategy – to accept all delayed offers that provide higher
interest rates than one could obtain elsewhere – reduces discounting significantly, for at least one
month. Information about peers’ strategies for making these decisions also reduces discounting.
Taken together, this work advances our understanding of individual differences in discounting and
TABLE OF CONTENTS
ABSTRACT
... iii
LIST OF TABLES
... vii
LIST OF ILLUSTRATIONS
...viii
CHAPTER 1 - Introduction
... 1
Delay discounting
...1
Measurement and meaning of discount rates
...1
Individual differences
...3
Neural basis of valuation and value-based choice
...5
Neuroanatomy of reward
...5
Subjective value representation
...6
Value-based decision making
...8
Research aims
...10
CHAPTER 2 – Neural differentiation of subjective value and value comparison during
intertemporal choice in humans
... 12
Abstract
...12
Introduction
...12
Materials and methods
...15
Results
...22
Discussion
...27
CHAPTER 3 – Brain activity in valuation regions while thinking about the future predicts
individual discount rates
... 40
Abstract
...40
Introduction
...40
Materials and methods
...42
Results
...47
Discussion
...49
CHAPTER 4 – Normative arguments from experts and peers reduce delay discounting
56
Abstract
...56
1 Introduction
...57
1.1 Background
...57
1.2 Summary and main contributions
...59
2. Experiment 1 – Online survey
...60
2.1 Methods
...60
2.2 Results
...63
2.3 Discussion
...64
3. Experiment 2 – Financial guide and interest rate instruction session
...66
3.1 Methods
...66
3.2 Results
...70
4. Experiment 3 – Prescriptive financial guide
...73
4.1 Methods
...73
4.2 Results
...75
4.3 Discussion
...76
5. Experiment 4 – Peer-generated advice
...78
5.1 Methods
...78
5.2 Results
...81
5.3 Discussion
...83
6. General discussion
...84
CHAPTER 5 – General discussion
... 96
Neural mechanisms of choice
...96
Neural representation of value
...99
Dorsolateral prefrontal cortex and self-control
...100
Functions of the medial prefrontal cortex
...102
Considerations for discounting interventions
...104
Conclusions
...106
APPENDIX
... 107
LIST OF TABLES
2.1 Brain activity predicts choices...38
2.2 Brain activity predicts choices beyond objective variables ...39
4.1 Survey response category percentages ...94
LIST OF ILLUSTRATIONS
2.1 Delay discounting task and discount rate distribution...31
2.2 Analysis of subjective value and value comparison in ventromedial prefrontal cortex and ventral striatum ...32
2.3 BOLD activity patterns in ventromedial prefrontal cortex and ventral striatum ...33
2.4 Analysis of maximum value in ventromedial prefrontal cortex and ventral striatum ...34
2.5 Whole brain analysis of subjective value and value comparison...35
2.6 Imaging results replicate in both samples...36
2.7 Whole brain analysis of value and response demands ...37
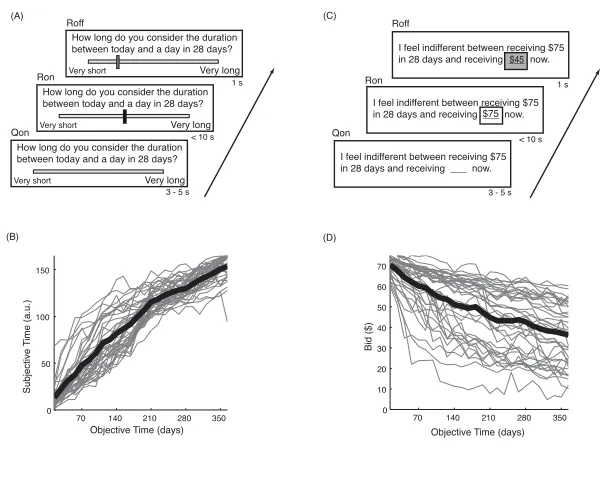
3.1 Temporal judgment and temporal discounting tasks ...53
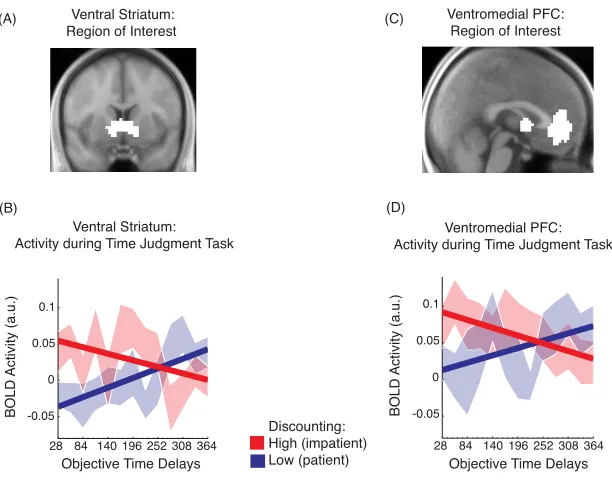
3.2 BOLD activity during the temporal judgment task differentiates high and low discounters ...54
3.3 Individual neural delay sensitivities during temporal judgment predict delay discount rates ...55
4.1 Discount rates before and after reading financial guide ...91
4.2 Discount rates before and after reading prescriptive financial guide ...92
CHAPTER 1 - Introduction
Delay discounting
Measurement and meaning of discount rates
Many of the decisions we make in our daily lives involve tradeoffs between rewards and
time. For example, we must decide how much of our earnings to spend now and what to save for
retirement; whether to eat appetizing and rich desserts or to refrain in favor of healthier foods;
whether to smoke a cigarette for the immediate satisfaction or to quit and keep our physical
health intact. These types of decisions, with outcomes occurring at different points in time, are
referred to as intertemporal choices. When making these decisions, humans and other animals
tend to devalue, or discount, rewards to be received in the future (Ainslie and Haslam, 1992;
Frederick et al., 2002; Green and Myerson, 2004; Soman et al., 2005; Kalenscher and Pennartz,
2008).
A task often utilized in laboratory studies of human intertemporal choice is a monetary
delay discounting paradigm which asks subjects to repeatedly choose between receiving smaller
amounts of money immediately (or soon) or larger amounts of money at a later date (Kirby and
Maraković, 1995). Participants who are willing to wait into the future for delayed rewards have low
discount rates, and those who strongly prefer immediate rewards have high discount rates. In the
absence of manipulations, discount rates have been shown to be a very stable behavior within
individuals, on the timescale of weeks (Senecal et al., 2012), months (Ohmura et al., 2006) and
even years (Kirby, 2009).
Despite this consistency within individuals, there is wide variability in preferences
between individuals. This discounting task, then, lends itself to investigations of individual
differences. Preferences on this type of monetary delay discounting task are not an isolated
laboratory behavior. Years of research into individual differences in discounting have yielded
myriad reasons why this behavior is important. Impatience on this style of laboratory
smoking (Audrain-McGovern et al., 2004; Chabris et al., 2008); pathological gambling (Petry,
2001a; Reynolds, 2006); obesity (Epstein et al., 2010); low exercise & high BMI (Chabris et al.,
2008); and a lack of creditworthiness (Meier and Sprenger, 2012). On the other hand, more
patient, far-sighted performance on delay discounting tasks has been related to higher
intelligence (Shamosh and Gray, 2008; Burks et al., 2009); life satisfaction and subjective health
(Becker et al., 2012); and academic and social performance in children and adolescents (Mischel
et al., 1988; Duckworth and Seligman, 2005). The goal of this thesis is to further the
understanding of the neural basis for these tradeoffs, and particularly what drives these individual
differences, to inform successful interventions.
A normative solution
An element unique to the monetary discounting task is that there is a normative solution.
The normative strategy is to compare the interest rate offered implicitly by each choice pair to the
interest rates one has access to outside of the experiment (Fisher, 1930; Read, 2004). If a
subject could borrow the smaller amount of money on offer, wait for the larger payoff, and then be
able to repay this loan plus interest and still make a profit, then the larger later option is the better
choice, whether the subject intends to spend the money immediately or not.
Despite this normative solution, most studies of delay discounting observe discount rates
much higher than market interest rates, some even in the range of several hundred percent per
year (Thaler, 1981; Ainslie and Haslam, 1992; Coller and Williams, 1999; Frederick et al., 2002;
Reynolds, 2006; Chabris et al., 2008). A number of factors could contribute to
higher-than-normative discount rates; some of these, which imply non-higher-than-normative discounting, are described
below (see individual differences). It is also possible that people do discount according to the
normative strategy, but have normatively relevant reasons to discount more highly. For example,
the normative strategy depends on the interest rates available to each individual in their personal
finances. If participants are credit constrained, or do not have investment opportunities available,
they would be justified in accepting only immediate options. Selecting the option of waiting for a
participants felt that either the receipt of the delayed payment, or their place in the future in
general, contained an element of risk, then they would be justified in demanding a higher rate of
return for waiting (Benzion et al., 1989; Keren and Roelofsma, 1995; Dasgupta and Maskin, 2005;
Bommier, 2006; Halevy, 2008; Gerber and Rohde, 2010). Chapter 4 of this dissertation explores
a lack of understanding of the normative strategy as a contributor to high discount rates, through
an online survey and several laboratory experiments, and finds evidence that this is a factor in
high discount rates.
Several mathematical models have been put forth to describe discounting behavior. The
earliest was the discounted utility model, proposed by Samuelson (1937). The discounted utility
model takes an exponential form, and involves just one free parameter to describe the steepness
of the discounting function. The shape of this function dictates that the rate of discounting is
equivalent across all future time intervals. Despite the simplicity of this model, and the convenient
normative predictions it makes, it fails to capture the nuances of empirically observed behavior.
Individuals do tend to discount shorter time intervals more steeply than longer ones (Thaler,
1981; Prelec and Loewenstein, 1991). A model with a hyperbolic form captures this behavior
pattern while still using a single free parameter to describe discounting steepness, and
outperforms the normative exponential model in predicting behavior in humans (Rachlin et al.,
1991; Kirby and Maraković, 1995; Green et al., 1997; Kirby and Finch, 2010), primates (Kim et
al., 2008), rodents (Richards et al., 1997), and pigeons (Mazur, 1987). Models with additional
parameters have been proposed to explain variations in discount rates due to contextual or
framing effects (Laibson, 1997; Read, 2001; Scholten and Read, 2006); however, the hyperbolic
form is generally preferred in neuroeconomics, for its simplicity and good fit to behavior.
Individual differences
Despite the clear clinical relevance of delay discounting, there are relatively few
manipulations that are known to affect discount rates, nor are there clear links to trait-like
individual differences. The chapters in this thesis make progress on this both through behavioral
The most commonly reported manipulations of discount rates are contextual and framing
effects, such as phrasing choices in terms of interest rates (Coller and Williams, 1999; Read et
al., 2005a), presenting exact dates of delayed payment receipt rather than delay durations (Read
et al., 2005b), and cuing future planned events or scenarios in addition to delay durations (Peters
and Büchel, 2010a; Benoit et al., 2011). It has also been shown that discounting for gains is less
than discounting for losses (Green and Myerson, 2004), and that discounting is steeper for lower
amounts of money than for very large amounts (Kirby and Maraković, 1995; Myerson and Green,
1995; Green et al., 1997).
The effects described above could be grouped under the category of “state” effects
(Peters and Büchel, 2011), in that they are temporary changes dependent on the presentation of
the task. Fewer “trait”, or more permanent, differences in discounting have been identified. For
example, older adults discount less steeply than younger adults, and individuals with a high base
income level discount less steeply than those with very low income (Green et al., 1994; 1996;
1999). Discount rates have also been reported to be negatively related to some measure of
intelligence, such as IQ, education level, or scholastic achievement (Kirby et al., 2005; Shamosh
and Gray, 2008; Burks et al., 2009). Reports of correlations with personality variables, such as
impulsivity, are inconsistent.
Other effects concern individuals’ perception of the future. The perception of time and
temporal distance differs within individuals, and may effect discount rates (Kim and Zauberman,
2009; Zauberman et al., 2009). One study finds framing effects of relative temporal distance on
discount rates (Kim and Zauberman, 2013). Several studies have found that people who feel
more connected, or similar to, their future selves are lower discounters (Ersner-Hershfield et al.,
2009a; 2009b; Bartels and Rips, 2010; Mitchell et al., 2011); this finding has also been linked to
differences in brain activity. Chapter 3 of this thesis looks further for individual differences in the
brain, by investigating individuals’ responses to the future as a potential predictor of discount
Neural basis of valuation and value-based choice
Understanding how preferences are represented and choices are executed in the brain
could elucidate other potential targets for investigating individual differences. This neural process
of value-based decision making can be broken down into several steps. The decision maker must
be able to understand what the possible options are and evaluate them, select the higher valued
option and execute the necessary action to obtain it, and evaluate and learn from the outcome of
the decision (Rangel et al., 2008; Kable and Glimcher, 2009). The latter component of this
schema, which requires outcomes to be experienced during the course of the task, are the topic
of the subfield of reinforcement learning (Rangel et al., 2008; Balleine and O'Doherty, 2009; Niv,
2009; Schultz, 2010). The decision making tasks described herein do not involve experienced
outcomes and will therefore focus heavily on the first two components of this process.
Neuroanatomy of reward
Although much of the brain can be responsive to the value of stimuli and events, a core
set of regions is central to value-based decision making. The seminal finding by Olds and Milner
(1954, 1956) that rats will work to electrically self-stimulate the nucleus accumbens initiated the
examination of the neuroanatomy of the reward system. Since then, evidence from across
species and research modalities has converged on a coherent model of reward processing, at the
core of which is a cortico-basal ganglia circuit involving the ventral striatum, orbitofrontal cortex,
and midbrain dopamine neurons (Hikosaka et al., 2008; Haber and Knutson, 2010).
Dopaminergic neurons in the substantia nigra send extensive inputs both to other basal
ganglia structures, including the striatum, and to cortical regions, including orbitofrontal and
medial prefrontal cortices. The striatum consists of the caudate, putamen, and nucleus
accumbens. The nucleus accumbens, and the ventral portion of the striatum more broadly, are
reciprocally connected primarily with the orbital and medial prefrontal cortices, and with the
anterior cingulate (Haber and Knutson, 2010). While all of the striatum is responsive to reward, it
possible goods; the dorsal portion of the striatum is more linked to action selection during choice
execution (Hikosaka et al., 2008).
The orbitofrontal cortex (OFC) contains the most ventral portion of the prefrontal cortex,
and the area of OFC which overlaps with the medial wall of the prefrontal cortex is termed the
ventromedial prefrontal cortex (VMPFC). Although the lateral OFC is most often linked to value
representation in non-human primates, it is the ventromedial region that responds to reward in
humans (Wallis, 2011). The OFC and VMPFC receive strong dopaminergic innervation, as well
as inputs from many cortical regions, and indirect input from the ventral striatum (through the
thalamus). In addition, the OFC is the only part of the prefrontal cortex that receives input from
every sensory modality (Carmichael and Price, 1995), making this an ideal location for integrating
all aspects of value.
Human neuroimaging experiments demonstrate that ventral striatum and ventromedial
prefrontal cortex are involved in the valuation of primary rewards such as preferred food, drinks,
odors, and touch (Kringelbach et al., 2003; Rolls et al., 2003; Grabenhorst et al., 2007; McClure
et al., 2007); secondary rewards such as money and trinkets (Knutson, 2005; Delgado, 2007;
Chib et al., 2009); and more abstract rewards such as social approval and cooperation (Sanfey et
al., 2003; King-Casas et al., 2005; Fehr and Camerer, 2007; Montague and Lohrenz, 2007). This
is supported by results in the primate literature demonstrating, using single-unit recordings, that
neurons in these regions can represent the subjective value of choice options in a number of
tasks (Wallis and Miller, 2003; Samejima, 2005; Padoa-Schioppa and Assad, 2006; Lau and
Glimcher, 2007; Rolls et al., 2008).
Subjective value representation
Decades of evidence support the claim that the evaluation, comparison, and selection of
choice options are done in the space of subjective, rather than objective, values. This allows for
the comparison of choice options across distinct domains (Rangel et al., 2008; Kable and
objective characteristics of any choice option, but a composite obtained from a weighted
combination of the relevant objective features of the option.
Experiments that aim to correlate brain activity with subjective value can obtain estimates
of value in a number of ways. Subjective value can be inferred from the choices subjects make
between stimuli, or assessed more explicitly by asking subjects to rate some positive feature of
the stimuli (pleasantness, liking) or to provide an amount of money they would be willing to pay to
obtain the stimulus. Quantitative meta-analyses of the large literature on this topic have found
that the ventromedial prefrontal cortex and ventral striatum reliably reflect value on a subjective
scale (Levy and Glimcher, 2012; Bartra et al., 2013; Clithero and Rangel, 2013).
Subjective value representations have been examined in a wide variety of tasks. For
example, activity in the ventral striatum and ventromedial prefrontal cortex reflects the potential
values of risky gambles, and scales with subjective measures of loss aversion (Tom et al., 2007).
The ventromedial prefrontal cortex also reflects the monetary value that hungry subjects place on
preferred foods (Plassmann et al., 2007) and the value of potential food choices, integrating
health and preference ratings (Hare et al., 2009; 2011a; Hutcherson et al., 2012). Some studies
have looked at reward representation of different categories of goods within the same individual,
and found large overlap regions (Chib et al., 2009; FitzGerald et al., 2009; Basten et al., 2010). A
number of studies have shown that the ventral striatum and ventromedial prefrontal cortex
represent subjective value during intertemporal choice tasks (McClure et al., 2004; Kable and
Glimcher, 2007; McClure et al., 2007; Ballard and Knutson, 2009; Peters and Büchel, 2009; Pine
et al., 2009; Kable and Glimcher, 2010). If a region tracks subjective value, rather than objective
value, then its activity should correlate with the objective values that go into the subjective
estimate, but be better accounted for by the subjective variable. Several papers do this
comparison directly, and do report higher correlations of VS and VMPFC activity with subjective
value than objective values such as probability, amount, delay, or expected value (Kable and
Glimcher, 2007; Peters and Büchel, 2009). Confirming the importance of ventromedial prefrontal
value-based choices, particularly when options are close in value (Fellows and Farah, 2007;
Noonan et al., 2010; Camille et al., 2011; Kennerley and Walton, 2011; Glascher et al., 2012).
The ventromedial prefrontal cortex and ventral striatum contain a representation of value
even when participants are performing an orthogonal task, and are not explicitly asked to judge
how much they like something (Lebreton et al., 2009; Tusche et al., 2010; Smith et al., 2011). For
example, Lebreton et al (2009) asked participants to view a series of images and judge the age of
the objects or faces shown in those images. After the scan, participants were asked to make
choices between the stimuli. Despite performance of an orthogonal task during viewing, VMPFC
still contained a reliable correlate of the pleasantness ratings that were obtained later. Several
other studies find that neural activity in these regions while participants are judging stimuli (on
qualities related to value) can predict choices made later(Tusche et al., 2010; Levy et al., 2011).
It is also possible to predict differences in discounting from neural responses to different
tasks that may tap into components of the discounting process. For example, high discounters
exhibit a higher VS response to unpredicted rewards (Hariri et al., 2006). Differential responses in
VMPFC to judgments of oneself in the present compared to the future also predict discount rates
(Ersner-Hershfield et al., 2009b; Mitchell et al., 2011). In Chapter 3 we investigate a more basic
neural predictor of discount rates, and find a differential pattern of response in VMPFC and VS for
high and low discounters while participants are merely evaluating future time intervals. This
suggests an interesting new target for behavior change.
Value-based decision making
As described above, the process of value-based decision-making requires the evaluation,
comparison, and selection of choice options. While work in the field of neuroeconomics has
largely converged on an understanding of where subjective value is represented in the brain, the
question of how and where decisions are made between these representations is still under
debate (Rushworth et al., 2009; Wallis and Kennerley, 2010; Rushworth et al., 2012; Summerfield
Given the strong relationship between subjective value and activity in the ventral striatum
and ventromedial prefrontal cortex, early summaries of work in neuroeconomics concluded that
these regions were primarily responsible for evaluating choice options (it should be noted that
these regions are also crucial for aspects of learning, although it is not discussed here; c.f.
Balleine and O’Doherty, 2009; Schultz, 2010). The functions of action selection and execution
have been posited to belong to the dorsolateral and parietal cortices, and perhaps also to the
anterior cingulate cortex (Kable and Glimcher, 2009; Kennerley and Walton, 2011). However, as
the field progresses in experimental design and methodology, these labels have become less
clear.
One aspect of this is that it seems possible for choices to be made both in the space of
goods or of actions. While both models agree that the evaluation of choice options takes place in
OFC/VMPFC, the goods-based model posits that decisions are made between these abstract
value representations, and then translated to a motor response by regions such as the anterior
cingulate and posterior parietal cortices (Padoa-Schioppa, 2011). The action-based model, on the
other hand, proposes that these abstract value representations for each choice option are
translated to potential actions, and that decisions are made in the space of these differently
valued action plans (Rangel et al., 2008). While it is evident that the brain can make decisions in
either schema, the question of whether these possible mechanisms are used in parallel, or
somehow selected depending on the choice situation, is an open debate.
Value-based decision making requires a number of different variables to be computed,
which are often highly correlated with one another, and occurring very close together in time
(Behrens et al., 2007; Hare et al., 2008; Wallis and Kennerley, 2010). Because of the frequently
high correlation between these variables, and the lack of rigor in comparing them in the same
experiments, it is sometimes unclear what variables best explain brain activity in a given brain
region.
One region for which the literature has mixed findings is the ventromedial prefrontal
(Kable and Glimcher, 2007; Hare et al., 2008; Chib et al., 2009; Kable and Glimcher, 2010), but
also with the value of the option that is ultimately chosen (Blair et al., 2006; Glascher et al., 2009;
Wunderlich et al., 2009; 2010; Barron et al., 2013), and with measures of the difference in value
between the choice options (Boorman et al., 2009; FitzGerald et al., 2009; Basten et al., 2010;
Philiastides et al., 2010; Rolls et al., 2010; Lim et al., 2011; Hare et al., 2011b; De Martino et al.,
2012; Hunt et al., 2012; 2013). Within this mix of reports, interpretations of the findings also differ.
One school of thought posits that choices between goods are made within VMPFC, and that the
true pattern of activity resolves to the chosen option (Padoa-Schioppa and Assad, 2006; Hunt,
2008). Another possibility is that VMPFC truly represents the value of whatever option is being
attended, and that this valuation signal is translated to action plans downstream of VMPFC (Lim
et al., 2011; Hare et al., 2011b).Resolution between these models will require careful
examination of model assumptions, and likely methods other than fMRI. However, Chapter 2
contributes to this discussion with a careful analysis of disambiguated decision variables, and
examines which variable(s) best explain activity in several value-related brain regions.
Research aims
The goal of this dissertation is to examine neural and behavioral factors that affect
valuation and choice during intertemporal decision making. The first chapter contributes to the
debate about the differentiation of valuation versus choice by making an important statistical point
about localization of certain decision-related variables, and identifying which brain regions can
predict choices. The next two chapters provide insight into underlying individual differences in
intertemporal decision making, first identifying a neural predictor of differences in discount rates,
and second using a set of behavioral experiments to explore factors that change discount rates.
Both chapters provide potential targets for discounting interventions.
We begin, in Chapter 2, with an fMRI study of intertemporal choice. Despite a consistent
understanding of what regions in the brain respond to subjective value, there is a lack of
generated by a choice process. Several prominent theories have made competing claims about
the choice process being associated with specific variables in particular brain regions. However,
most studies stop once they have found regions that correlate with their putative decision signals,
rather than looking for discriminative evidence that their model of interest best describes activity
in a given region. In this chapter, we separate several decision variables of interest, and examine
which variables best explain activity in value-related regions. We find a dissociation between the
combinations of decision-related signals carried by four different sets of regions. While we
replicate some of the predictions of each of two prominent models, neither perfectly describes the
data. Additionally, we examine whether regions that represent different combinations of decision
variables are differentially predictive of participants’ choices.
In Chapter 3, we move from the prediction of choices to the prediction of individual
differences. Here we ask whether we can predict delay discounting from neural activity during a
task about the perception of time, in which participants make judgments about how far away
some number of days feels. Regions crucial to the representation of subjective value, the ventral
striatum and ventromedial prefrontal cortex, carry representations during temporal judgments that
predict delay discount rates obtained in a separate task. This builds on previous work identifying
correlations between discounting and performance of other tasks, and provides insight into
individual differences in discounting.
Chapter 4 is a series of behavioral studies that further investigate contributing factors to
higher than normative discount rates, including lack of awareness or understanding of the
normative strategy. We find that when asked what factors are important considerations when
making intertemporal choices, most participants do not spontaneously cite the crucial elements of
the normative strategy. Two studies find that providing participants with information about the
normative strategy significantly reduces discount rates, even after a delay period of about one
month. These studies together suggest that a contributor to variable discount rates is not just time
CHAPTER 2 – Neural differentiation of subjective value and value comparison during
intertemporal choice in humans
Abstract
In the neuroeconomics literature, a reliable finding is that BOLD activity in the ventromedial
prefrontal cortex (VMPFC) and ventral striatum (VS) is correlated with the subjective value of
choice options during value-based decision making. However, in many studies, subjective value
(the overall value of all options offered) is highly correlated with other decision-related variables.
Here we design a delay discounting task that can distinguish several of these variables, and find
that while activity in VS is best explained by subjective value, activity in VMPFC represents the
chosen (maximally valued) option. In the whole brain, we find distinct groups of regions that
represent different combinations of these variables: ventral striatum and anterior and posterior
cingulate cortices reflect subjective value; the amygdala and temporoparietal junction reflect
value comparison (the difference in value between the choice options); and dorsomedial and
lateral prefrontal and lateral parietal cortices multiplex subjective value and response-related
(reaction time) signals. Furthermore, we find that choices can be predicted from activity in most of
these value-related regions, except for those that only reflect value comparison. These findings
are the first to carefully disambiguate these decision variables and examine which best explain
brain activity.
Introduction
Theories of decision making from several disciplines posit that in making a choice, the
brain must be able to estimate the value of the available options on a generalized, subjective
scale, compare them, and select and execute the higher valued option (Rangel et al., 2008; Kable
and Glimcher, 2009). Much work in neuroeconomics has looked for neural correlates of the
ventral striatum (VS) in particular are frequently cited as representing value signals during
decision making, and recent meta-analyses confirm that these two regions in particular carry
domain general signals of subjective value (Levy and Glimcher, 2012; Bartra et al., 2013; Clithero
and Rangel, 2013).
While it is well established that VMPFC and VS are crucial for value-based decision
making, there is a lack of consistency in the dissociation of signals carried by these regions. The
process of value-based decision making involves the computation of several crucial variables,
which are often highly correlated and occurring close together in time, making their
disambiguation difficult. Compounding this challenge, there has been little emphasis on
estimating what the brain response is and examining what variables best capture it; rather,
previous work tends to test single models, without examining multiple variables, or allowing them
to compete in the same model.
Here we examine two particular variables of interest. One of these is the overall value, on
a participant-specific subjective scale, of the choice options on offer, referred to here as
subjective value. Another is a measure of the difference between the offered options on this
subject-specific scale, defined herein as value comparison. While many studies have
demonstrated a correlation between activity in VMPFC and VS and subjective value (Kable and
Glimcher, 2007; Hare et al., 2008; Chib et al., 2009; Kable and Glimcher, 2010), a number of
studies have also found a link between VMPFC activity and the value of the chosen option (Blair
et al., 2006; Glascher et al., 2009; Wunderlich et al., 2009; 2010; Barron et al., 2013), and value
comparison, or some construct of the difference in value between the choice options (Boorman et
al., 2009; FitzGerald et al., 2009; Basten et al., 2010; Philiastides et al., 2010; Rolls et al., 2010;
Lim et al., 2011; Hare et al., 2011b; De Martino et al., 2012; Hunt et al., 2012; 2013).
Identifying the pattern of BOLD activity in these regions, and the decision variable(s) that
best explain this activity, could help to distinguish between different models of how value-based
choice is executed. Several models have been put forth that make different predictions about
location of an attractor-network-based decision process that involves competition between
representations of the two options. In this model, the VMPFC should carry a signal of the
comparison between choice options (Hunt et al., 2012) . Other models propose that while VMPFC
does carry the value signals that are the input to a comparison process, comparison and choice
selection is executed elsewhere; in this schema, VMPFC should track subjective value of
attended items (Lim et al., 2011).
Here, we disambiguate subjective value and value comparison, using a carefully
designed human delay discounting task. In this task, participants make decisions between
smaller monetary rewards that are available immediately and larger rewards available after some
time delay. The discount rate, a measure of preference for immediate versus delayed rewards, is
estimated from these choices, and can be used to calculate the subject-specific discounted value
(subjective value) of each choice option seen during the task. Human fMRI studies using
discounting tasks have found reliable BOLD activation in VMPFC and VS that correlates with the
subjective value of choice options (Kable and Glimcher, 2007; Ballard and Knutson, 2009; Peters
and Büchel, 2009; Pine et al., 2009; Kable and Glimcher, 2010). However, previous work in
intertemporal choice has either not modeled multiple decision variables, such as both subjective
value and value comparison, or has reported very high correlations between these variables
(Kable and Glimcher, 2007; 2010), making them impossible to differentiate reliably.
We first perform a directed region of interest analysis of activity in VMPFC and VS, and
find that BOLD activity in VS tracks only the subjective value signal, while BOLD activity in
VMPFC tracks a combination of subjective value and value comparison signals. In an exploratory
whole-brain analysis, we find three additional groupings of regions representing different
combinations of these signals. Subjective value is represented positively in the ventral striatum,
and posterior and anterior cingulate cortices. Value comparison is positively correlated with
activity in the amygdala and temporoparietal junction. A third set of regions, including the
dorsomedial and dorsolateral prefrontal cortices and lateral parietal cortex, correlate positively
time. Additionally, we find that activity in these subgroups of value-related regions is differentially
predictive of choice – regions that track response demands are most predictive, and those that
track value comparison least so.
Materials and methods
Participants. Thirty-three participants were recruited from the University of Pennsylvania and
surrounding community. All participants were compensated for their time at each session, and
received additional payment based on their decisions in the delay discounting task. All
participants were consented in accordance with the procedures of the Institutional Review Board
of the University of Pennsylvania.
A total of 33 participants were collected in two samples. After exclusions, the first sample
consisted of 10 subjects, of whom 6 were female, and all were right-handed. The average age of
this sample was 22 years (SD=2.5yrs). The second sample consisted of 17 subjects, of whom 10
were female and 13 were right-handed. The average age of this sample was 22 years
(SD=3.8yrs).
In the first sample, subjects were pre-selected to be in the median 20% of the population
on a discounting questionnaire. All subjects saw the same stimuli, and completed three days of
scanning while completing the discounting task. In the second sample, subjects were
pre-screened to establish a baseline discount rate, but were not excluded based on initial screenings.
Choice stimuli for their single scanning session were tailored for each individual, according to this
baseline discount rate.
Three participants were excluded from analysis of the first sample because of excessive
head motion during the scan sessions (>5 spikes exceeding 1mm of movement, during at least 2
of their 3 sessions). In sample 2, another two participants were excluded for excessive head
motion (>10 spikes exceeding 1mm of movement). Finally, one participant was excluded from the
deviations above the mean of 2.4 missed trials [SD=4.7]). This leaves a total of 10 participants in
the first sample and 17 in the second sample.
One subject participated in both samples. This subject’s data is included in presentations
of each sample separately, but his data from the second sample has been removed for
presentations of both samples combined. Thus, the analyses that combine across samples have
a total of 26 unique participants.
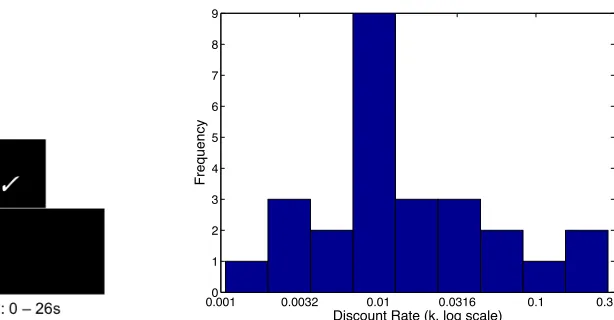
Task description. All scanning sessions involved a monetary delay discounting task, in which
participants made a series of decisions between a smaller amount of money available
immediately and a larger amount of money available after a delay. The smaller-sooner amount
was always $20 now, and the larger-later amount and delay were variable. Only the larger-later
option was presented on screen during the choice task. At the beginning of each scanning run,
participants were instructed whether to press the right or left button to accept the larger-later
option on the screen or to reject it in favor of $20 now. Halfway through the task, the right-left
contingency was switched; participants were explicitly told about, and shown a graphic
explaining, the switch. Participants had 4 seconds to make a choice once the larger-later option
appeared on the screen. After a choice was made, a feedback screen was displayed for 1
second. A checkmark was shown if the option on-screen (larger-later) was chosen, and an “X” if
the option on-screen was rejected in favor of $20 now. The inter-trial interval ranged from 0 – 26
seconds, with an average of 5 seconds. If participants made a decision in less than the allotted 4
seconds, the remaining decision time was incorporated into the inter-trial interval.
In the first sample, participants were selected to be in the median 20% of the population
based on a preliminary discounting questionnaire. At each session, participants made 192
choices between receiving $20 now or a larger amount at a later date. Amounts ranged from
$20.50 to $50, and delays from 1 to 180 days. All participants saw the same choice pairs within a
scan, but no choice pair was repeated within participants or across days. The study design in this
sample included an attempt to influence discount rates before the second scanning session;
ns). In the fMRI analyses presented below, discount rates from each scan day are used, rather
than an overall average, and will therefore account for any slight changes in discount rates
between scanning days.
In the second sample, participants were not pre-selected. However, the choice sets were
tailored to each participant. These participants completed a single scanning session, during which
they made 196 choices between non-repeating stimuli. The smaller-sooner option was always
$20 today. The maximum delay for a larger-later amount was 190 days for all participants. The
maximum larger-later amount offered after a delay was variable between participants. This
amount averaged $68 (SD=$51). Tailoring of stimuli was based on the baseline screening
discount rate, and was designed to reduce the correlations between the decision variables of
interest (described below).
In using different selection methods in each sample, we can rule out some possible
confounds. Selecting participants to be in a small range of discounting preferences allow us to
keep the stimuli constant, while still reducing the correlations between our variables of interest.
On the other hand, tailoring stimuli to each participant, without pre-selection, allows for direct
minimization of these correlations without limiting the range of preferences in pre-selection. When
analyzed separately, the two samples give very similar results (see below), indicating that our
findings are not limited to specific experimental design choices.
Payments. In addition to a flat $15 per-hour payment for their participation in each scanning
session, participants were paid an additional amount according to their decisions in the delay
discounting task. Participants rolled dice to randomly select one of the choice trials, and were
paid for the choice they made on that trial. All payments were made using pre-paid debit cards,
as described previously (Kable and Glimcher, 2007; 2010). The cards have the advantage of
making receipt of the delayed payment easy and reliable. If the participant chose the smaller
sooner option on the selected trial, the amount was available on the card immediately after the
session. If the participant chose the larger later option on the selected trial, the amount was
Behavioral data analysis. Discount rates in this experiment were calculated assuming a
hyperbolic discounting model (Mazur, 1987), such that SV = A / (1+k*D), where SV is the
subjective value of the delayed option, A is the monetary amount of the delayed option, D is the
time delay in days, and k represents the individually fit discount rate. Discount rates were
estimated using a logistic regression model, implemented in Matlab (Mathworks, Natick, MA). We
estimated this function for each participant at each testing session. Because discount rates are
not normally distributed, any statistics performed on discount rates substitute the log transform of
the discount rate.
We primarily investigated two decision variables, subjective value and value comparison.
Within a scanning session, for each participant, decision variables were estimated by applying the
estimated discount rate to the options seen on each trial. Subjective value was taken to be the
discounted value of the larger later option on each trial. Because the value of the smaller sooner
option remained constant, this subjective value metric is collinear with the overall subjective value
of both options together. Value comparison was defined as the absolute value of the difference
between the smaller sooner option ($20) and the discounted value of the larger later option; this
value becomes smaller as the subjective value of the larger later option approaches $20, and
larger as the subjective value gets much higher or lower than $20.
Across all participants, the average correlation between subjective value and value
comparison was r=-0.04 (SD=0.56). In sample 1 alone, this correlation was r=0.17; in sample 2,
this correlation was r=-0.21. Given the low level of the overall correlation and the fact that the
directionality of correlation is opposite in the two samples, we believe we can make conclusions
about whether BOLD activity tracks one of these variables or some combination of them. In
previous studies of intertemporal choice, this correlation has been much higher (r=0.8 in Kable &
Glimcher 2010, r=0.75 in Kable & Glimcher 2007).
In a set of region of interest analyses, we also consider the maximally valued option.
Maximum value is taken as the highest subjectively valued option – this is the subjective value of
between maximum value and subjective value was r=0.85 (SD=0.09), and the average correlation
between maximum value and value comparison was r=0.42 (SD=0.39).
Of possible interest are a parallel set of decision variables that are more dependent on
trial-by-trial choice. For example, instead of the maximally valued option, one could look for
representations of the option chosen on each trial. Likewise, instead of taking the value
comparison metric to be the absolute value of the difference between the choice options, one
could analyze the difference between the chosen and unchosen options. The variables used here
are less dependent on trial-by-trial choices than on overall preferences. Both of these sets of
variables are highly correlated, as participants nearly always choose the maximally valued option
(chosen value vs maximum value, r=0.92; absolute value difference vs chosen minus unchosen,
r=0.88). Analyses reported here do not differ significantly when using this set of parallel variables.
The estimated discount rate was also used to calculate a measure of choice consistency.
Choice consistency was defined as the percentage of a participant’s actual choices predicted
correctly by the estimated discount rate from that same session. The choice predicted by the
estimated discount rate is simply the option with the higher subjective value, according to that
discount rate.
The average reaction time was 1.46 seconds (SD=0.24s). Participants were allowed 4 s
to make a response, and could do so as soon as the choice was presented. On the vast majority
of trials (over 99%), participants were able to make a choice in this timeframe. Across both
samples, the correlation between reaction time and subjective value was 0.12 (SD=0.24). In
sample 1, this correlation was r=0.04, and in sample 2, r=0.17. Across both samples, the
correlation between reaction time and value comparison was r=-0.37 (SD=0.13). In sample 1, this
correlation was r=-0.39; in sample 2, r=-0.35. Both of these correlations are significant in the
combined sample (reaction time and subjective value, p<0.034; value comparison, p<0.0001).
MRI image acquisition. Functional and anatomical scans were collected using a 3T Siemens
Trio scanner equipped with a 32-channel head coil. High resolution T1-weighted anatomical
0.9375 x 1.000 mm, 192 x 256 matrix). T2*-weighted functional images were collected using an
EPI sequence (TR = 3s, TE = 30ms, 45 axial slices, 3 x 3 x 3 mm, 64 x 64 matrix). The slice
acquisition angle was 30° from the AC-PC line, in order to reduce signal dropout in regions such
as orbitofrontal cortex (Deichmann et al., 2003). Each scan consisted of 168 images. In the first
sample, all participants completed four scans at each of three sessions. Five trials of scanning
data were lost from the final session of one participant due to experimenter error. In the second
sample, all participants completed four scans at one session.
Imaging data analysis. Functional images were analyzed using VoxBo (www.voxbo.org),
incorporating tools from SPM8 and AFNI. Functional images were sinc-interpolated in time to
adjust for staggered slice acquisition, corrected for head motion by realigning all volumes to the
first volume of the scanning session using six-parameter rigid-body transformations, and
de-trended and high-pass filtered (cutoff of 126 cycles per scan, or 0.0079 Hz) to remove low
frequency drift in the fMRI signal. Images were co-registered with each participant’s
high-resolution anatomical scan and normalized into MNI space. Normalized data were then spatially
smoothed (kernel FWHM=9mm) and thresholded to remove voxels outside of the brain.
Single-participant analyses were performed using the general linear model as
implemented in VoxBo. Estimation was by ordinary least squares. For participants in the first
sample, the three scans were concatenated (totaling 12 runs) for analysis after preprocessing.
First level models used the respective scan’s discount rate for calculation of decision variables.
The first general linear model (GLM1) tested the effect of different decision variables at
the onset of the trial, and included three covariates of interest. The first covariate modeled the
time at which a trial began (first 100ms), when participants saw the larger-later choice option. The
second and third covariates were parametric modulators of subjective value and value
comparison for the choice pair in each trial. These values were all mean-centered, so the
parametric modulator covariates fit the deviations from mean activity that were correlated with the
GLM2 included the same regressors as the first model, with an additional parametric
regressor that modeled the reaction time on each trial. This regressor was also mean-centered.
GLM3a included mean-centered onset time and parametric chosen value covariates. GLMs 3b
and 3c built on GLM3, adding parametric regressors for either subjective value (GLM3b) or value
comparison (GLM3c).
Group random-effects analyses were performed using the summary statistics approach,
which tests whether the mean effect at each voxel is significantly different from zero across
participants. Contrast maps were initially thresholded at p<0.005 (uncorrected), and the
appropriate spatial extent threshold for corrected cluster-level inference at p<0.05 was
determined for each contrast. Cluster thresholds were determined using the AlphaSim function in
AFNI. Group tests were performed across both samples, as well as for each sample separately.
Region of interest analysis. We used a priori regions of interest from a recent quantitative
meta-analysis of studies that report value-related neural signals during decision-making (Bartra et al.,
2013). The regions used here were the result of a conjunction analysis looking for areas that (1)
exhibit primarily positive correlations with subjective value, (2) correlate with subjective value
during the experience of decision outcomes and during the decision process, and (3) correlate
with subjective value across different choice modalities (i.e., money, food). The resulting regions
are bilateral ventral striatum (147 voxels at 3x3x3 mm, centered on MNI coordinates -3, 10, -4)
and ventromedial prefrontal cortex (137 voxels at 3x3x3mm, centered on MNI coordinates -1, 46,
-7). Downloadable versions of masks from these regions can be found at
(http://www.sas.upenn.edu/~mcguirej/meta-analysis.html). There are subtle differences between
the masks used here and the downloadable masks, due to the downsampling process from 2mm
to 3mm voxel sizes.
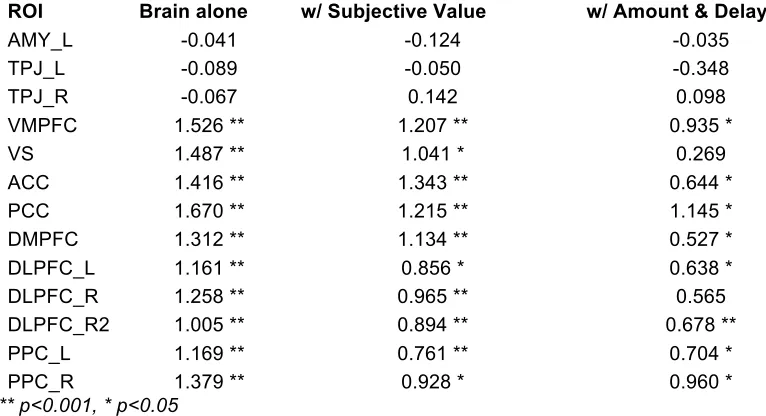
Prediction analysis. The prediction analysis was performed on BOLD activity that was averaged
and demeaned, by run, in each region of interest. Preprocessing included smoothing, motion
correction, and normalization. Because of the event-related nature of the task, the LSS procedure
trial. This method obtains each trial’s activation estimate using a general linear model including a
regressor for a given trial as well as a second regressor for all other trials in the set; this
procedure is repeated for each trial.
Classification was implemented using logistic regression on activity from several regions
of interest. The regions of interest used in the prediction analysis were defined based on the
contrasts of GLM1. In each region, the area under the curve (AUC) of the regression and beta
values on the brain activity predictor were estimated. The most basic classification included only
an intercept term and the brain activity betas (resulting from the LSS procedure) in the logistic
regression. Subsequent models also included the subjective value of the later option, or the
amount and delay of the later option on each trial.
In all cases, the classification model was run separately for each subject. The
significance values presented in Table 1 for AUC are the result of a signed-rank test of all
subjects’ AUC values against 0.5 (chance level), and in Table 2, significance values for beta
coefficients are the result of a signed-rank test of all subjects’ beta values against 0.
Results
Behavioral data. Discount rates were estimated for each participant using a hyperbolic model.
The average discount rate was k=0.014 (in sample 1, k = 0.012; in sample 2, k = 0.015). See
Figure 1 for distribution of discount rates across both samples. On average, 91% (SD = 4.5%) of
choices were consistent with the estimated discount rates during the scans (sample 1, 91%;
sample 2, 90%).
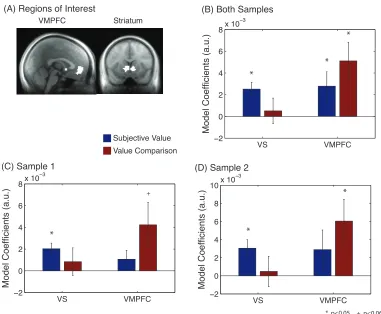
Region of interest analysis: Dissociation of subjective value and value comparison. We
performed a region of interest analysis to examine the BOLD response particularly in VS and
VMPFC, and explore what quantity best explains their responses. We used the results of a recent
meta-analysis of value-related neural signals during decision making (Bartra et al., 2013) to
define these regions of interest, displayed in Figure 2A. Average beta coefficients across both
VS, both subjective value and value comparison signals are present in VMPFC. There is a
significant interaction between the average coefficients for subjective value and value comparison
in these two regions (p<0.006, repeated-measures ANOVA), but not a significant difference
between the two variables within VMPFC. Figures 2C and 2D show this result in samples 1 and
2, respectively, with interactions trending towards significance for sample 1 (p<0.083) and
significant for sample 2 (p<0.033).
GLM2 adds a parametric reaction time covariate to GLM1. Reaction time coefficients in
these regions are not above zero, meaning that activity in these two regions does not scale
significantly with reaction time. The addition of reaction time does not reduce any other
coefficients to zero, and the interaction term remains moderate (p<0.067). The value comparison
response in VMPFC, then, is not attributable to response demands of the task, or we should see
a greater response in this area on trials for which the reaction time is shorter.
One alternate variable that could be represented in VMPFC is value relative to a
subject-specific reference point, rather than value comparison. If the choice that an individual generally
makes (now versus later) is taken as a reference point against which to evaluate the other option,
then the value of the delayed option on a given trial will be negative when the typical choice is the
now option, and positive when the typical choice is the later option. We tested this possibility with
a variant of GLM1 and found that this reference-point subjective value appears to be the inverse
of the original subjective value regressor, and the activity correlating with the value comparison
regressor changes very little. This suggests that the response we observe in VMPFC is not due to
only a value response that has a different reference point across subjects.
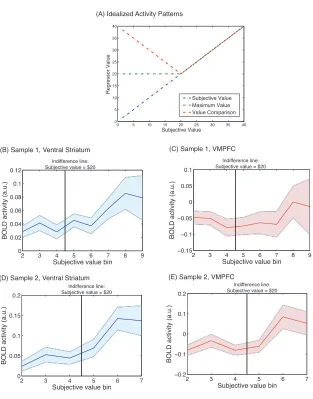
Another way to approach the problem of identifying which decision variables best fit
neural activity is to simply extract BOLD activity from these regions of interest and compare it to
several possible patterns. Figure 3A displays a plot of idealized activity patterns expected in a
region that codes subjective value, value comparison, or maximum value. Three possible patterns
are: linearly increasing activity with subjective value; a V shaped pattern that increases as the
subjective value of the later option once this is greater than $20, and remains a flat line at $20
when the subjective value of the later option is less than $20 (maximum value). Figures 3B and
3C plot the actual patterns of activity in the VMPFC and VS regions of interest, respectively, and
bin trials by subjective value (bin width = $5). Because stimuli were tailored to individual
participants in the second sample, and discount rates did vary in the first sample, the range of
subjective values varies across participants. As shown in Figures 3C and 3E, activity in VMPFC
in each sample is relatively flat until the indifference point, and then increases with the subjective
value of the later option once this is greater than $20. This is the expected pattern of activity for a
region that reflects the maximally valued choice option. Activity in VS is plotted for each sample in
Figure 3B and 3D, and increases roughly linearly with subjective value.
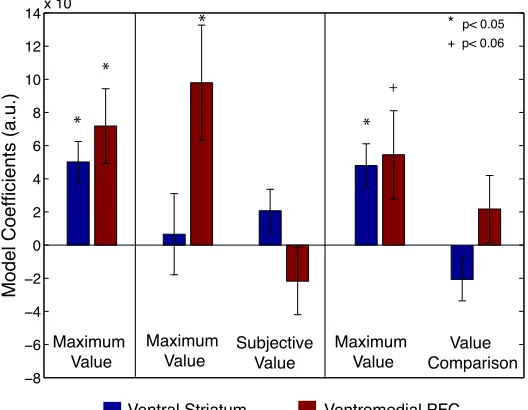
Region of interest analysis: Maximum value. The multiplexed subjective value and value
comparison signals observed in VMPFC in Figure 2 could be an indication that activity in VMPFC
actually follows the pattern of the maximum valued choice option, as suggested in Figure 3. To
examine this possibility further, we created three additional GLMs focusing on maximum value.
GLM3a models maximum value alone, and GLMs 3b and 3c add in subjective value and value
comparison, respectively. Figure 4 shows these model coefficients in the VS and VMPFC regions
of interest. In fact, activity in VMPFC is better explained by maximum value when it is included in
a model with value comparison, and when it is included in a model with subjective value. In VS,
however, when maximum value competes directly with subjective value, neither model has a
significant model coefficient. This could be due to the very high correlation between these two
variables (r=0.85).
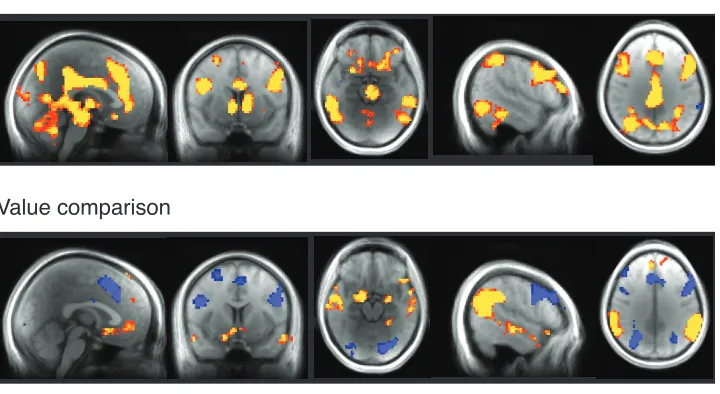
Whole brain analysis of subjective value and value comparison. Despite the importance of
VS and VMPFC in value representation, these are clearly not the only regions in the brain that
carry value signals. We performed a whole-brain analysis of GLM1 across both samples, with
results displayed in Figure 5.
We see four different patterns of activity in this whole-brain analysis: (1) positive
cingulate cortices (ACC, PCC), (2) positive correlation only with value comparison, including
superior/medial temporal gyri (STG/MTG), temporoparietal junction (TPJ), and amygdala (AMY),
(3) positive correlation with subjective value and negative correlation with value comparison,
including dorsomedial and lateral prefrontal cortices (DMPFC, DLPFC), and posterior parietal
cortex (PPC), and (4) positive correlation with subjective value and value comparison, exhibited
only in ventromedial prefrontal cortex (VMPFC).
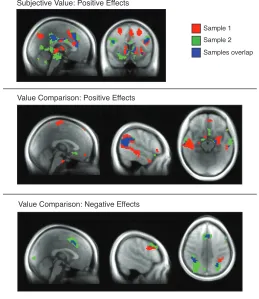
Separate samples. The results of analyzing subjective value and value comparison across both
samples suggest that there are separable groupings of regions that represent different
combinations of these variables. In Figure 6, we verify that these results still hold when the
samples are analyzed separately. There are positive effects of subjective value in both samples
in ventral striatum, anterior cingulate, and posterior cingulate (Figure 6A). Positive effects of value
comparison are present in both samples in ventromedial prefrontal cortex (albeit non-overlapping
areas), amygdala, and temporoparietal junction (Figure 6B). There are negative effects of value
comparison in dorsomedial and lateral prefrontal, and lateral parietal cortices (Figure 6C). Despite
some variability between samples, the results from the whole group largely replicate in each
sample individually.
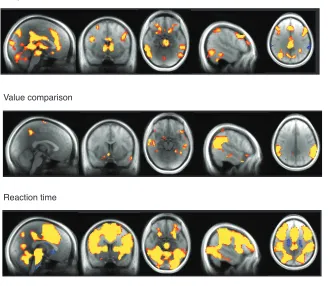
Reaction time. The pattern of activations in one set of regions identified above (DLFPC, PPC,
and DMPFC), correlating positively with subjective value and negatively with value comparison,
mirrors the pattern of reaction time correlations. One possibility, then, is that activity in these
regions is entirely explained by response demands. To test this, we ran a whole-brain analysis
including a parametric regressor for the reaction time on each trial, as well as regressors for
subjective value and value comparison (GLM2).
As displayed in Figure 7, the activity in these three regions does correlate positively with
reaction time. Even after accounting for this relation to reaction time, however, activity in these
regions still scales with subjective value, but not with value comparison. This bolsters the
argument that the signal carried in these regions is a multiplex of subjective value and response