Prediction Of Rainfall Using Machine
Learning Techniques
Moulana Mohammed, Roshitha Kolapalli, Niharika Golla, Siva Sai Maturi
Abstract: Rainfall prediction is important as heavy rainfall can lead to many disasters. The prediction helps people to take preventive measures and moreover the prediction should be accurate. There are two types of prediction short term rainfall prediction and long term rainfall. Prediction mostly short term prediction can gives us the accurate result. The main challenge is to build a model for long term rainfall prediction. Heavy precipitation prediction could be a major drawback for earth science department because it is closely associated with the economy and lifetime of human. It’s a cause for natural disasters like flood and drought that square measure encountered by individuals across the world each year. Accuracy of rainfall statement has nice importance for countries like India whose economy is basically dependent on agriculture. The dynamic nature of atmosphere, applied mathematics techniques fail to provide sensible accuracy for precipitation statement. The prediction of precipitation using machine learning techniques may use regression. Intention of this project is to offer non-experts easy access to the techniques, approaches utilized in the sector of precipitation prediction and provide a comparative study among the various machine learning techniques.
Index Terms: Rainfall, Prediction, Machine Learning, Regression, Accuracy.
—————————— ——————————
1.
INTRODUCTION
Rainfall forecasting is very important because heavy and irregular rainfall can have many impacts like destruction of crops and farms, damage of property so a better forecasting model is essential for an early warning that can minimize risks to life and property and also managing the agricultural farms in better way. This prediction mainly helps farmers and also water resources can be utilized efficiently. Rainfall prediction is a challenging task and the results should be accurate. There are many hardware devices for predicting rainfall by using the weather conditions like temperature, humidity, pressure. These traditional methods cannot work in an efficient way so by using machine learning techniques we can produce accurate results. We can just do it by having the historical data analysis of rainfall and can predict the rainfall for future seasons. We can apply many techniques like classification, regression according to the requirements and also we can calculate the error between the actual and prediction and also the accuracy. Different techniques produce different accuracies so it is important to choose the right algorithm and model it according to the requirements.
Regression analysis:
Regression analysis deals with the dependence of one variable (called as dependent variable) on one or more other variables, (called as independent variables) which is useful for estimating and/ or predicting the mean or average value of the former in terms of known or fixed values of the latter. For example, the salary of a person is based on his/her experience here, the experience attribute is independent variable salary is dependent variable. Simple linear regression defines the relationship between a single dependent variable and a single independent variable. The below equation is the general form of regression.
y = β0 + β1x + ε where β0 and β1 are parameters, and ε is a probabilistic error term. Regression analysis is a vital tool for modeling and analyzing information. It is used for predictive analysis that is forecasting of rainfall or weather, predicting trends in business, finance, and marketing. It can also be used for correcting errors and also provide quantitative support.
The advantages of regression analysis are:
1. It is a powerful technique for testing relationship between one dependent variable and many independent variables.
2. It allows researchers to control extraneous factors. 3. Regression asses the cumulative effect of multiple
factors.
4. It also helps to attain the measure of error using the regression line as a base for estimations.
2
LITERATURE
REVIEW
Thirumalai, Chandrasegar, et al. [1] discusses the amount of rainfall in past years according to the crop seasons and predicts the rainfall for future years. The crop seasons are Rabi, Kharif and Zaid. Linear regression method is applied for early prediction. Here, Rabi and kharif were taken as variables if one variable was given then other can be predicted using linear regression. Standard deviation and Mean was also calculated for future prediction of crop seasons. This implementation will be used for farmers to have an idea of which crop to harvest according to crop seasons. Geetha, A., and G. M. Nasira. [2] implements a model which predicts the weather conditions like rainfall, fog, thunderstorms and cyclones which will be helpful to the people to take preventive measures. Data mining techniques were used and a data mining tool named Rapid miner was used to model the decision trees. The data set of Trivandrum with attributes like day, temperature, dew point, pressure etc. The dataset is divided into training set and testing set and decision tree algorithm is applied. The accuracy is calculated, actual and predicted values are compared. The accuracy is 80.67 and to achieve high value it can be extended by applying soft computing techniques like fuzzy logic and genetic algorithms. Parmar, Aakash, Kinjal Mistree, and Mithila Sompura [3] discusses the different methods used for rainfall prediction for weather forecasting _______________________
Dr. Moulana Mohammed currently working as Associate Professor in Computer Science and Engineering in Koneru Lakshmaiah Education Foundation, India, E-mail: [email protected]
with their limitations. Various neural networks algorithm which are used for prediction are discussed with their steps in detail categorizes various approaches and algorithms used for rainfall prediction by various researchers in today’s era. Finally, presents conclusion of paper. Done the background work about some models of machine learning ARIMA Model, Artificial neural network and types like Back- Propagation Neural Network - Cascade Forward Back Propagation Network Layer Recurrent Network, Self-Organizing Map and Support Vector Machine, Collected, surveyed and table presents categorization of different approaches of rainfall prediction. Dash, Yajnaseni, Saroj K. Mishra, and Bijaya K. Panigrahi [4] has used artificial intelligence techniques like Artificial Neural Network (ANN), Extreme Learning Machine (ELM), K nearest neighbor (KNN) are applied for prediction of summer monsoon and post monsoon rainfall. The dataset used is the time series data of Kerala from 1871 to 2016 taken from Indian Institute of Tropical Meteorology (IITM).The data is pre-processed and normalization was performed on the data next, the data is divided into training and testing the data up to 2010 was taken as training set and the data from 2011-2016 taken as test set. The above mentioned algorithms were applied and its performance was calculated by using MAE, RMSE, and MASE. The ELM algorithm has given accurate results compared to the others. Singh, Gurpreet, and Deepak Kumar[5] states that there are many machine learning algorithms applied for the prediction of rainfall and in this, they have used a hybrid approach that is combining two techniques, Random forest and Gradient boosting with many machine learning techniques like ada boost, K-Nearest Neighbor(KNN), Support vector machine(SVM), and Neural Network(NN).These have been applied on the rainfall data of North Carolina from 2007 – 2017 and also the performance is calculated by applying different metrics F-score, precision, accuracy, recall. Finally, eight hybrid models have been proposed and Gradient boosting-Ada boost has been the superior which exhibited good results. Kar, Kaveri, Neelima Thakur, and Prerika Sanghvi [6] has used the fuzzy logic approach for the prediction of rainfall on the data of temperature in a geographic location. The fuzzy model has been applied Due to other climatic factors the prediction is not accurate so they have considered other influencing factors like humidity also analyzed the advantages of fuzzy system over other techniques. Sardeshpande, Kaushik D., and Vijaya R. Thool [7] has used the artificial neural networks, back propagation (BPNN), radial basis function (RBFNN) and generalized regression (GRNN) on the rainfall data of India mainly Nanded district, Maharashtra was considered and the data is normalized between 0 to 1 and the algorithms are applied and the performance of those was calculated and compared. BPNN and RBFNN has given good results compared to GRNN. Chen, Binghong, et al. [8] focuses on the non-linear machine learning approaches like gradient boosting decision tree model and deep neural networks for a short term prediction of rainfall and these algorithms were built on Alibaba cloud and data was collected from different sites and effectiveness is calculated by using classification metrics AUC, F1 score, precision and accuracy and by Regression metric RMSE, correlation. It has been observed that DNN showed better result than ECData. Moon, Seung-Hyun, et al [9] implements an early warning system (EWS) that produces a signal when it reaches a threshold limit that givesWarning before 3 hrs. This was done by using machine learning
techniques. South Korea data from 2007 to 2012 was taken and performance is measured by some criteria and a confusion matrix was produced. The logistic regression with feature selection and PCA was proposed. F-measure is calculated for estimating the efficiency of model.
3
PROPOSED
METHOD
The predictive model is used to prediction of the precipitation. The first step is converting data in to the correct format to conduct experiments then make a good analysis of data and observe variation in the patterns of rainfall. We predict the rainfall by separating the dataset into training set and testing set then we apply different machine learning approaches (MLR, SVR, etc.) and statistical techniques and compare and draw analysis over various approaches used. With the help of numerous approaches we attempt to minimize the error. Dataset Description:
The dataset [10] consists of the measurement of rainfall from year 1901-2015 for each state.
• Data consists of 19 attributes (individual months, annual, and combinations of 3 consecutive months) for 36 sub divisions.
• The data is available only from 1950 to 2015 for some of the subdivisions
• The attributes are the amount of rainfall measured in mm.
As the dataset is very large, feature reduction is done so that it improves the accuracy, reduces the computation time and also storage. Principal Component Analysis (PCA) is a technique of extracting necessary variables from a huge set of variables. It extracts low dimensional set with a motive to capture the maximum amount of information. With few variables, visualization becomes more significant. It is done by using covariance matrix and by obtaining Eigen values from it. In our dataset by using PCA it has reduced the attributes by considering only the rainfall data of combination of three consecutive months and annual data from every subdivision. Techniques used: Multiple Linear Regression:
Multiple regression tries to model the
connection between two or additional variables and a response by fitting an equation to determined information. Clearly, it's nothing however an extension of straight forward regression toward the mean. The general form of multivariable linear regression model is: y=α+β1x1+ β2x2+…+ βkxk+ε where y = dependent variable and x1, x2… xk are independent variables,α,β are coefficients. Multiple regression will model additional complicated relationship that comes from numerous options along they should to be employed in cases wherever one explicit variable isn't evident enough to map the link between the independent and also the variable quantity.
Support Vector Regression:
Regression tries to fit as many instances as possible on the street while limiting margin violations. The size of the lane is measured by a hyper parameter Epsilon.
Kernel- The function used to map a low dimensional data into higher dimensional data.
Hyper plane- in SVM this is a basically The Separation line between the data classes also in SVR we are going to define it is as the line that will that will help us to predict the continuous value or target value.
Boundary line - the SVM plane which creates imagine the support vector can be on boundary lines or outside the boundary line separates two classes in the concept same. Vectors-these are the data points which are closest to the boundary the distance of the point is minimum.
SVR performs linear regression in higher dimensional space. We can think of SVR as if each data point in the training represents its own dimension. When we evaluate kernel between a test point and a point in the training set the resulting value gives you the coordinate of your test point in that dimension. The vector we get when we evaluate the test point for all points in the training set, k is the representation of the test point in the higher dimensional space. The equation of the hyper plane is wx+b=0 and the two equations of boundary lines is Wx+b=+e, Wx+b=-e Equation that satisfy our SVR is e<=y-Wx-b<=+e
SVR has a different regression goal compared to linear regression in linear regression, we are trying to minimize the error between the prediction and data whereas in SVR a goal is to make sure that error do not exceed the threshold.
Lasso Regression:
Lasso is Least Absolute Shrinkage and Selection Operator Lasso regression works by introducing a bias term but instead of squaring the slope, the absolute value of the slope is added as a penalty term.
Lasso Regression:
Min (sum of squared residuals) + α * |slope| Here α * |slope| is penalty term.
The effect of Alpha on Lasso is as Alpha increases the slope of the regression line is reduced and becomes more horizontal and the model becomes less sensitive to the variations of the independent variable. Lasso Regression helps to reduce over fitting and it is particularly useful for feature selection. It can be useful if we have several independent variables that are useless
Fig 1. Rainfall Prediction Model
Algorithm:
Rainfall prediction Input: Rainfall data set
Output: Accuracy/error of the prediction Step1: Import the rainfall data set csv file.
Step2: Fill the missing values with mean value of the data. Step3: Scaling the features- scaling the data to a fixed scale. Step4: Feature Reduction- PCA is used to minimize the data. Step5: The data is divided into training set (70%) and testing set (30%).
Step6: Multiple Linear Regression algorithm, Support Vector Regression and Lasso Regression is applied and the Mean Absolute Error, r2 score is calculated.
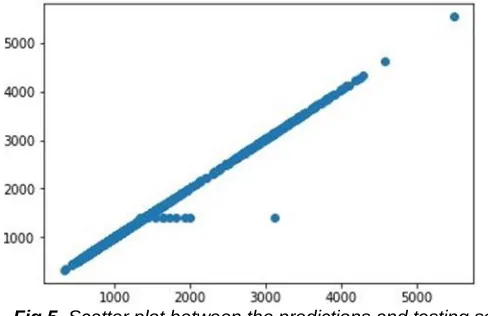
Step7: The scatter plots are plotted between predicted and testing data for the applied models and the errors are compared and best model among them is selected.
Step8: Display the results
4
EXPERIMENTAL
RESULTS
Fig 2. Histograms of the rainfall data monthly, annual and consecutive of three months
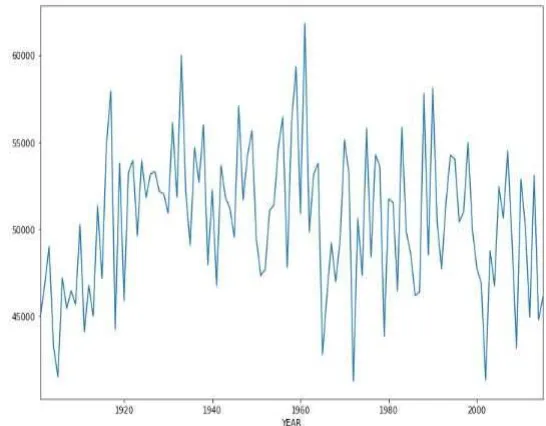
The below plot is the line graph for the amount of rainfall over the years and it is detected that there was a high volume of rainfall in 1950s.
Fig 3. Line graph for distribution of rainfall from the year
1901-2015.
The below bar graph shows the amount of rainfall for all months in the subdivisions and it is observed that the volume of rainfall is sensibly good in Eastern India in the months of March, April, May.
Fig 4. Bar graphs for the amount of rainfall in all subdivisions,
monthly
Fig 5. Scatter plot between the predictions and testing set
Table 1 Comparative results
Prediction Model Mean Absolute Error R2 score Multiple Linear
Regression
10.95375724150944 0.995778395500872
Support Vector Regression
4.3506984199111525 0.995899174760731
Lasso Regression 11.716073498072355 0.995750795102249
Then, for each regression model the MAE and r2 score are calculated and compared and a graph is plotted.
Fig 6. Comparison among applied models
5
CONCLUSION
This project concentrated on estimation of rainfall and it is estimated that SVR is a valuable and adaptable strategy, helping the client to manage the impediments relating to distributional properties of fundamental factors, geometry of the information and the normal issue of model over fitting. The decision of bit capacity is basic for SVR displaying. We prescribe tenderfoots to utilize straight and RBF piece for direct and non-straight relationship individually. We see that SVR is better than MLR as an expectation strategy. MLR can't catch the non-linearity in a data set and SVR winds up helpful in such circumstances. We additionally process Mean
Absolute Error (MAE) for both MLR and SVR models to assess execution of the models. At last, we look at the presentation of SLR, SVR and tuned SVR model. True to form, the tuned SVR model gives the best expectation.
REFERENCES
[1] Thirumalai, Chandrasegar, et al. "Heuristic prediction of rainfall using machine learning techniques." 2017 International Conference on Trends in Electronics and Informatics (ICEI). IEEE, 2017.
[2] Geetha, A., and G. M. Nasira. "Data mining for meteorological applications: Decision trees for modeling rainfall prediction." 2014 IEEE International Conference on Computational Intelligence and Computing Research. IEEE, 2014
[3] Parmar, Aakash, Kinjal Mistree, and Mithila Sompura. "Machine learning techniques for rainfall prediction: A review." 2017 International Conference on Innovations in information Embedded and Communication Systems. 2017.
[4] Dash, Yajnaseni, Saroj K. Mishra, and Bijaya K. Panigrahi. "Rainfall prediction for the Kerala state of India using artificial intelligence approaches." Computers & Electrical Engineering 70 (2018): 66-73.
[5] Singh, Gurpreet, and Deepak Kumar. "Hybrid Prediction Models for Rainfall Forecasting." 2019 9th International Conference on Cloud Computing, Data Science & Engineering (Confluence). IEEE, 2019.
[6] Kar, Kaveri, Neelima Thakur, and Prerika Sanghvi. "Prediction of Rainfall Using Fuzzy Dataset." (2019). [7] Sardeshpande, Kaushik D., and Vijaya R. Thool. "Rainfall
Prediction: A Comparative Study of Neural Network Architectures." Emerging Technologies in Data Mining and Information Security. Springer, Singapore, 2019. 19-28. [8] Chen, Binghong, et al. "Non-Linear Machine Learning
Approach to Short-Term Precipitation Forecasting." (2018).
[9] Moon, Seung-Hyun, et al. "Application of machine learning to an early warning system for very short-term heavy rainfall.―Journal of hydrology 568 (2019): 1042-1054. [10]
https://data.gov.in/resources/subdivision-wise-rainfall-and-its-departure-1901-2015