1896
An Efficient Energy Based Data Gathering
Scheme For Increasing Network Lifetime In Wsn
Ms. A. Mahalakshmi, C. Kalpana, E. Saranya, M. Sudha & Dr. S. GopinathAbstract: Wireless Sensor Network plays a vital role for data gathering and monitoring purposes. It consists of several sensor nodes wh ich are randomly deployed in the network. Data gathering is a major concern where as to enhance the network lifetime. In the proposed research work, Energy Efficient Data Gathering Scheme (EEDGS) is introduced to provide balance between data collection and energy management among sensor nodes. Initially the sensor nodes are divided into two categories i.e. vital and non vital nodes. It is based on the estimation data creation speed and remaining energy of individual sensor nodes. Relay nodes are located near the anchor node to collect the data effectively. Data gatheri ng algorithm provides the procedure to attain more data collection rate by adopting non vital node in the cluster region. From the energy model, the consumption of energy at transmitter and receiver is estimated to manage power among sensor nodes during dynamic scenario. Simulati on results are performed in terms of packet delivery ratio, end to end delay, data collection rate, energy efficiency and network reliability using network simulator tool.
Index Terms: WSN, Clustering, Vital nodes, Energy model, Relay nodes, data collection rate and network reliability rate. —————————— ——————————
1
INTRODUCTION
Wireless Sensor Networks (WSN) consists of several sensor nodes which are located as static or dynamic mode. In several cases, nodes are located as static which collects more data than dynamic nodes. During data gathering, information may be lost due to path breakage during the presence of dynamic node. To avoid such cases, relay nodes are fixed to get the data from dynamic node and forward it to sink node to ensure data gathering effectively. In the concept of spatial temporal correlation method introduced by Ying Zhou et.al [1] for increasing data gathering and energy efficiency in WSN. Both dual prediction and hybrid compressed sensing technique were used to increase network lifetime by eliminating the redundancy. The concept of identifying new error threshold mechanism was adopted to optimize the balance between energy efficiency and error recovery accuracy. The cluster head collects all the values for the reconstruction of cluster if it collapses unexpectedly. In the concept of delay tolerant sensor data gathering approach [2] introduced to reduce the energy consumption during packet transmission. The optimal sensor nodes transmission and unaided aerial vehicle trajectory process were designed to improve data gathering. Three possible modes were introduced which includes waiting state, transmission state and uploading state. These states are used to improve the lifecycle of node and network lifetime. The UAV was used to enable the shorter distance of sensor node to reduce the transmission power consumption. In the proposed scheme, energy efficient data gathering scheme is introduced to improve data collection among sensor nodes in the clustered environment. Energy model is also proposed to attain maximum lifetime.
2 LITERATURE REVIEW
D Runze Wan et.al [3] developed the data aggregation method using fuzzy c means approach to investigate the spatial temporal correlation and local detection of events. The degree function was also defined for outlier free sensor data. From this the reading aggregation was conducted. The accurate fusion results were also identified from this method. The theoretical analysis was obtained to determine the cluster formation. In [4], authors proposed multi-hop vitality enhancement protocol for providing data collection by bunching the sensing element gland into radical using energy efficient basic routing protocol. The sensor nodes are arranged into small clusters. The high residual vigor sensor nodes are sensing its target and the specific information about nodes was forwarded to CH. Two phases were involved in this scheme i.e. steady phase and apparatus phase. During this phase, the requested message was sent to sink node and sensor nodes join the cluster by declaring the acceptance request to CH. In [5], a secure data gathering approach was introduced to reduce the overhead by introducing the new hash based authentication scheme. A strong message authentication code was generated to deliver both authenticity and integrity of a message. The signature of the packet is verified by each sensor node to reduce overhead before message transmission begins. The security for data gathering was provided by the exchange of pre-shared key exchange. Hager Ramadan et.al [6] introduced both centralized and distributed routing protocols to provide effective data gathering in distributed wireless sensor networks. The mobility of dynamic sink nodes was controlled by static sink nodes in the centralized protocols. Each dynamic sink node was answerable for data collection in specific region in the distributed protocol. Vijayashree and Suresh [7] explored a new novel optimization issue for energy management for energy constrained mobile sinks. Authors proposed an Artificial Bee Colony based mobile sink movement algorithm to balance workload and energy management among sensor nodes. The dynamic sink path is optimized to solve the problem in the selection of cluster head. The shortest path of mobile sink was deployed to increase the data collection efficiency. Guorui Li [8] developed a collaborative data collection procedure based on optimal data clustering method _________________________________
Assistant Professor, Department of IT, Karpagam Institute of
Technology, Coimbatore, India E-mail:
• Assistant Professor, Department of CSE, Karpagam Institute of
Technology, Coimbatore, India E-mail:
• Assistant Professor, Department of IT, Karpagam Institute of
Technology, Coimbatore, India E-mail:
• Assistant Professor, Department of IT, Karpagam Institute of
Technology, Coimbatore, India E-mail:
1897
to improve data collection efficiency in sensor networks. There are two data collection steps involved i.e. intra and inter data collection process to evaluate energy consumption and provide the solutions for identifying cluster size and data transmission radius. Including this, CH link algorithm was also proposed by the authors using Hilbert curve method. Sujitha and Venkatesan [9] developed an energy efficient data algorithm using genetic algorithm to improve network lifetime which includes steady state phase and setup phase. In this phases, both cluster formation and network load reduction were achieved by data aggregation via multi-hop fashion. By deploying cluster method, the network lifetime was improved while making relay node to save energy. Deepa et.al [10] proposed both energy efficient and reliable data collection method to provide high reliability and more network lifetime of sensor networks. In the presence of mobile network environment, signal strength of each sensor node is measured and enhanced with Advanced Encryption Scheme (AES) to overcome the sink node attack. The reliability and security was provided by adopting grouping shares with encryption scheme. Chi-Chang Chen [11] identifying the problem of uneven power consumption problem for data collection in sensor networks. Author combined both scalable hierarchical cluster transmission method and wireless recharge plan for data collection. The mobile wireless chargers were placed to recharge the sensor battery by placing on various levels of node Gosper curves. The feasibility of recharge plan was provided by calculating the duration of each recharging process. Kuniyasu and Shigeyasu [12] discussed the data communication strategy for adequate forwarding route from the candidate route. The distribute path finding approach was developed to improve the performance based on the status of all wireless links in the forward path. The forwarder chose the route based on the contents present in the relay nodes. Balakrishnan et.al [13] proposed Balanced Energy Allocation Scheme (BEAS) to balance the energy among all sensor nodes. The concept of Distributed sensing rate and routing control algorithm was introduced to choose the best energy path to transmit energy without much loss. All sensor nodes are adjusting its sensing rate based on the energy. The forwarder list was introduced based on distance and remaining energy of sensor node.
3 SECTIONS
In the hybrid topology based data gathering protocol, sensor nodes are randomly in the network based on the signal strength and its mobility. Here anchor sensor nodes and dynamic sink nodes are located within the communication range. The anchor node is placed statistically at the centre of cluster near the Cluster Head (CH). The packet loss may occur due to insufficient storage of node. To avoid this, CH allocate storage space to all node which are equally assigned based on data gathering and stability of node. Once nodes are assigned, CH establishes multi-hop routing to balance energy management and data gathering by adopting alternative route establishment. Multi-hop routes are discovered by sending MJReq packets to CH. Based on vital node and relay nodes, data collection can be improved by establishing selective path towards sink node.
Dividing of Sensor nodes in Cluster region:
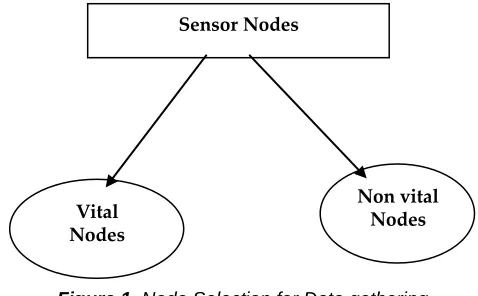
CH authenticates nodes which may be static or dynamic by verifying its identity and history of node participation. Sensor nodes are divided into two categories i.e. vital node and non vital node based on its remaining energy
E
RE , data creation speed
D
CS
, minimum threshold value of residual energy
ME
RE
and maximum threshold value of date creationspeed
MD
CS
. If node has highMD
CSand leastE
RE, it is known as vital node otherwise it is called as non vital node. The selection of sensor nodes is depicted in Figure 1.Figure 1. Node Selection for Data gathering
Positioning of Relay node near Anchor sensor node
In this phase, two layer cluster network is formed based on location of relay node near anchor sensor node in the upper layer and vital node located in the bottom layer. Let A be the anchor node,
v
v
v
m
V
1,
2,...
be the set of vital nodes.
nv
n
nv
m
NV
1,
2,...
be the set of non vital nodes and
rn
rn
rn
m
RN
1,
2,...
be the set of relay nodes.In the data sensing field, sensor nodes are densely located and relay sensor nodes are randomly placed. Here the data collection is done by the joint support of relay and sensor nodes. In the cluster region, data gathering is improved by mobile cluster member and nearby relay nodes. The major concern is to select the relay node with high remaining energy which is capable of forwarding and collecting data to anchor nodes. Let it assumes that the vital node directs their data packets to relay nodes whereas it forwards to anchor node. During this interval, relay nodes keep on charging its battery. By positioning these relay nodes, data loss can be easily reduced through multi-hop routing. The role of multi-hop routes is to support data gathering through multiple sensor and relay nodes.
Data Collection Phase
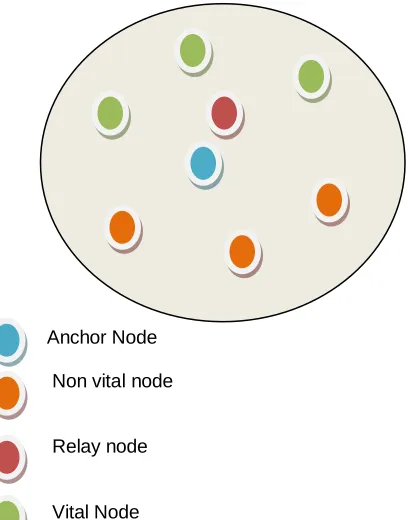
In this phase, the data collection is improved if dynamic sink nodes are moving with minimum distance in stable period. In the previous phase, data collection is done by positioning relay nodes near the anchor nodes. In this phase, data collection is improved by positioning of dynamic sink nodes in the optimal location near non vital nodes in bottom layer. In figure 2, the distribution of nodes towards data gathering illustrated. Vital nodes are located in top layer whereas non vital nodes are placed in the bottom layer. Relay nodes are located near the anchor node to perform data collection to forward data from vital or non vital nodes based on distance and remaining
Sensor Nodes
Vital Nodes
1898
energy. The following steps are used to improve the data collection. Before that, CH must calculate the flooding time for data gathering within the threshold value.
Step 1:
Deploy the sensor nodes randomly and locate the anchor node at the centre of cluster region.
Step 2:
The flooding time is computed for each sensor to identify packet flooding in the multi-hop routes.
Step 3:
Assign all sensor nodes as a specific group based on flooding time.
Step 4:
Allot one dynamic sink node in each group based on its stability and capacity.
Step 5:
Actively participate in route maintenance by vital and non vital nodes.
Step 6:
Find the identity of sensor nodes communicating with non vital nodes.
Step 7:
Forward the data from non vital node to CH via primary hop routes having high link capacity.
Step 8:
Determine the resultant metric based on node stability and waiting period for data collection.
Step 9:
Reposition the dynamic sensor node having high resultant metric near to the non vital node to collect data.
Anchor Node
Non vital node
Relay node
Vital Node
Figure 2. Distribution of Node in Cluster
Energy consumption Model:
The energy consumption model [10] is used in our data gathering approach during packet transmission and reception.
The dynamic sensor node sends
m
bbits of message to anchor node at the distance d by the following equation:
m
,
d
E
m
E
m
d
2E
T b
el
b
amp
b
At receiver side, the energy received for the same message is given by,
b el bR
m
E
m
E
In order to run the transmitter or receiver circuitry, dissipation energy and energy consumption by the transmitter amplifier must be calculated to transmit the data.
Packet Format of EEDGS
The propose packet format of EEDGS is shown in Figure 3. The information packet contains the following fields i.e. source and sink ID, node position, residual energy, hop count and cyclic redundancy check. Node location determines position of vital, non vial and relay nodes. The residual energy indicates the remaining energy of node after packet transmission. Hop count determines number of hops from the anchor node. CRC provides error detection and error correction.
Source and
Sink ID Node position
Residual
energy Hop count C RC 4 2 2 1 4
Figure 3. EEDGS information packet
4 SIMULATION RESULTS AND ANALYSIS
Network Simulator (NS 2.34) is used in the simulation analysis of our proposed scheme. Table 1 shows the simulation settings of EEDGS. The basis routing protocol used in the scheme is LEACH protocol for energy balancing and it will support maximum data gathering.
Performance Metrics of EEDGS
The proposed protocol EEDGS is simulated based on the following performance metrics. Packet delivery ratio: It is defined as the ratio of packet delivered to the packet sent with respect to percentage.
Network Reliability Rate: It is defined as the rate of longer period of stability of node to shorter period of instability of node.
Energy efficiency: It is defined as the energy spent per node to the total available energy with respect to percentage. End to end delay: It is the average delay survived from source to destination in multi-hop route.
Data collection rate: It defines the collected data from the vital nodes and non vital nodes through relay nodes towards dynamic sink node.
Table 1. EEDGA Network Simulator Settings
No. of Nodes 100
Area Size 1100 x 1100 Sq.m
Mac 802.15.4
Radio Range 100 meter
Simulation Time 100 sec
Traffic Source Variable
1899
Package rate 5 pkt/s
Protocol LEACH
EEDGS is compared with CDCS [8] and EERDC [10] in terms of above performance metrics. Figure 4 shows the Energy efficiency of EEDGS. It achieves high energy efficiency than existing schemes.
Figure 4. Energy efficiency Vs No. of Vital nodes.
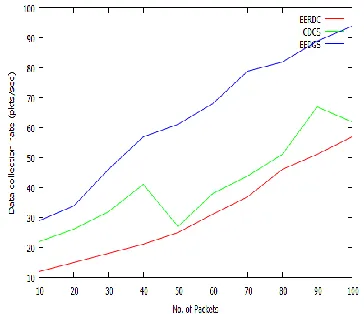
Figure 5. Data Collection rate Vs No. of Packets
Figure 5 illustrates the comparison of data collection rate with respect to number of packets. Based on the results, EEDGS achieves more data collection rate due to positioning of relay nodes near anchor nodes.
Figure 6. Packet delivery ratio Vs No. of non vital nodes
Figure 6 illustrates the performance of packet delivery ratio while varying number of non vital nodes from 0 to 50. From the results, it is clearly shown EEDGS achieves more packet delivery ratio.
Figure 7 shows the results of end to end delay while varying number of vital nodes. From the results, EEDGS achieves less delay compared to CDCS and EERDC.
Figure 8 presents the results of network reliability rate. From the results, EEDGS achieves high reliability than existing schemes.
Figure 7. End to end delay Vs No. of vital nodes
Figure 8. Network reliability Vs No. of relay nodes
4
CONCLUSION
1900
group shares to ensure data integrity during data gathering phase.
5 REFERENCES
[1] Ying Zhou, Lihua Yang, Longxiang Yang and Meng Ni, “Novel Energy-Efficient Data Gathering Scheme Exploiting Spatial-Temporal Correlation for Wireless Sensor Networks”, Wireless Communication and Mobile Computing, pp.1-11, 2019.
[2] Bin Liu and Hongbo Zhu, “Energy-Effective Data Gathering for UAV-Aided Wireless Sensor Networks”, Sensors, vol.19, pp.1-12, 2019.
[3] Runze Wan, Naixue Xiong, Qinghui Hu, Haijun Wang and Jun Shang, “Similarity-aware data aggregation using fuzzy c-means approach for wireless sensor networks”, EURASIP Journal on Wireless Communications and Networking, Springer, vol.59, pp.1-11, 2019.
[4] D. Jayakumar and S. Samundeeswari, “ Multi-hop Vitality Enhancement Protocols for Data Collecting in WSN”, International Journal of Innovative Technology and Exploring Engineering, vol.8, no.8, pp.1011-1014, 2019.
[5] Michael Roseline Juliana and Subramaniam Srinivasan, “A Secure Data-gathering Approach in Wireless Sensor Networks”, ISACA Journal, vol.3, pp.1-5, 2019.
[6] Hager Ramadan, Ahmed M. Khedr, Dharma P. Agrawal, “ Effective data routing using mobile sinks in disjoint mobile wireless sensor networks”, Periodicals of Engineering and Natural Sciences, vol. 7, no. 1, pp.82-98, 2019.
[7] R. Vijayashree and C. Suresh Ghana Dhas, “Energy efficient data collection with multiple mobile sink using artificial bee colony algorithm in large-scale WSN”, Automatika, Journal for Control, Measurement, Electronics, Computing and Communications, vol.60, no.5, pp.555-563, 2019.
[8] Guorui Li , Haobo Chen , Sancheng Peng , Xinguang Li, Cong Wang, Shui Yu and Pengfei Yin, “A Collaborative Data Collection Scheme Based on Optimal Clustering for Wireless Sensor Networks”, Sensors, vol.18, pp.1-19, 2018.
[9] T. Sujithra and R. Venkatesan, “Genetic Algorithm based Energy Efficient Data Gathering in Wireless Sensor Networks”, International Journal of Applied Information Systems, vol.11, no.2, pp.1-7, 2016. [10]Deepa Puneeth, Nishanth Joshi, Pradeep Kumar
Atrey, Muralidhar Kulkarni, “Energy-efficient and reliable data collection in wireless sensor networks”, Turkish Journal of Electrical Engineering & Computer Sciences, vol.26, pp.138-149, 2016.
[11]Chi-Chang Chen, “A Novel Data Collection Method with Recharge Plan for Rechargeable Wireless Sensor Networks”, Wireless Communications and Mobile Computing, pp.1-19, 2018.
[12]Tetsuro Kuniyasu and Tetsuya Shigeyasu, “Data-centric communication strategy for wireless sensor networks”, Int. J. Space-Based and Situated Computing, vol. 8, no. 1, pp.30-39, 2018.
[13]S.Balakrishnan, J.P.Ananth, L.Ramanathan and S.P.Premnath, “An Adaptive Energy Efficient Data Gathering In Wireless Sensor Networks”, International