United Kingdom Vol. VI, Issue 5, May 2018
Licensed under Creative Common Page 151
http://ijecm.co.uk/
ISSN 2348 0386
THE INFLUENCE OF ORGANIZATIONAL CULTURE ON
ORGANIZATIONAL COMMITMENT AND JOB SATISFACTION
Soryani
Magister Program in Management, University EsaUnggul, Tangerang, Indonesia yaniepamungkas11@gmail.com
T. Y. R. Syah
Magister Program in Management, University EsaUnggul, Tangerang, Indonesia
Pujo Raras
University of Persada Indonesia, Indonesia
Abstract
The aims of this study were to determine: 1) the influence of organizational culture on
organizational commitment to the employees; 2) the influence of organizational culture on job
satisfaction to the employees; 3) the influence of job satisfaction on organizational commitment.
This study used causal research method. The populations of this study were all permanent
employees. In the research questionnaire, there were 30 questions and the number of
respondents was 155 permanent employees. The findings of this study suggest that
organizational culture was very influential on organizational commitment. From the findings, it was
known that the strongest indicator that formed organizational culture was when the culture was
able to reach the lowest level; in this case, staff and all organizational components run it without
any coercion. The findings of this study also proven that organizational culture had an influence
on job satisfaction. From the findings of the study, it is noted that the strongest indicator that
formed the organizational culture was the comfortable feeling of all employees to the appreciation
and positive cultures that can provide space for them to work optimally. In addition, job satisfaction
had no influence on organizational commitment. Further, it is noted that the existing indicators did
not interpret a strong relationship between job satisfaction and organizational commitment.
Licensed under Creative Common Page 152 INTRODUCTION
The ability of a company or organization to grow and develop depends on various aspects of the
advantages it has in order to achieve these goals. An organization or company is in need of human resources. With a large amount of human resources, if it is used effectively and
efficiently, it will be useful to support the pace of sustainable national development. The abundance of the existing human resources requires us to think carefully how to utilize human
resources optimally.
Human resources are the only resource that has reason and skill. All potential human
resources influence the organization's efforts in achieving a goal. According to Gaol (2014), human being is the most important resource of an organization. Gaol (2014) stated that Human
Resources (HR) are people, individuals, and groups that help organizations produce goods or services. Having human resources that are able to contribute optimally to the organization is a hope that is sometimes quite difficult to meet. It should become a motivation for the organization
in making efforts to retain employees who have been and are predicted able to make a
meaningful contribution to the organization. According to Gaol (2014), human being provides talent, expertise, knowledge, and experience to achieve the goals of the organization.
Every organization or company must be able to manage, organize and embrace its
human resources as well as possible. Human resources, whom are the key in determining the success or failure of organizational goals, have thoughts, feelings and desires that can affect
organizational commitment. Every employee working within an organization should have a work commitment because if there is no organizational commitment, the goals of the company or
organization will not be achieved and employee loyalty will be reduced, (Dubkevics et al, 2010). Organizational commitment is important to an organization. Darwish (2000) stated that high
organizational commitment will make employees feel compelled to live in the organization; feelings resulting from the internalization of normative pressure are given to an individual before
or after entering an organization.
The organizational culture is a characteristic that is highly regarded by the organization and a role model for differentiation between one organization and another. Organizational
culture is also defined as the values and norms of behavior that are accepted and shared by members of the organization as a basis in the rules of conduct within the organization.
According to Daft (2010), all organizations emerge for a purpose. An organization needs a culture that suits the organization's situation. By having appropriate culture, members can easily
Licensed under Creative Common Page 153
with high organizational commitment are more stable and productive, which in turn will benefit the organization or the company.
In addition to organizational culture, other factors affecting organizational commitment are job satisfaction. Robbins and Judge (2001) mentioned that job satisfaction is an individual
thing about one's feelings toward one's work. Job satisfaction influences employee performance. Employees who are satisfied with their work will have high productivity. According
to Tenggara &Suyasa. (2008), job satisfaction is also negatively related to employee turnover and absenteeism.
Organizational commitment is one of the consequences of job satisfaction. In an industry, job satisfaction is part of internal marketing, meaning that management firstly must be
able to give satisfaction to its employees, (Castillo and Cano, 2004). Employees who are satisfied with their work will certainly be able to provide the best service to its customers. Alvi et al. (2014) stated that the long-term sustainable success of the company depends on job
satisfaction and employee commitment to the company. There are many types of industries and
one of them is the garment industry. In this study, the object under study is the permanent employees of PT. Hari Mau Indah on the sewing department.
Research Problem
The problems of the research are: 1) how the influence of organizational culture on
organizational commitment to the employees of PT. Hari Mau Indah is; 2) how the influence of organizational culture on job satisfaction to the employees of PT. Hari Mau Indah is; 3) how the
influence of job satisfaction on organizational commitment at PT. Hari Mau Indah is.
Research Objectives
Based on the above research problems, the purposes of this study are to determine: 1) the
influence of organizational culture on organizational commitment to the employees of PT. Hari Mau Indah; 2) the influence of organizational culture on job satisfaction on the employees of PT. Hari Mau Indah; 3) the influence of job satisfaction on organizational commitment at PT. Hari
Mau Indah.
Conceptual Framework of the Research
The conceptual framework of this study will look at the influence of organizational culture on
organizational commitment and job satisfaction, and then look at the influence of job satisfaction on organizational commitment. Organizational culture is a system shared jointly by its members,
Licensed under Creative Common Page 154
2016). Organizational culture has a strong relationship to organizational commitment. It can be seen from how members of the organization run the provisions made by the organization. If an
organization is well-organized in which the leader is responsible for his or her authority, then the members will be certainly committed to the organization, (Lim, 2003).
Job satisfaction is also an early sign of organizational commitment (Lund, 2003). Organizational commitment will grow if work expectations are met by the organization. With the
fulfillment of such work expectations, it will bring a sense of job satisfaction. It is clear that job satisfaction has a strong relationship with organizational commitment. Job satisfaction has a
positive influence on organizational commitment. It means that the greater job satisfaction perceived by employees then the organization's commitment is also higher. In other words, if
job satisfaction of the employee increases then organizational commitment of the employee will also increase, (Naves, 2003). There is a reciprocal relationship from the side of job satisfaction with organizational commitment. Based on the description above, conceptual framework model
of the study can be described as in Figure 1 below.
Figure 1. Conceptual Framework of the Research
Hypotheses
Based on the above conceptual framework, the hypotheses are formulated as follows:
H1: High organizational culture will increase organizational commitment. H2: High organizational culture will increase job satisfaction.
H3: High job satisfaction will increase organizational commitment.
RESEARCH METHOD
Research Design
Based on the problems to be discussed in this study, the design is a causal design. According
to Umar (2008), study with causal design is a study that aims to analyze the relationship between one variable with other variables. The characteristic of possible relationships between
the variables is symmetrical, asymmetric and reciprocal.
Organizational Commitment
Licensed under Creative Common Page 155 Data Sources and Types
Data is information about a fact or an empirical phenomenon in which its form can be a set of
measures and numbers (quantitative) or in the form of words (verbalize) or qualitative. This study used primary data and secondary data. Primary data is the type of data that is obtained
directly from the source, either through interviews or questionnaires. The data were obtained from the answers of the respondents who are permanent employees who work at sewing
department of PT. Hari Mau Indah. Secondary data is the type of data that has been collected in advance by related parties, among others, previous studies and literature.
Data Collection Technique
In this study, the data were obtained by using questionnaire. Questionnaire is a number of written questions that is used to obtain information from respondents; in this case, reports of their personalities or things they know (Arikunto, 2010). Questionnaire is designed in such a
way so that all respondents are expected to answer all questions. The questionnaire is
distributed along with letters of application for questionnaires and explanations of matters relating to the research. The scale used in the questionnaire is the Likertscale using multi-level answers in five categories ranging from strongly disagree to strongly agree.
Population and Sample
In this study, the population was all permanent employees who work at sewing department of PT. Hari Mau Indah. Based on the analysis tool that will be used, in this case the Structural
Equation Model (SEM), the determination of the minimum sample size must be representative. According to Hair et al (2008), the sample should amount to five times the number of the
questions that will be analyzed. This research questionnaire had 30 questions. Thus, the minimum required sample size was 150 respondents. In this study, the number of respondents
was 155 permanent employees at sewing department of PT. Hari Mau Indah which used five questionnaires as a backup in case of damage or loss.
Structural Equation Model (SEM)
The test of the research model was conducted by using Structural Equation Modeling (SEM),
also known as Analysis of Moment Structures using Lisrel. This statistical analysis was used to estimate several separate but simultaneously related regressions. Unlike regression analysis,
SEM can have several dependent variables and these dependent variables can be an independent variable for other dependent variables. According to Hair et al. (2008), SEM is a
Licensed under Creative Common Page 156
test for dependent relationships) and factor analysis (which presents unmeasured concepts factors with multiple variables) that can be used to simultaneously estimate a series of
interdependent dependent relationships.
Data processing technique using structural equation modeling (SEM) with confirmatory
factor analysis (CFA) method was used in this research. These observed variables (indicators) represented a particular latent variable (latent dimension). It was a testing method that
combines analysis factors, path analysis and regression. SEM is more of a confirmatory than explanatory method which aims to evaluate the proposed dimension and the dimension from the
previous studies. By this understanding, SEM can be used as a tool to confirm pre-knowledge that has been previously obtained.
Table 1. Goodness of Fit to the Structural Model
No GOF MEASURE ACCEPTABLE GOODNESS OF FIT
1 NCF The scores ranged from 1-3 (close fit) and 3-5 (good fit) Confidence Interval 90%, NCP ranged from 29.983-98.953
2 RMSEA ≤ 0.08 (good fit), RMSEA < 0.05 (close fit)
3 ECVI Model was close to ECVI saturated that showed good fit 4 AIC Model was close to AIC saturated that showed good fit
CAIC Model was close to CAIC Saturated that showed good fit 5 NFI > 0.90 (good fit), 0.80 < NFI < 0.90 (marginal fit)
CFI > 0.90 (good fit), 0.80 < CFI < 0.90 (marginal fit) NNFI > 0.90 (good fit), 0.80 < NNFI < 0.90 (marginal fit) IFI > 0.90 (good fit), 0.80 < IFI < 0.90 (marginal fit) High scores showed good fit
RFI > 0.90 (good fit), 0.80 < RFI < 0.90 (marginal fit) 6 CN > 200 showed good fit or an acceptable fit level 7 Standartized RMR RMR < 0.05 was good fit
GFI > 0.90 (good fit), 0.80 < GFI < 0.90 (marginal fit) AGFI > 0.90 (good fit), 0.80 < AGFI < 0.90 (marginal fit)
PGFI score ranged from 0 to 1, higher score showed good fit model
FINDINGS
Descriptive Statistics
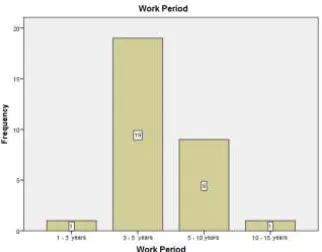
The respondents were classified by sex, age, educational background, marital status and work
Licensed under Creative Common Page 157
formation of demography were to: 1) study the quantity and distribution of respondents in a particular population; 2) explain the growth of respondents in the past; its decline and
distribution as well as possible by using available data; 3) develop a causal relationship between the development of the respondent with various other aspects.
Furthermore, the authors did the mapping using pie chart to visually see the respondents of this study in order to see the advantages and disadvantages of this study. The complete
visualization is in Figure 2-6.
Figure 2. Distribution of Respondents by Sex
Figure 3: Distribution of Respondents by Marital Status
Licensed under Creative Common Page 158
Figure 5: Distribution of Respondents by Educational Background
Figure 6: Distribution of Respondents by Age
One of the advantages of SEM, compared to other regression and multivariate methods, is the
application of SEM procedures performed simultaneously to a hybrid/ full SEM model (a
combination of measurement model and structural model). Data analysis techniques using Structural Equation Modeling (SEM) is performed to explain thoroughly the relationship between variables existing in the study. SEM is used not to design a theory but rather to examine and
justify a model. Therefore, the main requirement of using SEM is to construct a hypothetical model consisting of a structural model and a measurement model in the form of a path diagram
based on the justification of the theory. SEM is a collection of statistical techniques that allows testing of a series of relations simultaneously. The relationship is built between one or several
Licensed under Creative Common Page 159 Structural Model Analysis
It is a model that describes the data structures used in business processes. During the analysis,
the structural model presents the logic of the data without showing how data is stored, created, or manipulated so that the analyst can focus on the business. The structural model presents an
idea of the concept that exists in the problem domain and presents the relationships. The structural model is a model of relationship structure that forms or explains causality between
factors. This research performs testing of structural model to determine the relationship between research variables. A hypothesis can be accepted or considered as significant if the value of t ≥
1.96. The following is the result of calculation of causality between each research variable.
Figure 7. Structural Equation Model - Estimation
Licensed under Creative Common Page 160
Figure 9: Structural Equation Model - t Value
Furthermore, from 5-8, 5-9 and 5-10 figures, the researcher tabulated the data as a result of the research hypothesis, can be seen in Table 2.
Table 2. Result of Research Hypothesis
The Relationship
of Variables Estimation Loading Factor
t Value
(>1,96) Conclusion
OCL OCM 0.70 0.70 7.25 Significant
OC JS 0.22 0.22 3.07 Significant
JS OCM -0.26 -0.26 -4.42 Not significant
Based on the structural equation model, the t value of each relationship between latent
variables OCL OCM and OCL JS was significant, while JS OCM was not significant. Next, a goodness of fit test was conducted to assess whether the data were fit and match the
model. There were three types of measures to test whether the SEM model as a whole fit into good fit data. Sizes and values were described in Table 3.
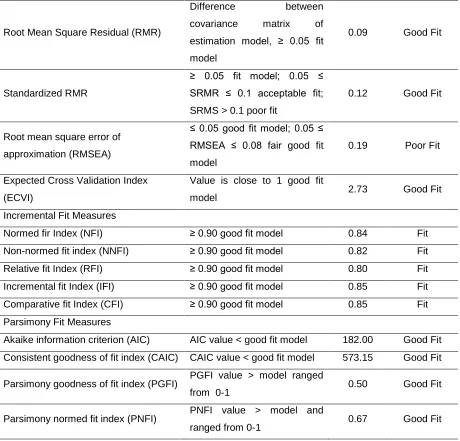
Table 3. Structural Model Matching Test Goodness of Fit
Measure Description Value Conclusion
Absolute Fit Measures
Chi square ≥ 0.05 good fit model 484.00 Good Fit
Goodness of Fit Index (GFI) ≥ 0.90 fit model, 0.80 ≤ GFI ≤
0,90 marginal fit model 0.73 Good Fit
Adjusted goodness of fit index (AGFI) ≥ 0.90 fit model, 0.80 ≤ AGFI
Licensed under Creative Common Page 161 Root Mean Square Residual (RMR)
Difference between covariance matrix of estimation model, ≥ 0.05 fit model
0.09 Good Fit
Standardized RMR
≥ 0.05 fit model; 0.05 ≤ SRMR ≤ 0.1 acceptable fit; SRMS > 0.1 poor fit
0.12 Good Fit
Root mean square error of approximation (RMSEA)
≤ 0.05 good fit model; 0.05 ≤ RMSEA ≤ 0.08 fair good fit model
0.19 Poor Fit
Expected Cross Validation Index (ECVI)
Value is close to 1 good fit
model 2.73 Good Fit
Incremental Fit Measures
Normed fir Index (NFI) ≥ 0.90 good fit model 0.84 Fit Non-normed fit index (NNFI) ≥ 0.90 good fit model 0.82 Fit Relative fit Index (RFI) ≥ 0.90 good fit model 0.80 Fit Incremental fit Index (IFI) ≥ 0.90 good fit model 0.85 Fit Comparative fit Index (CFI) ≥ 0.90 good fit model 0.85 Fit Parsimony Fit Measures
Akaike information criterion (AIC) AIC value < good fit model 182.00 Good Fit Consistent goodness of fit index (CAIC) CAIC value < good fit model 573.15 Good Fit
Parsimony goodness of fit index (PGFI) PGFI value > model ranged
from 0-1 0.50 Good Fit
Parsimony normed fit index (PNFI) PNFI value > model and
ranged from 0-1 0.67 Good Fit
From Table 3 of the structural model fit test, it can be concluded that the overall models were
considered as good or good fit and there were good fit from each measure indicator in three groups.
Hypothesis Testing
In this study, there were three hypotheses. Hypothesis testing was performed with a significance level of 5% resulting in a critical t value. The hypothesis is accepted when the value
of t is greater than or equal to 1.96 and the hypothesis is rejected if the value of t is smaller than or equal to 1.96. Based on the t value, hypothesis test was performed to see if the proposed model was supported by the data.
Licensed under Creative Common Page 162
Table 4. t-Value and Structural Equation Coefficient
Hypotheses Path t Value
(t ≥1,96) Conclusion
H1 High organizational culture can
improve organizational commitment 7.25
The data supported the hypothesis
H2 High organizational culture can
improve job satisfaction 3.07
The data supported the hypothesis
H3 High job satisfaction can improve
organizational commitment -4.42
The data did not support the hypothesis
DISCUSSIONS
Organizational Culture Improves Organizational Commitment
Based on the results of the analysis, it supported the hypothesis 1 (H1). From the calculation result, it was known that organizational culture had a positive relationship to organizational commitment with a value of 7.25; greater than the default value of 1.96. The findings of this
study supported the first hypothesis which meant that H1 is accepted; i.e. there was a positive relationship between organizational culture and organizational commitment. The result of the
analysis showed that organizational culture on hypothesis testing was proved to be acceptable significantly. Thus, it could be concluded that there was a positive relationship between
organizational culture and organizational commitment.
Organizational Culture Improves Job Satisfaction
Based on the results of data processing, the findings of this study supported the second
hypothesis which meant that H2 was accepted. From the data that had been processed by the researcher, the calculation results in Table 4 noted that the organizational culture had a value
above the standard value; the t value was greater than the standard value. The value generated in this study was amounted to 3.07 which were greater than the default value of 1.96. It showed
that organizational culture had a significant effect on employee satisfaction. In other words, better organizational culture will have a positive impact on employee performance and job satisfaction.
Job Satisfaction does not Improve Organizational Commitment
Based on the results of the analysis test in table 4, it was described that the third hypothesis or H3 was rejected. High job satisfaction did not increase organizational commitment. Based on
Licensed under Creative Common Page 163
that it had negative and insignificant relationship to job satisfaction; with a value of t = -4.42 which was much smaller than the standard t value of 1.96. It explained that strong job
satisfaction did not influence organizational commitment.
MANAGERIAL IMPLICATIONS
The implication, according to a large Indonesian dictionary, is engagement and managerial is a
skill that every leader needs. Thus, managerial implications mean a participatory decision-making process in a good managerial organization. In this case, the implications will be
described with the program and the operationalization that will be carried out to give the best results as a suggestion to be considered in management so that existing gaps can be improved,
developed and increased. The program was taken from the statements of the questionnaires which then by the researcher was described and operationalized in the form of strategies in action to be done so that the program objectives can be achieved according to company
expectations of the phenomenon of this study. The findings of this study indicated that
organizational culture, organizational commitment, and job satisfaction were the main factors influencing an organization. Based on these findings, several managerial implications that can be proposed from this research are as follows:
First, the findings of this study proven that organizational culture was very influential on organizational commitment. From the research findings, it was known that the strongest
indicator that formed organizational culture was when the culture was able to reach the lowest level; in this case staff and all organizational components run their duties without any coercion.
Second, the findings of this study also proven that organizational culture had an influence on job satisfaction. From the findings of the study, it was known that the strongest
indicator that formed the organizational culture was the comfortable feeling of all employees towards the appreciation and positive cultures that could provide space for employees to work
optimally.
Third, the findings of this study proven that job satisfaction had no influence on organizational commitment. From the findings of the research, it was known that the existing
indicators did not interpret a strong relationship between job satisfaction and organizational commitment. This was questionable because job satisfaction should be one of the determinants
in improving employee productivity. The understanding of job satisfaction should be understood by the company officials in managing their human resources. All corporate activities are
ultimately highly dependent on the human resources that are in dire need of help from them. Therefore, companies must know the understanding of job satisfaction of each employee to
Licensed under Creative Common Page 164
satisfaction fulfillment on each individual, the employees will provide their best in exchange for the company in the form of high productivity. It indicated a close relationship between motivation
and job satisfaction of the employee.
Fundamentally, job satisfaction is an individual thing. It is because each individual has a
different job satisfaction indicator. The more aspects that fit with an employee in his/ her work the greater the level of job satisfaction is perceived.
CONCLUSIONS
As has been described, the problem to be reviewed in this study was how to determine the influence of organizational culture from job satisfaction and organizational commitment variables
in searching the relationship of variables under study. To answer these problems, there were three factors that were considered influencing the organizational culture, namely organizational commitment and job satisfaction.
The findings of this study proven that organizational culture influenced organizational
commitment and organizational culture also had a positive influence on job satisfaction. It means that organizational culture in a company was able to control organizational commitment and job satisfaction of the employee.
LIMITATIONS AND FURTHER RESEARCH
The researcher acknowledges that there are still many limitations in the study, such as the number of samples taken only the smallest part, only on a few people from the population in the
company or object of the study. Therefore, it is expected to further researchers to be able to develop it with better and current methods and associate the variables that have not been
discussed yet by the researcher such as relationship variable.
The addition of new variables makes this study more concrete. The variable of service
behavior mediation, which is less to be studied, can be associated with other independent variables so that service behavior becomes a variable that is easy to find and researched. The variable of service behavior partially defines the quality of service and excellent service which in
examining this variable still contains bias and is less specific.
The findings of this study indicated that job satisfaction did not improve organizational
commitment. Furthermore, the researcher expects that this can be conducted more deeply on other objects to get a real comparison of the technical matters of organizational comparison.
Differences in research findings will be a strategic consideration for decision makers or business actors of the hospital industry for things that are good to apply and improvements that do not
Licensed under Creative Common Page 165
Further research is expected to provide a more detailed description of the things causing job satisfaction did not significantly influence organizational commitment by using other variables
outside the variables that have been studied.
REFERENCES
Alvi, H. A., Hanif, M., Adil, M. S., Ahmed, R. R., & Vveinhardt, J. (2014).Impact of Organizational Culture on Organizational Commitment and Job Satisfaction Impact of Organizational Culture on Organizational Commitment and Job Satisfaction.European Journal of Business and Management, 6(27), 30–39.
Arikunto, S. (2010). Prosedur penelitian (suatu pendekatan praktik). Jakarta: Rineka Cipta.
Castillo, J. X., & Cano, J. (2004). Factors explaining job satisfaction among faculty, Journal of Agricultural Education, 45(3), 65-74.
Cronley, C. & Kim, Y. K. (2017). Intentions to turnover Testing the moderated effects of organizational culture, as mediated by job satisfaction, within the Salvation Army. Journal of Business and Management, 38(2), 194-209. Daft, R. L. (2000). Organization Theory and Design. Ohio: South – Western.
Darwish A. Y. (2000). Organizational commitment and job satisfaction as predictors of attitudes toward organizational change in a non-western setting. Personnel Review, 29(5), 567-592
Dubkevics, L., & Barbars, A. (2010). The Role of Organizational Culture in Human Resource Management. Human Resource Management and Ergonomics, IV.
Gaol, C. J. L. (2014). A to Z Human Capital Manajemen Sumber Daya Manusia. Jakarta: PT. Gramedia Widiasarana Indonesia.
Hair, J. F., Anderson, R. E., Tatham, R. L., & Black W. C. (2008). Multivariate. data analysis (5th ed.). USA: Prentice Hall International Inc.
Kim, H. N. (2016). The Relationship between and among Job Satisfaction, Training and Organizational Culture in South Korea’s Manufacturing Industry. Journal of Organizational, 135.
Lim, T. (2003). Relationships among organizational commitment, learning organization culture, and job satisfaction in one Korean private organization. Journal of Business and Management, 143.
Lund, D. B. (2003). Organizational Culture and Job Satisfaction. Journal of Business and Industrial Marketing, 18(3), 219-236.
Naves, É. M. R., Coleta, D., & Ferreira, M. (2003). Cultura e comprometimento organizacional em empresas hoteleiras. Revista de Administração Contemporânea, 7(SPE), 205-222.
Robbins, S. P., & Judge, T. A. (2001). Organizational behavior (13th Edition). London: Pearson International Edition. Santoso, S. (2011).Structural Equation Modeling (SEM) KonsepdanAplikasidengan AMOS 18. Jakarta: PT Elex Media KomputindoKompasGramedia.
Seniati, L. (2006). Komitmen organisasi : Suatu telaah teoritis dan empiris. Phronesis Jurnal Ilmiah Psikologi Industri dan Organisasi, 8(1), 1-17.
Tenggara, Z., & Suyasa, P. (2008). Kepuasan kerja dan kesejahteraan psikologis karyawan. Phronesis Jurnal Ilmiah Psikologi Industri dan Organisasi, 10(1), 96-115.