Gold-Platinum
Alloys
A CRITICAL REVIEW
OF
THEIR CONSTITUTION
AND
PROPERTIES
By A.
s.
Darling,
Ph.D., A.M.1.Mech.E. Research Laboratories, Johnson Matthey & Co. LimitedThe alloying characteristics of gold and platinum were described in 1796 by Lampadius (I) and by Morveau in 1803 (2).
Percival Norton Johnson’s first paper, pub- lished in 1812 (3), dealt with the action of
nitric acid upon platinum alloyed with gold and with silver, and dental applications involving the use of gold-platinum alloys were well established by 1845 (4). When platinum was cheap it was used as a convenient hardener for gold. At a later date gold could be regarded as a relatively cheap and corrosion resistant hardener for platinum (5). The gold-rich alloys have, for many years, been used as spinning jets for synthetic fibre production and to a lesser extent as electrical contacts.
The
Constitutional Diagram
Crude melting point determinations on the alloys were first undertaken in 1879 by Erhard and Schertel (6) and ten years later Silow (7) attempted to interpret the very meagre temperature data in terms of van’t Hoff’s recently developed theory. I n 1907
Doerinckel (8) carried out thermal analysis on six gold-rich alloys and concluded that the system comprised a continuous series of solid solutions. A more detailed study by Grigorjew, published in 1928 (9), involved cooling curves on eighteen alloys covering the range o to 61 per cent of platinum and led to the proposal of B simple peritectic type diagram. As the age-hardening Characteristics of the alloys were well known at this time, Grigorjew’s diagram appeared more plausible than that of Doerinckel.
Johansson and Linde (10) concluded in
I930 that although a continuous series of
solid solutions existed just below the solidus, decreased mutual solubility at lower tempera- tures resulted in the formation of a two-phase field which at 800°C was shown to extend from 25 to 92 atomic per cent of platinum. More precise X-ray diffraction studies by Stenzel and Weerts (11) confirmed quali- tatively the general shape of the miscibility loop. Theoretical interest aroused by the unusual nature of the system led Wictorin (12) to confirm the shape of the loop by resisto- metric methods.
Quenched samples had been used for the phase boundary determinations reported in the latter three investigations (10, 11, 12).
Further work by Wictorin (13) involved continuous resistance measurements at the actual temperature of precipitation, thus avoiding the uncertainties associated with quenched specimens. The results, published
in 1947, showed that the peak of the miscibility
loop extended to temperatures above IZOOOC. Solidus determinations, also by resistance methods, were found to be in agreement with the theoretical distances between solidus and liquidus calculated in accordance with the thermodynamic theory of H. Jones (14).
I 8 0 0
-
4 RESISTANCE MEASUREMENTS
COOLING CURVES
v MICROSCOPIC WORK
o X-RAY DATA
I 6 0 0
-
2
1400-W K 3 I-
< 0:
W
a I
F
1 2 0 0 -1000-
\
L I O U I D+
a
N
8 0 0 4 I \ I I
0 2 0 4 0 6 0 8 0 I
WEIGHT PER CENT GOLD
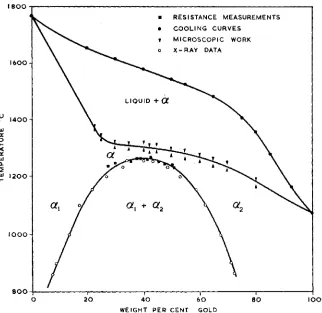
Fig. 1 Constitutional diagram of the gold-platinum system
)O
at by Grube, Schneider and Esch (16). The pronounced thermal arrests observed when heating alloys containing 10 to 70 atomic per cent of platinum led these workers to an implicit belief in the existence of a peritectic reaction at 13ooOC. The results of resistance- temperature measurements on alloys con- taining 5 to 40 per cent of platinum appeared to support this hypothesis.
Very accurate solidus determinations were required to establish the true nature of the diagram. Darling, Mintern and Chaston reported in 1952 (17) the results of solidus determinations by microscopic methods. The results are shown in Fig. I which gives the revised equilibrium diagram plotted on a weight basis because of the similar atomic weights of gold and platinum. Between 30 and 45 per cent of gold the solidus is a gently sloping line having upper limits of 1315°C
at 30 per cent and 1305°C at 45 per cent of gold. Microscopic examination confirmed the existence of a single phase area immedi- ately below the solidus. Fig. 2 shows the
well-defined duplex structure of the 42 per cent gold alloy quenched from 1220°C. Small
pockets of the second phase, shown in Fig. 3, still persist at 124ooC, while Fig. 4 illustrates that the structure at 12yj’C is that of a typical solid solution.
2 3 4
Microstructures of the 4% p e r cent gold alloy
Fig. 2 Quenched from 1220°C Fig. 3 Quenched f r o m 1240°C Fig. 4 Quenched f r o m 129S'C
I n order to account for discontinuities in curves illustrating the change of electrical resistance during the process of precipitation, Johansson and Linde (10) postulated the
existence of intermediate, possibly ordered phases, within the miscibility gap at tempera- tures below 400°C. No evidence of these phases was found by Grube, Schneider and Esch, who reported, however, that alloys containing up to 40 atomic per cent of platinum began to order when heat-treated below goo"C. A second phase, having a lattice parameter rather lower than that of the platinum solid solution, appeared after heat treatments of up to forty-two days with intermediate deformation by grinding.
Tiedema, Bouman and Burgers (IS)
repeated these experiments but were unable to detect a second phase even after sixty-six days of heat treatment. No other investi- gators have detected an intermediate phase in the gold-rich solid solution, and it is difficult to account for the observations of Grube, Schneider and Esch.
The accuracy of the diagram of Fig. I was
confirmed in 1955 by Raub and Worwag (19)
and in 1957 by Bouman and Burgers (IS).
Kanebetskaya in 1957 (20) used the system as illustration of the way in which a relatively small increase in the free energy of mixing could transform a solid solution diagram into one of the peritectic type.
The metallographic preparation of the alloys presents little difficulty. Suitable techniques have been described by Darling, et al. (17) and by Reinacher (51).
Thermodynamics
of the
System
In 1930, when Johansson and Linde ad- vanced their diagram, gold-nickel alloys afforded the only other example of a metal- lurgical system having a closed miscibility loop below the solidus (21). The solidus and
liquidus curves of gold-nickel alloys were almost coincident above the miscibility loop, whereas those of gold-platinum alloys were widely separated. The system was thus of considerable interest, and attempts were soon made to apply thermodynamic analysis to the solubility and melting point data.
Scatchard and Hamer (22, 23) used in 1935
fairly flat inflexion over the range 50 to 70 per cent of gold, which, it was suggested, could have explained the thermal arrests wrongly interpreted by Grigorjcw as evidence of a peritectic reaction.
Wictorin (13) used his solubility data to devise an expression in which the integral molar free energy of solution was represented by a four-constant exponential function of concentration. I n developing this expression it was assumed that the molar entropy of mixing was ideal. Although fairly good agreement with the experimental data was achieved above g o o T the situation at lower temperatures was less satisfactory.
Hardy (24, 25) found that the shape of the
miscibility loop was more accurately described by a Lcsub-regular” solution model in which the exchange interaction energy was allowed to vary with composition in a linear manner. The excess molar heat of solution was given by the expression
H = A, x‘y
+
A2xyLx andy being the atomic fractions. By apply- ing this expression to the solubility data of Wictorin (13) and of Darling, Mintern and Chaston (17) the quantity (A,-A,) was found to be sensibly independent of tempera- ture over the range 1250” to 900°C.
Weiss and Tauer (26) advanced in 1958 a six-termed expression for the total free energy of the system, in which the magnitudes of dominant components such as electronic, lattice and mixing free energies were inde- pendently computed. These authors attri- buted the asymmetrical distribution of the miscibility loop to the rapid filling of the “8’
band, indicated by a rapid increase in the electronic specific heat coefficient over the range 10 to 30 atomic per cent of platinum.
At the upper critical point the third derivative with respect to composition of any free energy expression should be zero. This criterion, when applied to Weiss and Tauer’s expression, displaces the top of the miscibility loop to the equi-atomic composition, thus suggesting some inaccuracy in their basic assumptions.
In their recent paper L. J. van der Toorn and T. J. Tiedema (27) reverted to the classical approach and evolved an expression in which the excess free energy of solution was represented by the first three terms of a power series in x divisible by xy, x and y being the atomic fractions. The integral molar heat of solution was only positive for platinum contents higher than 20 per cent.
The solubility limits calculated from this expression agree closely with all the recent experimental data (13, 17, 18, 19) and this analytical approach seems likely to supersede that of earlier workers.
The Mechanisms
of
Precipitation
Because of its unusual simplicity the gold- platinum system was the first to be studied by Borelius and his colleagues during the development of their thermodynamic potential barrier theorem (28, 29, 30). The rate of precipitation, according to this theory, depended greatly upon the curvature of the free energy composition curve. The spinodal, being the locus of the inflexion points of the isothermal free energy composition curves, forms a lower limit of metastable equilibrium. Between the spinodal and the two-phase field boundary exists a thermodynamic potential barrier which must be overcome before nucleation can OCCUT, with the result thatprecipitation is retarded in this area. Resistometric studies on the 70 : 30 gold- platinum alloy were reported by Johansson and Hagsten in 1937 (29). Up to 550” the
velocity of precipitation increased with tem- perature owing to increased atomic mobility. Above this temperature a retardation set in, which at IOOO below the solubility limit
became so pronounced that no appreciable change in resistance occurred after thirty-five hours of heat treatment. Wictorin (12) fol-
... . . .... . PHASE B O U N D A R Y
i d n n
-
VAN D E R T O O R N L T I E D E M AI
I
W ICTOR I N
__--
’---
I
- -’ H A R D YA T O M I C PER CENT GOLD
Fig. 5 Comparison of the spinodal curves calcul- ated by Wictorin (23), Hardy ( 2 4 ) , and van der
Toom (27)
Eorelius. I n his later work (13) the boundary of the two-phase region was carefully re- determined, and an expression for the free energy of solution advanced. The spinodal calculated from this expression coincided with the limits of retardation found during precipitation experiments. I n Fig. 5 the spinodal curves calculated by Wictorin (13),
Hardy (25), and van der Toorn (27) have been contrasted. Increasingly refined methods of calculation have displaced the curve further and further from the gold-rich phase boun- dary. These results might possibly explain the frequent reluctance of the 70 : 30 gold- platinum alloy to age harden (37).
X-ray diffraction studies show that during the early stages of precipitation the normal reflections from the super-cooled solid solution are accompanied by “side bands” which appear on each side of the Debye- Scherrer lines before any movement of the lines occurs and before emergence of the diffraction pattern of the precipitated phase, A characteristic feature is that bands on either side of a diffraction line are of different intensity. Tiedema, Bouman and Burgers (18) studied these bands using wire and single crystal specimens. A modification of Har- greaves’ lattice modulation model was ad- vanced to account for the experimental data.
Periodic disturbances in lattice parameter were, it was suggested, responsible for the “side bands”, which arose from the alternation of two crystal lattices having differing dimensions in one cube dimension only, thus initiating a lattice disturbance of regular period. During the pre-precipitation period the two lattices were present in the same proportions as the two equilibrium phases, accounting thereby for the differing intensities of the two side bands.
Diffusion
Processes
Early studies by Jedele (31) and Jost (32)
suggested that platinum diffused into gold faster than gold diffused into platinum. Bolk‘s recent investigation (33), which contra- dicted this belief, was deliberately made under conditions in which a phase boundary was formed during an experiment. The progress of diffusion with time was measured by X-ray techniques and the results analysed by procedures evolved by Matano (34) and Darken (35).
The phase boundary formed by diffusion bctween pure gold and platinum results from the shape of the diagram. Once the equilibrium phases are formed diffusion occurs across the interface between the gold
I
400 VI v) W z
< 3 0 0
r
a
v
Lo;
2 0 0 >I00
l O 0 O ~ C
2 0 40 60 ao loo
WEIGHT P E R CENT G O L D
Fig. 6 Hardness of gold-platinum alloys quenched
from temperatures u p to 1250°C, ajter previous
soaking at 1150°Cfor twelve days
and platinum solid solutions, each of which is constantly replenished from the reservoirs of pure gold and platinum. Because the partial diffusion coefficient of gold in the gold-rich solid solution is approximately seventy-five times that of platinum, a pronounced Kirkendaal effect is observed and the marker interface moves considerable distances towards the gold-rich side of the couple.
Hardness and Mechanical
Properties
Fig. 6 shows that alloys containing 20 to
60 per cent of gold are greatly hardened by quenching from temperatures above I 100'.
Precipitation is not completely suppressed by quenching within this composition range, and partial decomposition of the two solid solutions is primarily responsible for the high hardness values attained. Alloys containing 25 to 50 per cent of gold have very variable hardnesses when quenched from IZOO to
1280°C, and the intercrystalline cracking which frequently occurs can be reasonably attributed to partly suppressed grain boun- dary precipitation.
Fig. 7J based upon unpublished data (37)J
illustrates the tensile properties of com- mercially prepared solution-treated alloys. Small additions of gold rapidly increase the ultimate tensile strength of platinum at the expense of elongation. Gold increases the mechanical properties of platinum more rapidly than platinum increases the mechani- cal properties of gold. Although the informa- tion on this graph is in fair agreement with that presented by other investigators (36, 38,
39, 40) details of prior thermal treatment influence considerably the mechanical pro- perties of individual specimens, and the tensile data presented should be used for guidance purposes only.
The softest and most ductile material is obtained by quenching from 850°C. Fig. 8
illustrates the effect of cold rolling upon the hardness of material treated in this manner. T h e greatest proportional increase in hardness is exhibited by alloys containing approxi-
Platinum Metals Rev., 1962, 6 , ( 2 )
WEIGHT PER CENT GOLD
Fig. 7 Tensile properties of commercially pre- pared solution-treated gold-platinum alloys
mately 70 per cent of gold. Even in the cold rolled condition such alloys exhibit a sur- prisingly high ductility, as indicated by the elongation data in Table I (37).
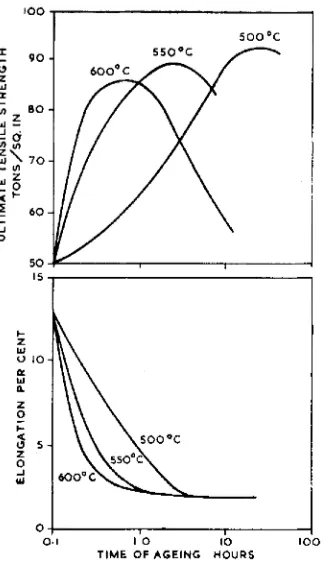
Considerable hardening results when duplex alloys, quenched from above IIOO'C, are reheated to temperatures ranging from 400 to 600°C. Fig. 9 illustrates the hardness of several alloys after ageing at 550°C for periods up to five hours. These alloys were quenched after solution treatment for half an
hour at temperatures of 1100 to 1200OC. Their quenched hardnesses are lower than
250
1
0 10 2 0 3 0 4 0 5 0
P E R C E N T REDUCTION IN THICKNESS
Fig. 8 Effect of cold-rolling upon the properties of
four quewhed gold-platinum alloys
65
ULTIMATE
TENSILE
STRENGTH
LIMIT
OF
PROPORTIONALITY
VICKERS
HARDNESS
ELONGATION
PER
CENT
TABLE I
Effect
of
Cold Rolling
upon
the Tensile
Properties
of
Two Gold-Platinum Alloys
Per cent
reduction
in
thickness U.T.S.
Tons/sq. in
0
10
20
30
1
;;
37.2 23.2
26.5
28.8
30.3
sequent response to age- hardening. Fig. 10, taken
from Schmid (36), illust- rates the effect of homogeni- sation upon the response to age-hardening of a 50 per cent gold-platinum alloy. The material solution treated for 170 hours was at all stages of ageing approximately 70 points harder than material solution treated for thirty minutes only. The effect illustrates the slow rate of approach to equilibrium during normal solution treatment processes.
Fig. 9 indicates that the 70 per cent gold alloy age- the corresponding values indicated in Fig. 6 , hardens while the 80 per cent gold alloy, which is based upon the behaviour of speci- being within the single phase region, does mens homogenised for twelve days at 1150'C not respond to heat-treatment. Although before quenching. This increase in hardness the 70 per cent gold alloy is well within the value with length of solution treatment is duplex region its response to age-hardening characteristic of the behaviour of gold- is rather erratic, being critically dependent platinum alloys and reflects itself in the sub- upon composition (37).
400
ul ul
w
3 0 0
a 4
I
ul
t
2002
>
80'loAu
' o o r I I z
4 5 0
40 0
In
3
3 5 0 z0
4
v)
w
a
3 0 0
a
5"
25C2 0 c
I5C
HOMOGENISED AGED 5 0 0 C
HOMOGENISED AGED 6 0 O 0 c
HETEROGENEOUS AGED 5 O O 0 C
HETEROGENEOUS AGED 6 0 O 0 c
I0 I0 I
, I
TlME OF AGEING HOURS
0
. . .
1 2 3 4 5 6
T I M E OF AGEING HOURS Fig. 10 Effect of homogenisation upon the response
to age-hardening of a 50 per cent gold-pEatinum
Fig. 9 E$ect ofprecipitation-hardening upon gold- alloy. (After Schmid (36)) The homogenised platinum alloys aged at 550°C ufter solution material was solution treated for 170 hours, the treatment f o r thirty minutes at 1 100-2 200' C heterogeneous material for thirty minutes only
Gold-platinum
Gold-platinum
L.O.P. Tonslsq. in.
100
5oooc
0. I 10 10 100 TIME OF AGEING HOURS
Fig. 11 Effect of precipitation upon the tensile properties of a 50 per cent gold-platinum alloy
The effects of precipitation upon the tensile properties of the 50/50 alloy are illustrated in Fig. I I . Although ultimate tensile strengths of the order of go tons per square inch can be attained, the corresponding elongations may
be as low as 2 per cent. Over-ageing does not improve the ductility (36).
The concluding part of Dr Darling’s article will be published in the July issue of ‘Platinum Metals Review’.
References
I W. A. Lampadius, Chem. Ann., 1796, I, 219
2 G. de Morveau, Ann. de Chim., 1803, 47, 300 3 P. N. Johnson, Phil. Mag., 1812, 40, 3 4 J. Weiger, London J . Arrs, 1845, 26, 398 6 T. Erhard and A. Schertel, Jahr. Berg -U
Huttenwes in Sachsen, 1879, 17, 163 7 P. Silow, Z. Physik. Chem., 1889, 3, 605-607
8 F. Doerinckel, Z. anorg. Chem., 1907, 34,
5 A. Cohn, B.P. 144, 119 (1919)
345-349
9 A. T. Grigorjew, Ann. Inst. Platine, 1928, 6 ,
10 G. H. Johansson and I. 0. Linde, Ann. Phys.,
11 W. Stenzel and J. Weerts, Siebert Festschrift,
Hanau, 1931,300-308. Also Z . Metallkunde,
I Z C. G. Wictorin, Ann. Physik., 1938 (v), 3 3 ,
509-516
13 C. G. Wictorin, Ivar Hoeggstroms Boktry- cherei, Stockholm, 1947. Also Arkiv. Mat., Asaon. Fysik., 1949, (B), 36, (9)
14 H. Jones, Proc. Phys. SOL, 1937, 49, 243
15 V. A. Nemilow, T. A. Vidusova, A. A. Rudnitsky and M. M. Putsykina, Izvestia Instituta Platiny, Akad Nauk, S.S.S.R.,
16 G. Grube, A. Schneider and E. Esch, Heraeus Festschrift, 1951, 20-42
17 A. S. Darling, R. A. Mintern and J. C. Chaston, J. Inst. Metals, 1952-53, 81, 125
18 T. J. Tiedema, J. Bouman and W. G. Burgers,
Acta Met., 1957, 5, 310-321
19 E. Raub and G. Worwag, Z . Metallkunde,
20 A. K. Gorbatenko and D. S . Kanebetskaya,
Zhur. Fiz. Khimii, 1957, 31, (2), 481-484
21 W. Fraenkel and A. Stern, Z . anorg. Chem.,
1927, 166, 160-170
22 G. Scatchard and W. J. Hamer, J . Amer.
Chem. Sac., 1935, 57, 1805-1809
23 G. Scatchard and W. J. Hamer, J . Amer. Chem. SOL., 1935, 57, 1809-1811
24 H. K. Hardy, Acta Met., 1953, I, 202-209 25 H. K. Hardy, J. Inst. Metals, 1952-53, 81,
26 R. J. Weiss and W. J. Tauer, J. Phys. Chem.
27 L. J. van der Toorn and T. J. Tiedema, Acta
28 G. Borelius, Proc. Phys. SOC., 1937, 49, 29 C. H. Johansson and 0. Hagsten, Ann.
30 G. Borelius, Ann. Physik., 1934, ( 5 ) , 20, 57; 184-194
1930, 5, 762-792
1932, 24, 138-141
1946, 20,176
I955J q 6 3 5’3
599-560
Solids, 1958, 7, (2/3), 249-251
Metallurgica, 1960, 8, 711 and 715 Extra Part 77-95
Physik., 1937, v, 28, 520-527
1934, (5)> 20, 650; 1935, (51, 24J 4’9; 1936-37, (5),28,507; 1938, (5h33, 517-531 31 A. Jedele, Z . Electrochem., 1933, 39, 691-695 32 W. Jost, Z . Phys. Chem., 1933, B ~ I , 158
33 A. Bolk, Acta Met., 1958, 6 , 5 9 4 2
34 C. Matano, Proc. Phys. Math. SOL. Japan,
35 L. S . Darken, Trans. Amer. Inst. Min. (Metall.)
36 H. Schmid, Metall, 1958, 12, (7% 612-619 37 Johnson Matthey Research Laboratories,
38 R. F. Vines, Platinum Metals and their Alloys,
39 D, B. P. 940,188, Degussa 1933, 15405-6
Engrs., 194% 175, 184
Unpublished data
New York, 1941
ULTIMATE
TENSILE
STRENGTH
ELONGATION
PER