Research article Available online www.ijsrr.org
ISSN: 2279–0543
International Journal of Scientific Research and Reviews
Seismic Performances Evaluation of Existing Building Design as Per
Old Code of Practice
Dinesh M
Department of Civil and Structural Engineering SCSVMV University Tamil nadu India Kanchipuram-631561 email: [email protected]
ABSTRACT
Codes of practice for plain and reinforced concrete and earthquake resistant design are revised periodically. Assessing the capacity of existing building as per the requirement of new codes of practice is an important task. In this thesis, four typical designs of a 6-Storey building are carried out as per old codes of practice for four load cases and they are, i) Case–1: For gravity load as per IS: 456- 1964 (Working stress method), ii) Case–2: For gravity load plus earthquake load as per IS: 456- 1964 and IS: 1893-1966 (Working stress method), iii) For gravity load plus earthquake load as per IS: 456-1978 and IS: 1893- 1984(Limit state method), iv)Case-4: For gravity load plus earthquake load as per IS: 456-2000 and IS: 1893-2002 (Limit state method). With these load cases the performance evaluation of the building is carried out with nonlinear static analyses and the capacity curves are generated. From these curves, the variation in maximum base shear and roof displacement capacities for the four different load cases are brought out clearly. The performance points are obtained and the corresponding base shear and roof displacements are arrived for IS 1893 – 2002, Design Basis Earthquake (DBE) and Maximum Considered Earthquake (MCE). All the four designs are found to meet the design basis earthquake demand. However, only case-4, is found to meet the performance point for maximum considered earthquake.
KEYWORDS:
Workingstressmethod, Limitstatemethod, Nonlinearstaic Analysis, SAP-2000, Pushover curve, Capacity Spectrum method, Performance point.*
Correspondence author
Dinesh M
(Department of Civil and Structural Engineering
SCSVMV University Tamil nadu India Kanchipuram-631561
1. INTRODUCTION
1.1 General: Many parts of Indian subcontinent were subjected to frequent high intensity earthquakes. Life
safety of buildings has become an important issue. The strength and ductility of the buildings designed and
detailed using earlier versions of the codes are becoming important issuesfor assessing their safety prescribed
by the present earthquake codes of practice. Under such circumstances evaluation of seismic performance of
the existing buildings has become extremely important. In present study nonlinear static analysis is used to
evaluate the performance of the buildings. Presently, there are two nonlinear static analysis procedures
available, one termed as the Displacement Coefficient Method (DCM) included in the FEMA-356 document
and the other termed as the Capacity Spectrum Method (CSM) included in the ATC-40 document. Both of
these methods depend on the lateral load –deformation variation obtained by using the nonlinear static
analysis under the gravity loading and idealized lateral loading due to seismic action.
In the present work an attempt is pursued to establish guidelines for strengthening/retrofitting the
existing buildings designed as per the old codes of practice to the present revisions of codes of practice. For
seismic performance evaluation the existing building, a 6-Storey building is taken from,
IITK-GSDMA-EQ26-V3.0. This is a typical beam-column RC frame building with no shear wall. The building considered
does not have any vertical plan irregularities and it is a 6- storey office building. The building is analysed for
four cases. They are, i) Case–1: For dead load plus live load as per IS: 456-1964. ii) Case–2: For dead load
plus earthquake load as per IS: 456- 1964 and IS: 1893-1966. iii) Case 3: For dead load plus earthquake load
as per IS: 456-1978, and IS: 1893- 1984, iv) Case-4: For dead load plus earthquake load as per IS: 456-2000
and IS: 1893-2002.
The analysis of building for the four cases is carried out with STAADPro package and spread sheets
are developed to design the cross sections. The building is designed for the four load cases using the spread
sheets. The section details are arrived by working stress method for case-1 & case-2 and by limit state method.
SAP-2000 nonlinear analysis program is used to obtain the capacity of the buildings by push over analysis for
the four cases.
1.2 Analsis and code based design
1.2.1 Introduction
1.2.2 Code based Design
In India the two design approaches are used for the design of RC structures as per IS: 456 and they are i) working stress method (IS: 1964and IS: 1978) and ii) limit state method (IS: 456-1978 and IS: 456-2000). The conceptual difference between working stress method and limit state method is given in the Table 3.1. The estimation of design seismic base shear based on seismic coefficient method as per the revisions of IS: 1893 are given in Table-1.The conceptual development and methodology adopted in working stress and limit state method are discussed in the following sections along with problem definition.
Table: 1 Estimation of Base shear based on IS:1893
IS Codes IS 1893-1966 IS 1893-1984 IS 1893-2002
Equations for Base Shear
VB = CαhW VB = KCαhW VB = AhW
Constants C coefficient defining the
flexibility of structure with the increase in number of
storeys. ) 5 n ( 9 C
≤ 1 for frame buildings ≤1.33 for frame buildings
having load bearing walls Where,
n number of storeys including basement floors
h
Seismic coefficient varies with the type of soil and
seismic zones
Where,
αh= βIαo
β Coefficient depending upon
type of soil and foundation system
αo Basic horizontal seismic
coefficient varies w.r.t seismic zones K Performance factor depending
on the structure framing system and brittleness or ductility of construction
αh Design seismic coefficient
T Fundamental time period of the building in seconds C Coefficient defining the
flexibility of structure with the increase in number of
storeys depending upon fundamental time period T
For structure T <0.1 s ; If Ah ≤ Z; Ah = Z / 2
Where, g S R I 2 Z Ah a
Where
Z Zone factor given in Table I.2 for MCE and service
life of structure in a zone.*
R Response reduction factor depending on the perceived seismic damage
performance of the structure, Sa/g Average response
acceleration coefficient varies with type of soil Ah Design horizontal seismic
coefficient
Note: Seismic weight of the building (W); Importance factor, depending upon the Functional use of the structures (I)* The factor 2 in the denominator of Z is used so as to reduce the Maximum Considered Earthquake (MCE) zone factor to the factor for Design Basis Earthquake (DBE ).
1.2.3 Working stress Method
buildings designed with working stress method require satisfying the ultimate load carrying capacity in limit state method. The method is designated as working stress method as the loads for the design of structures are the service loads or the working loads. The failure of the structure will occur at a much higher load. The ratio of the failure loads to the working loads is the factor of safety. Accordingly, the stresses of concrete and steel in a structure designed by the working stress method are not allowed to exceed some specified values of stresses known as permissible stresses. The permissible stresses are determined dividing the characteristic strength fck of the material by the respective factor of safety.
1.2.4 limit state method
This method of design is based on limit state concepts. In this method, the structure shall be designed to withstand safely all loads liable to act on it throughout its life; and it shall also satisfy the serviceability requirements, such as limitations on deflection and cracking. The acceptable limit for the safety and serviceability requirement before failure occurs is called limit state method. All relevant limit states shall be considered in design to ensure an adequate degree of safety and serviceability. In general, the structure shall be designed on the basics of the most critical limit state and shall be checked for other limit states.The Design should be based on characteristic values for material strengths and applied loads, which take into account the variations in the material strengths and in the loads to be supported. The characteristic values should be based on statistical data if available; the ‘design values’ are derived from the characteristics values through the use of partial safety factors, one for material strengths and the other for loads. In the limit state method of design which covers forms of failure, structure are designed for limit states at which the structures causes to function, the most important thing is
1) The limit state of collapse or total failure of the structure.
2) The limit state of serviceability which includes excessive deflection and excessive local damage.
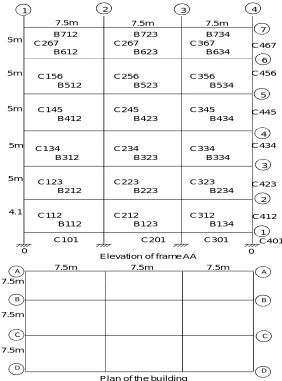
1.3 Details of 6-storey Building
1.3.1 Problem definition
earthquake load as per IS: 456-2000 and IS: 1893-2002. Pushover analysis of this problem is carried out using SAP-2000 software package.
1.3.2 Design Details
The building is assumed to have only external walls of 230mm thick with 12mm plaster on both sides and no internal walls are assumed. At ground floor only tie beams are provided. M20 grade concrete and F415 grade steel are used for design. The sizes of all columns are kept equal and to be equal to 500mm x 500mm. The sizes of all beams are kept equal to 300mm x 600mm. At ground floor slabs are not provided and the floor will directly rest on ground. Therefore, only ground beams passing through columns are provided as tie beams. The design data considered are shown in Table -2 B712 C267 B612 B723 C267 B623 B734 C367 B634 C156 B512 C245 B423 C356 B534 C256 B523 C145 B412 C345 B434 C134 B312 C234 B323 C334 B334 C123 B212 C223 B223 C323 B234 C112 B112 C212 B123 C312 B134 5m 5m 5m 5m 5m 4.1
C101 C201 C301
0 0 C412 C423 C434 C445 C456 C467 7 6 5 4 3 2 1 C401
7.5m 7.5m 7.5m
4 3 2 1 7.5m 7.5m 7.5m D C B A D C B A
Plan of th e bu ilding
7.5m 7.5m 7.5m
Elevation of frame AA
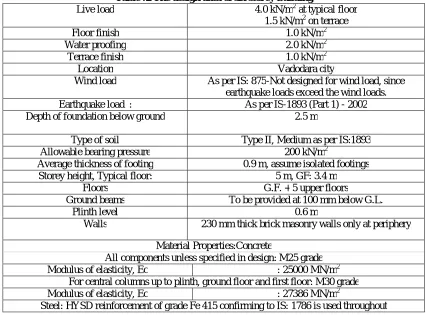
Table :2 The design data of six storey building
Live load 4.0 kN/m2 at typical floor 1.5 kN/m2 on terrace Floor finish 1.0 kN/m2 Water proofing 2.0 kN/m2 Terrace finish 1.0 kN/m2
Location Vadodara city
Wind load As per IS: 875-Not designed for wind load, since earthquake loads exceed the wind loads. Earthquake load : As per IS-1893 (Part 1) - 2002 Depth of foundation below ground 2.5 m
Type of soil Type II, Medium as per IS:1893 Allowable bearing pressure 200 kN/m2
Average thickness of footing 0.9 m, assume isolated footings Storey height, Typical floor: 5 m, GF: 3.4 m
Floors G.F. + 5 upper floors
Ground beams To be provided at 100 mm below G.L.
Plinth level 0.6 m
Walls 230 mm thick brick masonry walls only at periphery Material Properties:Concrete
All components unless specified in design: M25 grade Modulus of elasticity, Ec : 25000 MN/m2
For central columns up to plinth, ground floor and first floor: M30 grade Modulus of elasticity, Ec : 27386 MN/m2
Steel: HYSD reinforcement of grade Fe 415 confirming to IS: 1786 is used throughout
Different load cases studied and design methodology adopted are given in Table- 3 For seismic performance evaluation the 6-Storey building, is designed with different revisions of codes of practice with respective seismic zones as given in Table-4
Table 3 The Different Cases Studied
Case1 Case2 Case3 Case4
Codes IS: 456- 1964 IS: 456- 1964 and IS:
1893-1966
IS:456-1978 and IS:1893- 1984
IS: 456-2000 and IS: 1893-2002.
Load cases
with factors DL+LL (DL+EQ) 1.5(DL+EQ) 1.5(DL+EQ)
Design
approach WS method WS method LS method LS method
Note: DL=Dead Load, LL=Live Load, EQ=Earth Quake load, WS=Working Stress, LS=Limit State
Table -4 Different cases considered for present study
Case Design of Reinforced Concrete
Seismic-Code Load Combination Design Procedure
Seismic Zone
1 IS:456 1964 DL+LL Working Stress -
2 IS:456 1964 IS:1893 - 1966 DL+EQL Working Stress II 3 IS:456 1978 IS:893 - 1984 1.5(DL+EQL) Limit State II 4 IS:456 2000 IS:1893 - 2002 1.5(DL+EQL) Limit State III
Note: DL=Dead Load, LL=Live Load, EQ=Earth Quake load, WS=Working Stress, LS=Limit State
1.3.3 Estimation of base shear calculation
Table -5 Distribution of lateral force as per IS 1893-1966, 1984, 2002
Floor level Wi (kN) hi(m) Wi hi2
Vi (kN)
IS 1893 - 1966 IS 1893 - 1984 IS 1893 - 2002
1 2027 1.1 2452.67 0.17 0.16 0.23
2 6138 5.2 1659720 11.38 11.12 15.57 3 6381 10.2 663879.2 45.51 44.50 62.30 4 6381 15.2 1474266.0 101.06 98.81 138.34 5 6381 20.2 2603703.0 178.48 174.51 244.32 6 6381 25.2 4052190.0 277.77 271.60 380.24 7 5597 30.2 5104688.0 349.92 342.15 479.00
ΣWihi2 14067152
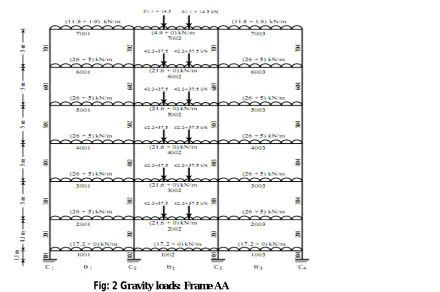
1.3.4Analysis of the building
The analysis of the building is carried out by using STADD PRO software package for the four cases. The Fig-2 shows the frame studied under gravity loads and lateral loads considered in each case is given in Table -5. The values for axial forces and Moments for column members and Moments and Shear force for beam members respectively are given in Table-B1-B6.
1.3.5 Reinforcement Details
The axial force and moments found from the analysis packages (STADD PRO) of are used for designing column members as per IS: 456-1964 for case 1 and 2 and SP-16 for case-3 and 4, and they are given in Table-6 (exterior columns) and Table-7 (interior columns). Considering the moments and shear forces the beam members are designed as per IS: 456-1964 for case 1 and 2 and SP-16 for case-3 and 4, and given in Table-8
Table -6 Design Details of Exterior Columns Case-1 (DL+LL) IS:456-1964 WS Case-2 (DL+EQ) IS:456-1964, 1893-1966 WS Case-3 1.5(DL+EQ) IS:456-1978, 1893-1984 Case-4 1.5(DL+EQ) IS:456-2000, 1893-2002 C101,C401, SPAN = 1100
Force (kN) 969 1093 1639 1799 Moment (kNm) 53.42 143 214.5 314 Section-1 600x600 600x600 600x600 600x600 Longitudinal 4-20Φ T/B 3-25 Φ T/B 4 -25Φ T/B 8-25Φ T/B Transverse 8Φ2L@200c/c 8Φ2L@200c/c 8Φ2L@200c/c 8Φ5L@200c/c
C112, C412 SPAN = 4100
Force (kN) 880 992 1488 1638.4 Moment (kNm) 43 985 273 356 Section-1 500x500 500x500 500x500 500x500 Longitudinal 4-20Φ T/B 3-25Φ T/B 4 -25Φ T/B 8-25 Φ T/B
Transverse 8Φ2L@200c/c 8Φ2L@200c/c 8Φ2L@200c/c 8Φ5L@200c/c
C123,C423 SPAN = 5000
Force (kN) 730.3 817.6 1226.4 1347 Moment (kNm) 71.39 171 256.2 336 Section-1 500x500 500x500 500x500 500x500
Longitudinal 4-20Φ T/B 3-25Φ T/B 4 -25Φ T/B 4 -25 Φ T/B, 4-22
Φ T/B
Transverse 8Φ2L@200c/c 8Φ2L@200c/c 8Φ2L@200c/c 8Φ5L@200c/c
C134, C434 SPAN = 5000
Force (kN) 573 630 945 1031 Moment (kNm) 74.28 162.4 244 315.2 Section-1 500x500 500x500 500x500 500x500 Longitudinal 4-20Φ T/B 3-25Φ T/B 4 -25Φ T/B 4 -25 Φ T/B,
4 -22 Φ T/B
Transverse 8Φ2L@200c/c 8Φ2L@200c/c 8Φ2L@200c/c 8Φ5L@200c/c
C145,C445 SPAN = 5000
Force (kN) 414 445 667 720 Moment (kNm) 80 158 236.3 303.3 Section-1 500x500 500x500 500x500 500x500
Longitudinal 4-20Φ T/B 3-25Φ T/B 4 -25Φ T/B 4 -25 Φ T/B,
4 -22 Φ T/B
Transverse 8Φ2L@200c/c 8Φ2L@200c/c 8Φ2L@200c/c 8Φ5L@200c/c
C156, C456 SPAN = 5000
Force (kN) 549 266 399 425 Moment (kNm) 80 148 222 279 Section-1 500x500 500x500 500x500 500x500 Longitudinal 4-20Φ T/B 3-25Φ T/B 3-25Φ T/B 4 -25 Φ T/B,
4 -22 Φ T/B
C167, C467 SPAN = 5000
Force (kN) 94 98 147 155
Moment (kNm) 76 110 165 198 Section-1 500x500 500x500 500x500 500x500
Longitudinal 4-20Φ T/B 3-25Φ T/B 3-25Φ T/B 4 -25 Φ T/B, 4
-22 Φ T/B
Transverse 8Φ2L@200c/c 8Φ2L@200c/c 8Φ2L@200c/c 8Φ5L@200c/c
Note: L-legged; Φ-diameter; c/c-Centre to Centre; T/B-Top and Bottom; All length unit in mm; Force in KN.
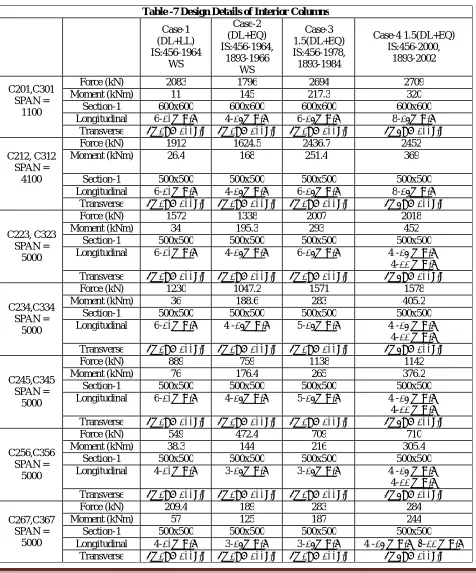
Table -7 Design Details of Interior Columns
Case-1 (DL+LL) IS:456-1964 WS Case-2 (DL+EQ) IS:456-1964, 1893-1966 WS Case-3 1.5(DL+EQ) IS:456-1978, 1893-1984 Case-4 1.5(DL+EQ) IS:456-2000, 1893-2002 C201,C301 SPAN = 1100
Force (kN) 2083 1796 2694 2709 Moment (kNm) 11 145 217.3 320
Section-1 600x600 600x600 600x600 600x600 Longitudinal 6-20Φ T/B 4-25Φ T/B 6-25Φ T/B 8-25Φ T/B
Transverse 8Φ2L@200c/c 8Φ2L@200c/c 8Φ2L@200c/c 8Φ5L@200c/c
C212, C312 SPAN =
4100
Force (kN) 1912 1624.5 2436.7 2452 Moment (kNm) 26.4 168 251.4 369
Section-1 500x500 500x500 500x500 500x500 Longitudinal 6-20Φ T/B 4-25Φ T/B 6-25Φ T/B 8-25Φ T/B
Transverse 8Φ2L@200c/c 8Φ2L@200c/c 8Φ2L@200c/c 8Φ5L@200c/c
C223, C323 SPAN =
5000
Force (kN) 1572 1338 2007 2018 Moment (kNm) 34 195.3 293 452
Section-1 500x500 500x500 500x500 500x500 Longitudinal 6-20Φ T/B 4-25Φ T/B 6-25Φ T/B 4 -25 Φ T/B,
4-22 Φ T/B
Transverse 8Φ2L@200c/c 8Φ2L@200c/c 8Φ2L@200c/c 8Φ5L@200c/c
C234,C334 SPAN =
5000
Force (kN) 1230 1047.2 1571 1578 Moment (kNm) 36 188.6 283 405.2
Section-1 500x500 500x500 500x500 500x500 Longitudinal 6-20Φ T/B 4 -25Φ T/B 5-25Φ T/B 4 -25 Φ T/B,
4-22 Φ T/B
Transverse 8Φ2L@200c/c 8Φ2L@200c/c 8Φ2L@200c/c 8Φ5L@200c/c
C245,C345 SPAN =
5000
Force (kN) 889 759 1138 1142 Moment (kNm) 76 176.4 265 376.2
Section-1 500x500 500x500 500x500 500x500 Longitudinal 6-20Φ T/B 4-25Φ T/B 5-25Φ T/B 4 -25 Φ T/B,
4-22 Φ T/B
Transverse 8Φ2L@200c/c 8Φ2L@200c/c 8Φ2L@200c/c 8Φ5L@200c/c
C256,C356 SPAN =
5000
Force (kN) 549 472.4 709 710 Moment (kNm) 38.3 144 216 305.4
Section-1 500x500 500x500 500x500 500x500 Longitudinal 4-20Φ T/B 3-25Φ T/B 3-25Φ T/B 4 -25 Φ T/B,
4-22 Φ T/B
Transverse 8Φ2L@200c/c 8Φ2L@200c/c 8Φ2L@200c/c 8Φ5L@200c/c
C267,C367 SPAN =
5000
Force (kN) 209.4 189 283 284 Moment (kNm) 57 125 187 244
Section-1 500x500 500x500 500x500 500x500 Longitudinal 4-20Φ T/B 3-25Φ T/B 3-25Φ T/B 4 -25 Φ T/B, 4-22 Φ T/B
Note: L-legged; Φ-diameter; c/c-Centre to Centre; T/B-Top and Bottom; All length unit in mm; Force in KN.
Table -8 Design details of Beams
Case1 Case2 Case3 Case4
Support All Beam B212 to B734
300x600 4-25Φat top
4-25Φ at bottom
300x600 4-25Φat top
4-25Φ at bottom
300x600 4-25Φat top
4-25Φ at bottom
300x600 7-25Φat top
6-20Φ at bottom
Mid Span All Beam B212 to B734
300x600 2-25Φat top
4-25Φ at bottom
300x600 2-25Φat top
4-25Φ at bottom
300x600 2-25Φat top
4-25Φ at bottom
300x600 2-25Φat top
52-20Φ at bottom
Support Beam B112,B123,B134
300x600 3-25Φat top
3-25Φ at bottom
300x600 3-25Φat top
3-25Φ at bottom
300x600 3-25Φat top
3-25Φ at bottom
300x600 5-20Φat top
5-20Φ at bottom
Mid Span Beam B112,B123,B134
300x600 3-25Φat top
3-25Φ at bottom
300x600 3-25Φat top
3-25Φ at bottom
300x600 3-25Φat top
3-25Φ at bottom
300x600 5-20Φat top
5-20Φ at bottom
Codes of practice for plain and reinforced concrete, IS: 456 and the code for criteria for earthquake resistant design IS: 1893 are revised periodically. This chapter summarizes the design guidelines and features as per the revisions of IS: 456-1964, 1978 and 2000 and estimation of design seismic base shear (seismic coefficient method) as per the revisions of IS: 1893-1966, 1984 and 2002. Apart from the general analysis and design guidelines, the problem definition and methodology adopted for analysis and design of four load cases studied also presented. The 6-Storey office building with different load cases with reinforcement details for column and beam members as per the four cases are also discussed.
2. NON LINEAR STATIC ANALYSIS
2.1 Performances objective
2.2 Capacity
The overall capacity of a structure depends on the strength and deformation capacities of individual components of the structure. In order to determine capacities beyond the elastic limits some form of nonlinear analysis is required. This procedure uses a series of sequential elastic analyses superimposed to approximate a force-displacement capacity diagram of the overall structure. The capacity curve is generally constructed to represent the first mode response of the structure based on the assumption that the fundamental mode of vibration is the predominant response of the structure. This is generally valid for buildings with fundamental periods of vibration up to 1 second. For more flexible buildings with fundamental period greater than one second, higher modes need to be considered.
2.3 Demand
Demand is the representation of earthquake ground motion and capacity is a representation of the structure’s ability to resist the seismic demand. There are three methods to establish the demand of the building. They are i) Capacity spectrum method, ii) Equal displacement method and iii) Displacement coefficient method. Out of these three methods capacity spectrum method is widely used and it is adopted here.
2.4 Evaluation Based on Nonlinear Pushover Analysis
Push over analysis is a nonlinear static analysis in which the magnitude of the lateral load is gradually incrementally increased, maintaining a predefined distribution pattern along the height of the building. By increasing the magnitude of the loads, as a result in weak links and failure modes of the building will occur. In pushover analysis one can determine the behavior of a building, including the ultimate load and the maximum inelastic deflection. At each step, the base shear and the roof displacement can be plotted to generate the pushover curve. It gives an idea of the maximum base shear that the structure is capable of resisting. For regular buildings, it can also give a rough idea about the global stiffness of the building.
2.5 Seismic Hazard Levels
In a probabilistic method, an earthquake level is defined with a probability of exceedance in a specified period. The following three levels are commonly defined for buildings with a design life of 50 years (FEMA356).
1. Serviceability earthquake: 50% propability of exceedance in 50 years. 2. Design basis earthquake (DBE): 10% propability of exceedance in 50 years.
In IS 1893:2002, the zone factor Z corresponds to MCE. The values of Z were evaluated based on a deterministic method. It cannot be directly related to the definition given above. The factor 2 in the denominator of Z is used so as to reduce the Maximum considered Earthquake (MCE) zone factor to the factor for Design Basis Earthquake (DBE). A partial load factor of 1.5 is applied to DBE in the load combination.
2.6 Analytical Procedures
These analytical procedures for evaluating the performance of existing buildings and verifying the design of seismic retrofits. There are two analysis methods, (1) Elastic (linear) (2) Inelastic (nonlinear), available for the analysis of existing buildings. Elastic analysis methods available include code static lateral force procedures, code dynamic lateral force procedures and elastic procedures using demand capacity ratios. The most basic inelastic analysis method is the complete nonlinear time history analysis, which at this time is considered overly complex and impractical for general use. Available simplified nonlinear analysis methods, referred to as nonlinear static analysis analysis procedures include the capacity spectrum method (CSM) that uses the intersection of the capacity (pushover) curve and a reduced response spectrum to estimate maximum displacement; the displacement coefficient method(e.g., FEMA-273 (ATC1996a).
2.7 Capacity Spectrum Method
In capacity spectrum method, a capacity curve which is a graphical representation of global force-displacement capacity curve of the structure is used and compared with response spectra of earthquake demands. In other words, in capacity spectrum method, location of performance point at which the capacity and demand are equal is located. When the structure is subjected to earthquake excitation the displacement of the structure increases and results in lengthening of the period and increase in damping. The capacity spectrum method reduces the demand to find an intersection with the capacity spectrum where the displacement is consistent with the implied damping. In capacity spectrum method three procedures are there A, B, and C, in which only the minimum required mathematical relationships of this section referenced.
2.8 Pushover Analysis and Pushover curve
After assigning all properties of the model, the force controlled pushover analysis of the building model is carried out. The model is pushed in monotonic increasing order in a particular direction of our case it is 2D model the model is pushed in X-direction only.
structure at each displacement level is obtained in terms of base shear, which is presented by pushover curve. Pushover curve is a base shear force versus roof displacement curve, which tells about the shear force developed at the base of the structure at any push level. The peak of this curve represents the maximum base shear, i.e. maximum load carrying capacity of the structure; the initial stiffness of the structure is obtained from the tangent at pushover curve at the load level of 10% that of the ultimate load and the maximum roof displacement of structure is taken that deflection beyond which collapse of structure takes place.
2.8.1Procedure Adopted for Pushover Analysis
As the name implies, it is the process of pushing horizontally, with a prescribed loading pattern, incrementally, until the structure reaches a limit state. With the increase in the magnitude of the loads, weak links and failure modes of the building are found. Steps involved in pushover analysis are
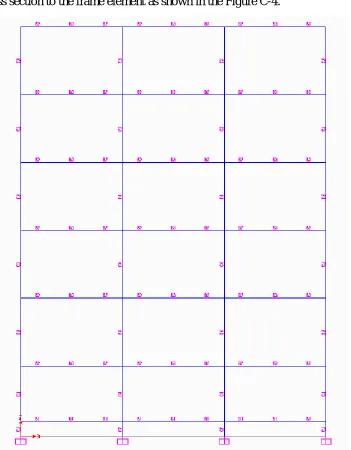
1) Create the basic computer model (without the pushover data) in the usual manner using the graphical interface of SAP2000 makes this quick and easy task as shown in the Figure -3.
2) Define material properties and cross section details to the frame element. 3) Assign the cross section to the frame element as shown in the Figure C-4.
Fig : 4 Assigining the Member Sections
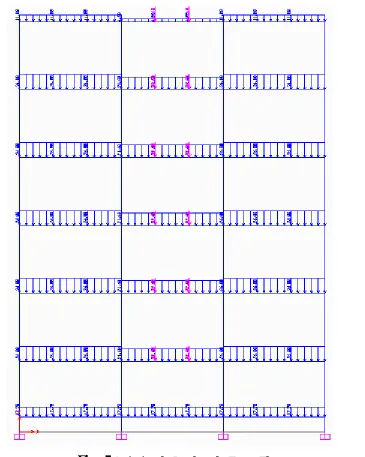
4) Define load cases pattern.
Fig : 5 Assigning the Loads to the Frame Element
6) Define hinge properties the program includes several built-in default hinge properties that are based on average values from ATC-40 for concrete members and average values from FEMA-273 for steel members. Our case uses default hinges only.
Fig: 6 Assigning the Hinge to the Model
8) Define the pushover load cases. In SAP2000 more than one pushover load case can be run in the same analysis. Also a pushover load case can start from the final conditions of another pushover load case that was previously run in the same analysis.
Typically the first pushover load case is used to apply gravity load and then subsequent lateral pushover load cases are specified to start from the final conditions of the gravity pushover. Pushover load cases can be force controlled, that is, pushed to a certain defined force level, or they can be displacement controlled, that is, pushed to a specified displacement.
case. Here how the displacement controlled lateral pushover case that is based on a user-defined static lateral load pattern named PUSH is defined for our case.
1) Run the static pushover analysis.
2) Display the pushover curve. The File menu shown in this display window allows you to view and if desired, print to either a printer or an ASCII file, a table which gives the coordinates of each step of the pushover curve and summarizes the number of hinges in each state as defined in Figure -7 (for example, between IO and LS, or between D and E).
Fig-7 Capacity Curve
11) Display the capacity spectrum curve. Note that you can interactively modify the magnitude of the earthquake and the damping information on this form and immediately see the new capacity spectrum plot. The performance point for a given set of values is defined by the intersection of the capacity curve (green) and the single demand spectrum curve (yellow). Also, the file menu in this display allows you to print the coordinates of the capacity curve and the demand curve as well as other information used to convert the pushover curve to Acceleration-Displacement Response Spectrum format.
step-by- step. Hinges appear when they yield and are colour coded based on their state (see legend at bottom of screen).
13) Output for the pushover analysis can be printed in a tabular form for the entire model or for selected elements of the model. The types of output available in this form include joint displacements at each step of the pushover, frame member forces at each step of the pushover, and hinge force, displacement and state at each step of the pushover.
For buildings that are being rehabilitated it is easy to investigate the effect of different strengthening schemes. The effect of added damping can be immediately seen on the capacity spectrum form. You can easily stiffen or strengthen the building by changing member properties and rerunning the analysis. Finally you can easily change the assumed detailing of the building by modifying the hinge acceptance criteria and rerunning the analysis.
2.9 Nonlinear Static Analysis of the 6- Storey Building
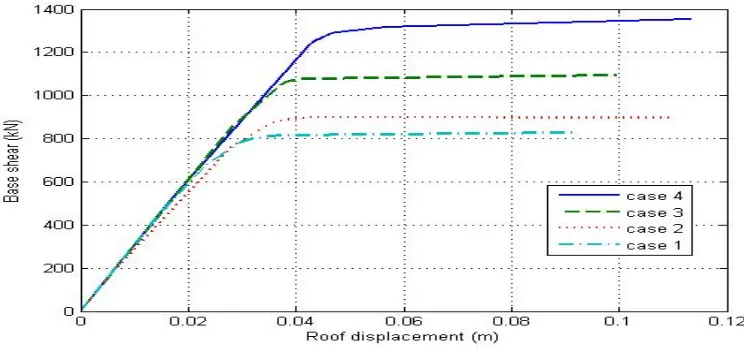
Towards the performance evaluation of building designed as per past codes of practice nonlinear static analyses are carried out for the 6 storey building designed earlier in chapter 3. Considering the symmetry of the building and neglecting torsion effects, the 2D model of frame AA is simulated in SAP2000 for pushover analysis. The frame is modeled with default PMM hinge properties for columns and M3 hinge properties for beams. Displacement controlled nonlinear static pushover analyses are carried out for the different load cases studied. The capacity curves for the four load cases are shown in Fig.4.1and the Maximum Base shear and roof Displacement are given in Table 9. The capacity curves are transformed to capacity spectra in ADRS format.
The demand spectra as per IS 1893 – 2002 (Zone III) 5% response spectra for design basis earthquake (DBE) is obtained and converted to ADRS format. The capacity curves, demand curves and performance points are shown in Fig.4.2. The base shear and roof displacement corresponding to the performance points as per IS 1893 – 2002 (Zone III) DBE earthquake are given in Table -10
Table: 9 Maximum Base shear and Roof displacement for the 6-storey building
cases Base shear (kN) Roof Displacement (m)
Case-1 828.85 0.091
Case-2 896.99 0.11
Case-3 1094.97 0.099
Fig. 3 Demand, Capacity curves in ADRS format and Performance points of buildings
Table : 10 Performance Points for IS 1893 -2002 DBE Medium soil
Cases Sd (m) Sa(g) Displacement(m) Base Shear(kN) Case1 0.034 0.086 0.034 807.915 Case2 0.032 0.092 0.032 862.146 Case3 0.030 0.097 0.030 912.797 Case4 0.030 0.097 0.030 912.797
3. RESULT
From the pushover analysis results, it is seen that the performance point for case 1 and case 2 are observed near the yield point of their capacity spectra for the demand of IS 1893 DBE earthquake (Zone III). Performance points are not obtained for case 1 and case 2 for the demand of IS 1893 MCE earthquake (Zone III). Performance points for case 3 and case 4 are observed in the elastic region for the demand of IS 1893 DBE earthquake (Zone III). Hence the necessity to convert the 5% demand spectra for higher effective damping did not arise. However for case 4, performance point for MCE earthquake is observed in the inelastic region of the capacity curve. Necessary correction for effective damping needs to be carried out and the performance point can be obtained by trial and error method accordingly. The base shears and maximum displacements corresponding to the performance points reveal the inelastic capacity of existing building designed as per past codes of practice.
4. SUMMARY AND CONCLUSIONS
3.1 Summary and Conclusions
Building design codes and seismic codes are revised from time to time and the hazard potential of existing buildings for the revised codes of practice is a major issue. Performance evaluation procedures aim at assessing the inelastic base shear and inelastic displacement capacity of existing building. Modelling of building for performance evaluation necessitates the knowledge about the section and reinforcement details of existing buildings. In the absence of drawings and section details, it is required to design the building as per old codes of practice. The present generation of structural designers are familiar with provisions of current building codes and have less exposure to provisions of old codes of practice.
In this thesis, the evolution of RC design procedure from working stress method to limit state method as given in different versions of IS: 456 are discussed. Various provisions in detailing such as minimum and maximum compression / tension reinforcement, transverses reinforcement for flexural and compression members with appropriate spacing of rectangular stirrups are critically reviewed and tabulated. Design steps for Reinforced concrete beams and columns as per working stress method and limit state method are presented. Spread sheets are developed for the design of RC beams and columns as per working stress and limit state method.
displacements are arrived for IS: 1893 – 2002 design basis earthquake and maximum considered earthquake. All the four designs are found to meet the design basis earthquake demand. However, only case 4, is found to meet the performance point for maximum considered earthquake.
3.1 Scope for Further research Work
The building studied can be analysed by incorporating the effect of confined stress-strain relation and user defined PMM and M3 hinges properties.
Studies can also be conducted for various plastic hinge length models.
linear Time History analysis can be carried out and results can be compared with Non-linear Static Analysis.
More number of studies can be carried out to arrive at the guidelines on the performance evaluation of existing buildings designed as per past codes ofREFERENCES
1. ATC-40 Seismic evaluation and retrofit of concsrete building”. Applied Technology Council, Redwood City, 1996.
2. Anthoine A, A simple displacement control technique for pushover Analyses, Earthquake Engineering Structure. Dynamic. 2006; 35: 851-866.
3. ATC Development of performance-based Earthquake Design Guidelines”. ATC 58, Redwood City, 2002.
4. Bertero R.D and Bertero V.V Performance- based seismic engineering: the need for a reliable conceptual comprehensive approach, Earthquake Engng Struct. Dyn. 2002; 31: 627-652 5. Chopra A.K and Goel R.K A modal pushover analysis procedure for estimating seismic
demands buildings, Earthquake Engineering and Structural Dynamics, 2001; 31: 561-582. 6. CSI, Computers and Structures Inc., SAP 2000- Static and dynamic finite element analysis of
structures. Berkely, USA, 2000; 5.
7. Fajfar P Capacity Spectrum Method based on Inelastic demand Spectra, Earthquake Engng. Structural Dynamics 1999; 28: 979-993.
8. FEMA- 273 NEHRP Guidelines for the Seismic Rehabilitation of Buildings”, Federal Emergency Management Agency, Washington DC,1997.
9. FEMA -356 Prestandards and commentary for the seismic rehabilitation of buildings”, Federal Emergency Management Agency, Washington DC, 1997.
11. IS: 456:2000 Indian standard for plain and Reinforced Concrete Code of Practice, Bureau of Indian Standards, New Delhi-110002.
12. IS: 456:1978 Indian standard for plain and Reinforced Concrete Code of Practice, Bureau of Indian Standards, New Delhi-110002.
13. IS: 456:1964 Indian standard for plain and Reinforced Concrete Code of Practice, Bureau of Indian Standards, New Delhi-110002.
14. IS: 1893 (Part 1) Indian standards Criteria for Earthquake Resistant Design of Structures, Bureau of Indian Standards, plain and New Delhi-110002.
15. IS: 1893- 1984 Indian standards Criteria for Earthquake Resistant Design of Structures, Bureau of Indian Standards, plain and New Delhi-110002.
16. IS: 1893- 1966 Indian standards Criteria for Earthquake Resistant Design of Structures, Bureau of Indian Standards, plain and New Delhi-110002.
17. IS: 875 (Part 1)-1987, code of practice for design loads(other than earthquake) for building and structures, Bureau of Indian Standards, plain and New Delhi-110002.
18. KalKan E, and Kunnath S.K Adapative Modal Combination Procedure for Nonlinear Static Analysis of Building Structure, Journal of structural engineering ASCE, November 2006. 19. Kailar V and Fajfar P Simple Push-over Analysis of Asymmetric Buildings, Earthquake
Engineering and Structural Dynamics, 1997; 26: 233-249.
20. Krawinkler H, Seneviratana G.D.P.K Pros and Cons of a pushover analysis of seiemic performance evaluation, Engineering Structures, 1998; 20(4-6): 452-464.
21. Kappos A.J and Panagopoulos G Performance- Based seismic design of 3D RC Building using inelastic static and dynamic analysis procedures, ISET Journal of Earthquake Technology , paper No444, March 2004; 41(1): 141-158.
22. KalKan E and Kunnath S.K Assessment of current nonlinear static procedure for seismic evaluation of Building Structures, 2007; 29:305-316.
23. Lin Y.Y, Chang K.C and Wang YL Comparison of displacement coefficient method and capacity spectrum method with experiment results of RC Columns, Earthquake Engineering structure. Dyn.2004; 33: 35-48.
24. Moghadam A.S and Tso W.K 3-D Pushover Analysis for Damage Assessment of Buildings, JSEE: Summer 2000; 2(3).
26. Pinho R, Antoniou S, Casarotti C, Lopez M An Innovative Displacement- Based Adaptive Pushover Algorithm for Assessment of Building and Bridges, Advances in Earthquake Engineering for urban risk reduction. NATO Workshop, Istanbul, 30 May 01 June 2005. 27. Pan P and Ohsaki M, Nonlinear multimodal pushover analysis method for spatial structure,
IASS-APSC 2006, Beijing, China, Int. Assoc. Shell and spatial Structure.
28. Shah. H and Sudhir. K. Jain, Design Example of asix storey Building”, Document No. IITK-GSDMA-EQ26-V3.0
29. Sinha S.N. Reinforced Concrete Design Tata McGraw-Hill Publishing Company Limited New Delhi-110002.
30. Tothong and Cornell, Proceeding of the 8th U.S National Conference on Earthquake Engineering, April, San Francisco, California, USA, 2006; 18-22
31. Turker K and Irten E An effective load increment method for seismic analysis of buildings, progress in structural Engineering and Materials, 2007 ; 3: 337-344.