a
Corresponding author: pokorny.j@fme.vutbr.cz
Measurement of airflow and pressure characteristics of a fan built
in a car ventilation system
Jan Pokorný1,a, Filip Poláek1, Miloš Fojtlín1, Jan Fišer1 and Miroslav Jícha1
1Brno University of Technology, Faculty of Mechanical Engineering, Energy Institute, Technická 2896/2, Brno, Czech Republic
Abstract. The aim of this study was to identify a set of operating points of a fan built in ventilation system of our test car. These operating points are given by the fan pressure characteristics and are defined by a pressure drop of the HVAC system (air ducts and vents) and volumetric flow rate of ventilation air. To cover a wide range of pressure drops situations, four cases of vent flaps setup were examined: (1) all vents opened, (2) only central vents closed (3) only central vents opened and (4) all vents closed. To cover a different volumetric flows, the each case was measured at least for four different speeds of fan defined by the fan voltage. It was observed that the pressure difference of the fan is proportional to the fan voltage and strongly depends on the throttling of the air distribution system by the settings of the vents flaps. In case of our test car we identified correlations between volumetric flow rate of ventilation air, fan pressure difference and fan voltage. These correlations will facilitate and reduce time costs of the following experiments with this test car.
1 Introduction
The amount of ventilation air flowing into a car cabin is important parameter, which affects cabin indoor environment and HVAC system performance. It should be considered already in early stage of car design and has to be known before the new car series are produced to be able evaluate the efficiency of cabin’s ventilation, which has close relationship to the driving comfort and safety. ”The safety of occupants to reduce driver fatigue, ensure good visibility and maintain comfort is key to the successful design of such systems” [1]. To support the early stage of the HVAC system design our research team has been developed a Virtual Testing Stand of the Car Cabin [2], which is a computational model for the calculation of the car cabin heat load in various environments. The first verification was done [3], however still the model needed to improve the advection part. The amount of ventilation air and its distribution to the cabin was important task how to improve the advection scheme of the model.
In this paper the measurement of amount of sucked air into the cabin is presented for wide range of manual vents settings. The ventilation air distribution in automatic mode during various seasons is contemporary published in the paper [4]. Aim of this study was to find correlations between the setup of fan speed, volumetric flow rate and pressure difference of the fan for various ventilation setups. This study we performed on the our test and the obtained results will be used for subsequent experiments within work package Human Cabin Centred
Design of the Czech Republic project Josef Božek Competence Centre for Automotive Industry.
2 Methods
There are plenty of methods how to measure air flow rates through ventilation system, which are based on various physical phenomena, see [5]. For example there are mechanical flow meters, differential pressure flowmeters (orifice plates, Venturi tubes, etc.) or velocity flow meters (Pitot tubes, anemometers: vane, hot wire, laser Doppler, etc.). In our experiment we utilized the last mentioned category velocity flow meters, which identify the flow rate by measuring the air velocity and integrating over the flow area. To measure air velocity we used a couple of hot bulb anemometer probes manufactured by Testo.
The method is more accurate when the stilling channel is used to ensure that air flow through a ducting system will be evenly distributed with developed air flow regimes. The volumetric flow rate ࢂሶ was afterwards calculated from the knowledge of cross-section area ࡿ of this channel and mean velocity ࢜ഥ . During the experiments we also kept knowledge of the barometric pressure and air temperature to be able to calculate air density ࣋ and thus also mass flow rate ሶ through the ventilation system, see Equation 1.
݉ሶ ൌ ܸሶ ή ߩ ൌ ݒҧ ή ܵ ή ߩ ൌσసభሺ௩ήௌሻ
ே ή ߩ (kg·s
-1
) (1) C
2.1 Experimental setup
The stilling channel added in front of the test car suction inlet was a plastic tube of diameter 150 mm and length 2000 mm. Because the suction inlet is located under the hood, we had to remove it to be able prepare the experimental setup, see Figure 1 on the left; on the right side, there is shown the ring around the cross-section area, which was located in the middle of the tube’s length to locate measuring axis un . The ring we used for better
Figure 1. Experimental setup. On the left: Stilling channel during measurements. On the right: the ring around the cross-section area of tube where the probes were placed (axis location +x=45 ° +y= 135° from the horizontal plane).
During the test the car engine was idling to ensure that the fanbe powered with same power as during real traffic coditions (supply voltage about 13.8 V). For the measurement of the voltage we used classical multi-meter and for the measurement of the pressure difference we used Testo 435 with a build pressure sensor. The value of pressure difference was recorded manually ten times for the each test case. In the case of air velocity we recorded measurement automatically with sampling rate 1 Hz. We used two hot bulb anemometers connected to data logger Testo 350 M/XL. The each point was measured for five seconds and other five seconds were used for the changing position of the probes in the tube. The position of the probes in the tube was setup according to the theory see [6] using the Equation 2.
ݎൌ ܴ ή ඥሺʹ݅െ ͳሻ ʹܰΤ (m·s-1) (2) where R = 75 mm is diameter of the tube and N = 7 is number of traversed lines in each half-axis. Using this the approach it allows to split cross-sectional area of tube (176.7 mm2) into 28 sectors of equal areas. For each sector was measured one air velocity at its centre and then we calculated the mean velocity ࢜ഥ simply as the average value of these local velocities. Additionally we measured the central point [x=0, y=0], so all together it counts 29 points to measure for each test case. However central point not enter to the calculation of mean velocity, because this points represents annulus of zero area (see Figure 2).
2.2 Uncertainties
To obtain a representative view about a flow regime inside the tube the air velocity at the cross-section‘s traverse lines (x, y axis) was measured repeatedly. For
each ventilation setup it was traversed five times to be able evaluate uncertainty components: of type A. In this case the standard uncertainty ࢛ can be associated with standard deviation of the mean. We applied this for the air velocity and obtained the Equation 3.
ݑൌ ݇௨ή ටሺିଵሻଵ σ ሺݒୀଵ െ ݒҧሻଶ (m/s) (3)
where ࢛ൌ Ǥ is safety factor for number of repetition ൌ . Then the expanded uncertainty for the 95 % confidence interval is UA = 2·uA,where 2 is the relevant coverage factor, see [7]. The uncertainty of type B corresponding to the accuracy of measurement devices was neglected in this study.
2.3 Measurement schedule
The measurement schedule included test cases combining four different fan speed (level 2, 3, 4, 6) and four different configurations of closing vent flaps (“all vents opened”, “only central vents closed”, “only central vents opened” and “all vents closed”). We manipulate only with the flaps of the dashboards vents (two at centre and two at sides) and with two tunnel vents oriented to the rear seat. These configuration were chosen with respect to the cover a wide range of ventilation system operational conditions. We measured all mentioned combination which rises matrix 4x4 of examined test cases, see Table 1.
3 Results
In the first subchapter, there is demonstrated how the volumetric and mass flow rate were evaluated through the measurement of air velocities, which was the most time consuming procedure of the experiment. The procedure is described for the test case S6-C1, see Table 1. In the second subchapter a summary of results of all test cases is presented and in the third one the resulting pressure-volume characteristics are plotted.
3.1 Test procedure for particular test case
Figure 2. Test case S6-C1. Measured velocity profile in the tube with 28 equal areas of cross-section.
The measured values of air velocities in specific points of the cross-section area of stilling channel are plotted in Figure 2. There are illustrated location and measured values of all 28 sectors, which implies the mean velocity ݒҧ ൌ ǤͲͲ േ ͲǤͲ݉Ȁݏ. Hence by using the Equation 1 the volumetric flow rate was ܸሶ = 106.0 l/s and mass flow rate ݉ሶ =126.5 g/s.
In Figure 3, there are shown the velocity profiles for the x-axis and y-axis, with error bars showing the value of expanded standard deviation ܷ for each point. It can be seen that the air flow in the stilling channel had almost fully developed turbulent flow regime with the maximal velocity in the centre. For example, in the case S6-C1, the highest value of ܷ was for the point on y-axis y=+72 mm, where v = 5.71 ± 1.40 m/s. The individual time samples were [7.17, 5.91, 4.02, 5.63, 5.81]. On the other hand the lowest standard deviation was for the point on x-axis x=+66 mm, where v = 5.27 ± 0.18 m/s. The individual time samples were [5.21, 5.53, 5.22, 5.27, 5.13]. These uncertainties rather than outline some fluctuations in flow structure inside a tube, represents the precision of the measurement at given point.
Figure 3. Test case S6-C1. Measured velocity profiles and the mean velocity (point r = 0 mm not enter to its calculation).
3.2 Fan and ducting system characteristics
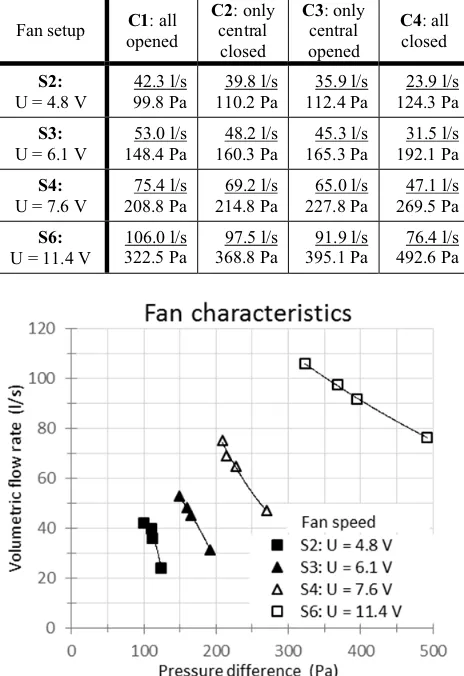
All identified operating points are noted in Table 1. Each point is defined by fan setup, vent flaps configuration, value of volumetric flow rate and pressure differences. From this table were plotted graphs in Figure 4 and Figure 5, representing operating points of the fan and ducting system, respectively.
The fan characteristics expresses how the specific fan of our test car works during various intensity of ventilation, which depends on the fan speed and thus also on the voltage of the fan. We derived for the fan a regression model using the polynomials of 2nd order see Figure 4. It can be seen that in the case S2 the volumetric flow rate is very sensitive to the pressure difference. From this reason we not measure the case S1, because the range of pressure difference is in order of units of Pascals which is close to the accuracy of the Testo device. On the other hand with the higher speed of fan the range of pressure differences respect to the range of volumetric flow rate is increasing and thus the interpretation of results should be more reliable.
Table 1. Matrix of all measured test cases
Fan setup C1: all opened
C2: only central closed
C3: only central opened
C4: all closed
S2:
U = 4.8 V
42.3 l/s 99.8 Pa
39.8 l/s 110.2 Pa
35.9 l/s 112.4 Pa
23.9 l/s 124.3 Pa
S3:
U = 6.1 V
53.0 l/s 148.4 Pa
48.2 l/s 160.3 Pa
45.3 l/s 165.3 Pa
31.5 l/s 192.1 Pa
S4:
U = 7.6 V
75.4 l/s 208.8 Pa
69.2 l/s 214.8 Pa
65.0 l/s 227.8 Pa
47.1 l/s 269.5 Pa
S6:
U = 11.4 V
106.0 l/s 322.5 Pa
97.5 l/s 368.8 Pa
91.9 l/s 395.1 Pa
76.4 l/s 492.6 Pa
Figure 5. Ducting system characteristics
The ducting system characteristics express the relation between the difference pressure and the volumetric for the specific ducting system. The most interesting curves are C1 and C4, which defines a thresholds of possible flow conditions through the given ducting. We derived for the the ducting also a regression model based on polynomials of 2nd order see Figure 5.
The main results of this experiment are identified regression curves for the fan and ducting system inside out test car. If we plot the fan curves and ducting system curves over themselves, we obtain from their intersections the operating points, which we already measured. However the advantage is that it is possible to change the type of fan on the current ducting, or also it is possible to change ducting system for the current fan to obtain new operating points.
4 Discussion
The experiments shown that the voltage of the fan is linearly proportional to the user settings of fan controller, as well as the volumetric flow rate see Figure 6. It is evident that the speed of fan not define volumetric flow rate unambiguously, because there is strong influence of how the ventilation ducting system is throttled by vent flaps settings. This is the main benefit of our experiment, to considered pressure - volumetric flow rate characteristics of ventilator (Figure 4) and ducting system (Figure 5) to be able cover all possible settings of ventilation control (defrost, automatic mode, closing or manual setup of vent flaps, etc.)
Figure 6. Speed of fan versus volumetric flow rate.
The positioning of the probes were done manually, so the error of fastening and positing could occur and slightly influence particular measured point. Still the standard deviation (confidence interval 95 %) during the measurement were acceptable generally and the anemometer based method shows a good repeatability.
The highest standard deviations of velocity were near the wall. We assume that is due to the higher velocity gradient at the wall, which caused that the measured values were more sensitive to precise probe location. The higher accuracy of the measurement could be achieved by increasing of repetition of measurement from 5 for example to 10. However we chose n = 5 due to the fact that the measurement would be too time consuming in case of 10 and the ݇௨factor would not
change significantly. The stilling channel
improved the stability of flow a lot and reduce the fluctuations which occur directly before the suction inlet of the ventilation system. The peak in the velocity profile (Figure 3) at the centre of channel cross-section can be explained by the fact that all points were measured by two probes simultaneously, however in case of central point it was used only one probe. Nevertheless the value of central point was not considered in the calculation of the mean velocity and volumetric flow rate.
5 Conclusion
We identified fan and ventilation ducting system characteristics describing correlations between volumetric flow rate, setup of ventilation system and pressure difference at the fan. Obtained correlations are valid only for fan and ducting system of our test car, but even so they will allow evaluate volumetric flow rate of air directly from the fan pressure difference. This approach will facilitate and reduce time costs of the consequent experiments with our test car substantially. Acquired knowledge is possible to use not only for climatic chamber tests, but even for real traffic conditions measurements.
Acknowledgement
The research was supported by the project Reg. No. FSI-S-14-2355 of the Brno University of Technology; the project LO1202 Netme Centre Plus with the financial support from the Ministry of Education, Youth and Sports of the Czech Republic under the "National Sustainability Programme I" and the project of the Josef Božek Competence Centre for Automotive Industry TE01020020.
References
1. S. Daly. Automotive air-conditioning and climate control systems. 1st ed. Oxford: Butterworth Heinemann (2006).
3. J. Pokorny, Fiser, M. Jicha, EPJ Web of Conferences 92, 02072 (2015)
4. M. Fojtlin, M. Planka, J. Fišer, J. Pokorný, M. Jícha. Airflow Measurement of the Car HVAC Unit Using Hot-wire Anemometry. Proceedings of Experimental Fluid Mechanics 2015, Prague, Czech Rep. (to be published).
5. H. D. Goodfellow, E. Tähti. Industrial Ventilation Design Guidebook. Part 12. Experimental techniques, (2001).
6. M. Pavelek. Experimentální metody v technice prostedí. 3. vyd. Brno : Akademické nakladatelství CERM (2007).