154
Does Tapioca Production In Pati Regency
Efficient?
Triana Dwi Wahyuni, Sasongko, Sri Muljaningsih
Abstract: This study aims to measure the level of technical efficiency in Tapioca Small and Medium Enterprises and the factors that affect tapioca production in Pati Regency, Central Java Province, Indonesia. The research method used is DEA (Data Envelopment Analysis) analysis with the assumption that output is oriented and the Variable Return to Scale (VRS) approach is used to measure the efficiency level of tapioca companies. Furthermore, by analyzing Ordinary Least Squares (OLS) to determine the factors that influence tapioca production. The results showed that the level of technical efficiency of tapioca production in Pati Regency was quite high, the average technical efficiency was 0.914. 35 of the 80 samples of tapioca entrepreneurs are still below the average. This study also presents the efficiency level of tapioca entrepreneurs on a low, medium and large scale business. Whereas with OLS analysis, it was found that raw material variables and plant area had a significant positive effect on tapioca production, labor and milling machine capacity did not significantly influence tapioca production.
Keyword: Tapioca, Efficiency, DEA, Cobb-Douglass production function
————————————————————
1
I
NTRODUCTIONThe manufacturing sector is the most important sector in the economy, because it is very dynamic and has great linkages with other sectors. Where growth can encourage and attract growth in other sectors, because the industrial sector requires input from other sectors and its output is also widely used by other sectors. Based on the Strategic Plan of the Ministry of Industry 2015 - 2019, the non-oil and gas processing industry sector contributed to the Gross Domestic Product (GDP) of 20.65 - 22.61%, becoming the highest contributing sector compared to other economic sectors in 2014. Manufacture industries the major role in GDP is: 1) food, beverage and tobacco industry with an average contribution of 36.85% per year, 2) transportation equipment, machinery & equipment contributing 27.80%, and 3) fertilizer industry, chemicals & goods from rubber contribute an average of 11.65% per year. These three sectors were the main drivers of the processing industry sector with a total average contribution of 76.3% during 2010 - 2014 (Ministry of Industry Strategic Planning, 2015). The branch of the food industry that has the potential to be developed is the tapioca industry. the tapioca processing industry has a relationship both in the agricultural sector (backward) and in the middle industry (forward). Backward linkage to the agricultural sector is a provider of raw materials, namely cassava, while forward linkage is an industrial sector that uses tapioca flour as raw material, such as the food, beverage, and so on. Cassava is one of the focuses of government policies, because it can be used as a variety of derivative products that are potential and sustainable as food and non-food ingredients. Based on data from cassava production per province from the Central Bureau of Statistics (BPS) in 2013 - 2017 showed that cassava production was concentrated in eight provinces. In the first place is Lampung Province with a total production of 5.54 million tons, followed by Central Java Province in second place with a total production of 3.32 million tons. Pati Regency is one of Central Java Province area which produce of cassava. The area of Pati Regency stretches along the northern coast of Java Island (pantura) and extends to the highlands in the central and lowlands in the south. Based on these landscapes, the agriculture and fisheries sector is still an important sector supporting community life in Pati Regency. Cassava Food Production in 2015 reached 661,975 tons or reached 49.23% and the lowest production was soybean production which reached 4,172 tons or 0.25% in 2015. Cassava Commodities
155
2
L
ITERATURR
EVIEWProducers are said to be technically efficient if it is no longer possible to produce more output than already exists without reducing a number of other outputs or by adding certain inputs Kumbakhar and Lovell (2000), Farrell (1957) categorizes the concept of efficiency into three: (1) technical efficiency (technical efficiency), (2) price efficiency (price efficiency), and (3) economic efficiency (economic efficiency). Technical efficiency reflects the entrepreneur's ability to obtain maximum output from a number of certain inputs. In other words, entrepreneurs who use fewer inputs than other entrepreneurs, but are able to produce greater output, it can be said that the entrepreneur has a superior level of technical efficiency compared to other entrepreneurs. Allocative efficiency is also called price efficiency, showing the ability of companies to use inputs with optimal proportions at each level of input prices and technology owned. While economic efficiency is a combination of technical efficiency and price efficiency, whereas according to Voulgaris and Lemonakis, (2013) economic efficiency can be measured by the criteria of maximum profit (profit maximization) and minimum cost criteria (cost minimization). Production activities are concerned with choosing alternatives that will produce optimal output. Optimal allocation of inputs will produce optimal output. At this point the producer must be able to allocate optimally the available resource use. Salvatore (1997) In the production process, the term production function is known as the relation between the factors of production and the achievement of the level of production produced, where the factor of production is often referred to as the input and the amount of production is called output (Sukirno, 2000). Factors of production are factors that influence production activities. In this study, raw material factors, area, engine capacity and labor will be the input variables in tapioca production. a production process is strongly influenced by the availability of raw materials in quantity and size that fits the portion of the needs of the producing company. Raw material is something that is used to make finished goods, the material will ultimately stick to become one with the finished goods. Hanggana (2006) The use of raw materials in accordance with the rules will provide significant additional production. Widyatmoko (2004), Rochaeni, Soekarto and Zakaria2, (2007)of land is where a production process takes place. Adequate land area will optimize production. Bayyurt and Yılmaz, (2012), Kuncoro, 2004; Raheli et al.(2017) In the tapioca production process, the area of production is land used as a place to dry tapioca starch (wet tapioca). Considering that in the Regency of Pati, the drying of wet tapioca still has light, sun, and has not used an oven machine. Labor is a factor that deserves further consideration because labor is an actor in the production process. An expert workforce will optimize the production process. The labor factor is very significant in the production process. Kurniawan (2008); Waryanto, Chozin and Intan (2014); Toma et al., (2017). The use of technology in the production process will accelerate the production process and optimize input. (Bayyurt and Yılmaz (2012); Li et al.(2017). The technology in the tapioca production process is the use of cassava grinding machines.
3
R
ESEARCHM
ETHODOLOGY3.1 Data
Research on tapioca production efficiency in Pati Regency is a research that requires data processing, comparison between input and output. Inputs in this case are raw materials, factory area, milling machine capacity and labor. The entire input is data in the form of numbers. The number of the input results will be compared with the total output of tapioca production that has been produced. Primary data collection was conducted in June-July 2018 in Pati Regency, Central Java Province, Indonesia, using a research questionnaire. The total sample was 80 tapioca factories.
3.2 Methodolgy
Data Envelopment Analysis (DEA)
The first step we use DEA to measure technical efficiency of tapioca factory. DEA offers three orientations in calculating its relative efficiency, namely (1) Input-oriented model, which is a model in which each DMU is expected to produce a certain number of outputs with the smallest possible input (minimization of input), thus input is something that can be controlled ; (2) An output-oriented model is a model in which each DMU is expected to produce the greatest number of outputs possible with a certain number of inputs (maximizing output), thus output is something that can be controlled; and (3) the base-oriented model, which is a model where each DMU is expected to produce with optimal combined conditions between input and output, thus input and output are something that can be controlled. (Charnes, Roussea and Semple, 1996) The value of technical efficiency in this study is based on the output oriented approach and the VRS model (variable returns to scale) with the consideration that milkfish production has not yet operated at an optimal scale because of the excess use of the input factors used. This can be seen in the size of the slack in the input used. The MAxDEA pro program is used to run primary data obtained.
OLS Linear Regression Analysis
The second method used to analyze the data in this study is to use multiple linear regression estimates to analyze the Cobb-Douglass production function. To determine the effect of raw material variables, factory area, milling machine capacity and labor on tapioca production in Pati Regency, expressed in the following functions:
(X X X X ) eq. (1)
Cobb-Douglas production function is:
Y = β0 X1 β1
X2 β2
X3 β3
X4 β4
eq. (2)
The Cobb-Douglas function is a non-linear function,
so to make the function a linear function, the Cobb-Douglas function become :
Ln Y=Ln β0 + β1LnX1 + β3LnX2 + β3LnX3+ β4LnX4 + μ eq. (3)
156 variable the regression coefficient. Where Y is the dependent
variable, X the independent variable, β is the coefficient of each variable,Ln is natural, and is error
With the equation model used in this study are:
eq. (4)
Where Prod is Production of tapioca (ton / production), Raw is Raw material (tons / production), Area is Factory area (Ha) MC is machine capacity (kg / hour) and Lab is labor (person / factory)
4
R
ESULT AND DISCUSSION4.1. Data Envelopment Analysis of Technical Efficiency This study calculates the level of efficiency of each DMU with an output approach on a variable return to scale (VRS) scale. The output oriented approach is an approach where each DMU will optimize the amount of output without adding input. DEA's VRS model will show more in accordance with the actual conditions of the DMU (in observation) where not all DMUs operate on a constant scale, due to the limitations of each DMU. While the output approach (output oriented) is a model where each DMU is expected to produce the largest number of outputs that are possible with a certain number of inputs (maximizing output), thus output is something that can be controlled. In this DEA testing was carried out on 80 DMUs, in which the entire DMU was a tapioca producer.
Tabel 1. DMU Ranking Based on TE Value
No Efficinncy Rank DMUs Persentage
1 Efisien (TE = 1) 26 32,5 %
3 Good (0,914 TE < 1) 16 20 % 4 Below (TE < 0,914) 38 47,5 %
Source: output Maxx DEA
Producers are said to be technically efficient if it is no longer possible to produce more output from existing ones without reducing a number of other outputs or by adding certain inputs (Kumbakhar & Lovell, 2000). Based on the results of the Maxx DEA, the efficiency value of tapioca production in Pati Regency have a high level of technical efficiency (TE). This can be seen from the average TE which reaches 0.914. With the highest TE value is 1 and the lowest TE value is 0.719. Based on Table 1. It is known that the majority of tapioca production in Pati Regency is in the position below the average technical efficiency. There were 26 factories (32.5%) who had perfect efficiency (Perfect Efficiency) with the value of TE = 1. It means there‘s no sclack values. 35 factories (43,75%) factories below the average efficiency. This shows that most tapioca production in Pati Regency is still not optimal in terms uses input factors. This can be seen from the size of the slack value especially in the use of labor input and milling machine capacity. based on DEA results, it is known that medium scale tapioca factories have a higher level of efficiency compared to low-scale tapioca factories. This is because at the middle scale factory is more flexible in optimizing existing production inputs. Broadly tapioca production in Pati Regency has a high level of efficiency. This is seen by the average TE value of 9.15. This shows that the
tapioca production in Pati Regency is optimal in terms of the use of input factors in producing tapioca. This high TE value is due to the tapioca business that has been running for generations since the Dutch colonial era. High efficiency is also supported by the easy access to the sale of tapioca products, because the tapioca production location is on the main access road to the city of Pati and there are two large food processing plants, namely the Garuda Kacang Factory and Dwi Kelinci Factory, which can accommodate tapioca flour.
4.2. Analysis of the cobb-Douglass production function Contrast to DEA analysis which assesses the level of efficiency of tapioca production individually, an analysis of the Cobb Douglas production function is used to determine the relationship between the dependent variable and the independent variable, and to measure the elasticity of the input variable towards the output variable (Sukirno, 2000).
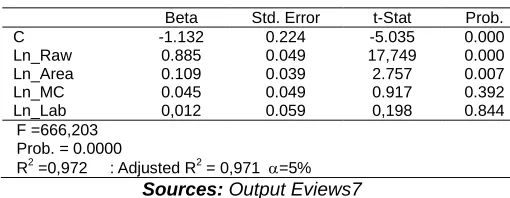
Tabel 2. Output OLS
Beta Std. Error t-Stat Prob.
C -1.132 0.224 -5.035 0.000
Ln_Raw 0.885 0.049 17,749 0.000
Ln_Area 0.109 0.039 2.757 0.007
Ln_MC 0.045 0.049 0.917 0.392
Ln_Lab 0,012 0.059 0,198 0.844
F =666,203 Prob. = 0.0000
R2 =0,972 : Adjusted R2 = 0,971 =5%
Sources: Output Eviews7
Based tabel 2. The partial test is done by looking at the probability of t-statistics. The t-statistical probability value is smaller than the value <5% or the t-statistical probability <0.05. Partially, the raw material variable has a t-stat probability value of 0,000 with a coefficient of 0.885. Raw materials have a significantly positive effect on tapioca production. Area area has a t-stat probability value of 0.007 with a coefficient of 0.109. The area has a significant positive effect on tapioca production. The capacity of the milling machine has no significant effect because it has a probability value of t-stat 0.398. means probability above alpha 5%. Labor also has no significant effect on tapioca production, because it has a t-stat probability value of 0.844. From the results of the study it was found that the influence of raw materials, factory area, milling machine capacity, and labor, simultaneously affected the variables of tapioca production. This can be seen in the probability of an F test of 0,000. partially each independent variable gives different proportions to the amount of tapioca production. this means that if there is a change in the independent variable already mentioned, there will be a change in the production output as well. R2 value of 0.97 indicates that 97% of tapioca production in this study can be influenced by the four independent variables.
Then the regression model estimation is obtained as follows:
157 coefficients. The results of return to scale in this study are as
follows:
Return to Scale : 1 +2 +3+4
= 0,885+ 0,109 + 0,045 + 0,011 = 1,05
Based on the results above, the Return to Scale value is 1.05. This explains that the addition of a production factor input of 1 percent will provide an increase in output of 1.05 percent. This also shows that the value of Return to Scale> 1. Or it is in the condition of increasing Return To Scale. where the company is impossible to stop because optimal profits have not been obtained. According to Erdemli (2009) and Agapie and Lima ( 2013) increasing return to scale can only occur in efficient industries. This approach assumes that prices of factors of production are constant. Gul (2009)'s research argues that increasing return to scale shows a business operates under sub-optimal conditions. This happens if the business in the use of inputs is still not balanced. Table 2 shown that probability value of the t test for the raw material is 0.0000 which means that the raw material variable has a significant and positive effect on tapioca production of 0.885. This means that the addition of 100% raw material, will provide an additional production of 88%, if other variables are constant. These results indicate that raw materials are the most important factor in the tapioca production process. Besides that the raw material coefficient has the highest value in the regression results. Without adequate raw materials, the tapioca production process will not work. The price of cassava raw materials will not affect the demand for cassava as the main raw material in tapioca production. Quality cassava raw materials and high starch content will affect the yield of tapioca produced. The same thing was expressed by Widyatmoko (2004) in his research on the factors that influence the amount of tapioca production in Central Java Province, Rochaeni et al. (2007) in Sukaraja Bogor. Area of tapioca factory has a coefficient of 0.109. this value shows the value of the area's elasticity of tapioca production. This means that the addition of an area of 100% will give an addition to the input of 10.9% with the condition of other factors being constant. The area tapioca factory plays an important role. This is related to the drying of tapioca which requires a large area. This is related to the location of tapioca production which really requires access to very good sunlight. Research by Toma, Dobre and Elena (2015; Chandio et al., (2017); Xiangzheng Deng (2018) states that optimal land use will increase agricultural production. Related to this, the tapioca processing location requires areas that have water sources and good access to solar heat. Solar heat is an important production factor for tapioca processing industry, thus, business locations that have good access to solar heat will support the success of tapioca processing businesses. Tapioca production in Pati Regency, have not been able to provide tapioca drying technology. So tapioca production are still very dependent on the tapioca factory area which located in the open space of solar heat as Pati Regency‘s area. The capacity of the milling machine has no influence on tapioca production in Pati Regency. The tapioca production process in Pati Regency is still semi-modern, where some of the production is done manually and some are done by machines. The use of machinery is only used during the process of milling cassava, enrichment and precipitation. While the preparation and drying process is done manually. In
line with this study, Saiyut et al. (2018) also found that the use of technology did not significantly influence agricultural production. This is due to the application of technology that is not in accordance with the capabilities possessed by farmers, so that continuous counseling is needed for farmers in Thailand. Bayyurt and Yılmaz, (2012) also found that the use of technology is not optimal in supporting production in 64 countries in various parts of the world. Mardani and Salarpour (2015) found that the use of technology could not optimally support potato production in Iran. The research of Widyatmoko (2004) also found that the use of grinding machines did not significantly affect tapioca production in Central Java and research Sulandari (2011) also stated the same thing where the use of machine technology in fishing did not affect the catch, due to the age of the milling machine old ones. The influence of machine capacity is not significant in the tapioca production process in Margoyoso District, because at the time of the study, the use of engine capacity was not used in accordance with its capacity. The grinding machine only works at 08.00 until 11.00 WIB. At this time cassava has entered the sieving and screening stage. So that the milling machine stops operating. In addition, tapioca entrepreneurs tend to limit the cassava raw material used. This limitation is closely related to the high price of cassava raw material which reaches Rp. 2,500.00 per kg. The labor variable also has no effect on tapioca production in Pati Regency. Labor is only used during the preparation and drying process. When production preparation workers are needed in the process of stripping and washing cassava. As for the reduction of cassava raw materials from trucks, employers utilize the daily labor they have, so there is no need to pay extra labor. Another study was conducted by Toma who examined agricultural productivity in Romania. In his research it was found that the aspects of labor used in the agricultural sector in Romania were too large, leading to inefficiencies in agricultural production. Toma et al.(2017). The effect of non-significant labor is due to the fact that when the engine is no longer in production, the daily fixed labor force remains in, so that the cost of producing labor wages for daily labor remains to be spent. Besides that, most of the power used by most families is close, so sometimes, even though they don't need it anymore, but for reasons of compassion for you, in the end they are still employed. This result is in line with the research of and Nasir and Hundie (2014) showing that labor does not have a significant effect on production due to the use of labor originating from within the family.
5
C
ONCLUSION158 material prices, it can be overcome by building partnerships
with cassava farmers. The high price of raw materials is due to the small supply of cassava. By optimizing dry land in the Margoyoso sub-district of Pati regency to plant cassava, the price of raw cassava can be reduced. A joint warehouse partnership is needed, as a tapioca storage area during the dry season. So far, only large entrepreneurs have been storing, while the average small businessman is unable to store tapioca products, so that when the rainy season does not have production deposits.
REFERENCES
[1]. Agapie, A. and Lima, T. (2013) ‗Cost Minimization Under VAriables Input Price: a Theoritical Approach‘, Romanian Journal Of Economics, 2, pp. 70–86.
[2]. Bayyurt, N. and Yılmaz, S. (2012) ‗The Impacts of Governance and Education on Agricultural Efficiency: An International Analysis‘, Procedia - Social and Behavioral Sciences, 58, pp. 1158–1165. doi: 10.1016/j.sbspro.2012.09.1097.
[3]. Chandio, A. A. et al. (2017) ‗The Nexus of Agricultural Credit, Farm Size and Technical Efficiency in Sindh, Pakistan: A Stochastic Production Frontier Approach‘, Science Direct, xxx.
[4]. Charnes, A., Roussea, J. J. and Semple, J. H. (1996) ‗Sensitivity and stability of efficiency classifications in data envelopment analysis‘, Journal of Productivity Analysis, 7(1), pp. 5–18.
[5]. Erdemli, H. (2009) ‗The Paradox Of Synonimy of ―Increasing Return‖ And Economie Of Scale‘, Journal Of Social Science, 2(1), pp. 71–92.
[6]. Farrell, M. J. (1957) ‗The Measurement of Productive Efficiency‘, Journal of Royal Statistic Society, Series A : 253-81.
[7]. Gul, M. (2009) ‗Determination Of Technical Efficiency in Cotton growing Farm in Turkey: A Case Study Of Cukurova Region‘, African Journal Of Agricultural Research, 4(10), pp. 944–949.
[8]. Hallam, D. and Machado, F. (2014) ‗Efficiency analysis with panel data: A study of Portuguese dairy farms‘, Oxford Journals.
[9]. Hanggana, S. (2006) Prinsip Dasar Akuntansi Biaya. Surakarta: Mediatama.
[10]. Haryadi, A. (2011) Analisis Efisiensi Teknis Bidang Pendidikan (Penerapan Data Envelopment Analysis). Universitas Indonesia.
[11]. Karunarathna, M. and Wilson, C. (2017) ‗Agricultural biodiversity and farm level technical efficiency: An empirical investigation‘, Journal of Forest Economics. Elsevier GmbH., 29, pp. 38–46. doi: 10.1016/j.jfe.2017.08.002.
[12]. Kumbakhar, S. C. and Lovell, C. A. K. (2000)
Stochastic Frontier Analysis. Melburne: Cambridge University Press.
[13]. Kuncoro, M. (2004) Metode Penelitian Kuantitatif. Edited by P. LAtifah. Bandung: Remaja Rosdakarya Offset.
[14]. Kurniawan, A. Y. (2008) Analisis Efisiensi Ekonomi dan Daya Saing Usahatani Jagung Pada Lahan Kering di Kabupaten Tanah Laut Kalimantan Selatan. Institut PErtanian Bogor.
[15]. Li, N. et al. (2017) ‗Analysis of Agriculture Total-Factor Energy Efficiency in China Based on DEA and Malmquist indices‘, Energy Procedia. Elsevier B.V., 142, pp. 2397–2402. doi: 10.1016/j.egypro.2017.12.173.
[16]. Mardani, M. and Salarpour, M. (2015) ‗Measuring technical efficiency of potato production in Iran using robust data envelopment analysis‘, Science Direct, 2(INFORMATION PROCESSING IN AGRICULTURE), pp. 6–14.
[17]. Raheli, H. et al. (2017) ‗A two-stage DEA model to evaluate sustainability and energy efficiency of tomato production‘, Information Processing in Agriculture. China Agricultural University, 4(4), pp. 342–350. doi: 10.1016/j.inpa.2017.02.004.
[18]. Rochaeni, Soekarto, S. T. and Zakaria2, F. R. (2007) ‗Kajian Prospek Pengembangan Industri Kecil Tapioka di Sukaraja Kabupaten Bogor‘, Jurnal MPI, 2.
[19]. Salvatore (1997) Ekonomi Internasional. Edisi Keli. Jakarta: Prentice Hall-Erlangga.
[20]. Sukirno, S. (2000) Pengantar Teori Ekonomi Mikro. Jakarta: Raja Grafindo Persada.
[21]. Sulandari, A. (2011) Strategi Peningkatan Produksi Pada Nelayan Pancing Tonda di Perairan Teluk Prigi (Pelabuhan Perikanan Nusantara Prigi). Universitas Indonesia.
[22]. Syamsi, I. (2004) Efisiensi, Sistem, dan Prosedur Kerja. Jakarta: Bumi Aksara.
[23]. Toma, E., Dobre, Ca. and Elena, ion D. (2015) ‗DEA Applicability in Assessment of Agriculture Efficiency on Areas with Similar Geographically Patterns‘, Science Direct, V, pp. 704–711.
[24]. Toma, P. et al. (2017) ‗A non-parametric bootstrap-data envelopment analysis approach for environmental policy planning and management of agricultural efficiency in EU countries‘, Ecological Indicators. Elsevier, 83(August), pp. 132–143. doi: 10.1016/j.ecolind.2017.07.049.
159 Technology. Elsevier B.V., 8(Haicta), pp. 503–507.
doi: 10.1016/j.protcy.2013.11.067.
[26]. Waryanto, B., Chozin, M. and Intan, D. E. (2014) ‗Analisis Efisiensi Teknis, Efisiensi Ekonomis Dan Daya Saing Pada Usaha tani Bawang Merah Di Kabupaten Nganjuk-Jawa Timur: Suatu Pendekatan Ekonometrik Dan PAM.‘, Agroekonomic journal.
[27]. Widyatmoko, R. B. (2004) Faktor-faktor yang Mempengaruhi Jumlah Produksi Industri Tapioka di Propinsi Jawa Tengah. Universitas Gajah Mada.
[28]. Xiangzheng Deng (2018) ‗Improving Eco-Efficiency for The Sustainable Agricultural Production : A Case Study in Shandong, China‘, Science Direct.
[29]. Xue, H. and Li-li, Q. (2016) ‗Research on Efficiency of Financial Supports in Agricultural Industrialization in China‘, Journal of Northeast Agricultural University (English Edition), 23(2), pp. 78–81. doi: 10.1016/S1006-8104(16)30050-2.
Attachment 1. Sampel of DEA Output,
DMU TE SLACK Projection Prop. Projct.
Raw Area MC Lab Raw Area MC Lab
21 1 0 0 0 0 30 3,76 1000 20 0 12
1 0,85 0 0 0 -1 10,5 2,56 500 8 0,67 4,58