Student Perceptions Of Instructor Classroom
Management Practices
David Moen, University of South Dakota, USA Thomas Davies, University of South Dakota, USA De Vee Dykstra, University of South Dakota, USA
ABSTRACT
This paper summarizes the results from a study that was conducted of students at a midsized Midwestern doctoral-granting liberal arts university. Students were asked whether a hypothetical professor’s behavior in 42 described classroom scenarios was always, often, sometimes, rarely, or never appropriate. The purpose of the study is to provide guidance to professors in setting their own policies and procedures in managing their classes.
Keywords: instructor ethics; college student perceptions; classroom policies; fairness, academia; teaching
INTRODUCTION
rguably most of us, upon reflection, could identify one or more persons who significantly impacted our own lives. Most likely each of us, at least to some extent, have been influenced, either positively or negatively, through our dealings with others. Our own behavior and actions can likely be tied to what we have personally experienced or witnessed at some point during our past. We learn from interacting and watching others. We aspire to be more like those we respect and admire. We vow never to treat others the way we have been treated by some unscrupulous characters. Most of us have role models who we wish to emulate or mentors to whom we are indebted. We want to be like “Mikey,” the younger brother in the 1970’s Life® cereal commercial. Perhaps we, as educators, serve in that capacity for others. Perhaps we are fortunate to be “Mikey” to others.
Educators frequently play an important role in the lives of those who cross their paths. Professors are expected to be content experts who can transfer both their knowledge and passion for learning to those taking their classes. Yet the instructor’s reach can go beyond explaining the subject matter of the course. To perhaps some of their students, the academician takes on the added responsibility of unintentionally serving as one’s role model or intentionally becoming another’s mentor (Valentine & Kidwell, 2008; Colnerud, 2006; and Hansen, 2001). How the professor behaves, i.e., conducts him or herself in and out of the classroom, just might be as influential as the instructional strategies he or she utilizes.
Higher education continues to evolve, and what was typical even a few years ago may not be reflective of today’s learning environment. VanValey (2001) wrote about what he saw as two major shifts in the purpose of higher education. First, colleges and universities have become accessible to a broader and more diverse group of students. Once only available to the rich and elite, higher education is also now available to those making up the middle and lower classes. Second, higher education has become less academic and more businesslike. These changes have ethical implications for academicians.
According to VanValey (2001), today’s student body is less homogeneous than ever before, and thus “many of today’s students have not been exposed to the traditional norms and expectations of higher education regarding standards of performance, individual responsibility, plagiarism, cheating, fairness and respect for others (p. 6).” As a result, faculty need to be aware of this divergence of backgrounds when managing their classes. Specifically, “faculty members must not take for granted that students share, or even understand their own norms and expectations. More importantly, faculty members must not routinely apply their personal ethical standards
without taking into account the student’s situation and his or her cultural background (VanValey, 2001, p. 7).” Additionally, “it is particularly important that such standards of behavior be universally communicated and evenly applied to all students (VanValey, 2001, p. 7).” To this end, Kuther (2003) cites several “ethics across the curriculum” proponents who believe ethics must permeate the curriculum in order to show that it affects all aspects of life.
Roberts and Donahue (2000) believe the move to treat higher education more like a business has resulted in the de-professionalization of college faculty members. Yet Bruhn, Zajac, Al-Kazemi and Prescott (2002) have suggested that “academicians should exhibit a higher degree of professionalism and adhere to a more strict code of ethics than other professions (p. 465).” However, despite the existence of general statements of ethical responsibilities of faculty, “there are no universally recognized set of standards defining appropriate and inappropriate conduct on the part of faculty (Bruhn, Zajac, Al-Kazemi & Prescott, 2002, p. 463).” The frequently ambiguous principles of academic freedom (Association of American Colleges and Universities, 1940) can also be a source of some confusion as to what may or may not represent appropriate and protected behavior on the part of the professor. What is clear, according to Duplaga and Astani (2010) is that faculty need to be just when developing and implementing course policies and procedures.
Clearly much is riding on what happens in today’s college classrooms. Students commonly have the opportunity to evaluate the performance of their instructors at most colleges and universities today. As a result, student perceptions of what constitutes appropriate policies can impact how an instructor is rated, which can impact raise, promotion, tenure and contract renewal decisions (Tata, 1999; Marks, 2000, Rodabaugh & Kravitz, 1994; and Feldman, 1989). As important, in those cases where the professor truly does serve as a role model, perceived questionable practices can have a profound impact on what behavior young adults themselves view as acceptable when they venture out in the world. This study seeks to shed light on how students perceive the appropriateness of certain classroom management policies adopted by academicians.
Several prior studies have looked at student perceptions of the ethical behavior of professors. A well-known study by Keith-Spiegel, Tabachnick, and Allen (1993) identified several categories of unethical behaviors by faculty, including unethical and dishonest grading, unprofessional interaction with students, unprofessional classroom practices, and professional dishonesty. This paper further explores whether students find certain described classroom management practices appropriate. Whether they are viewed as being acceptable can, as has been discussed, have significant consequences.
METHODOLOGY
The authors described 42 classroom management practices, course policies, and faculty/student scenarios and asked respondents to a survey to indicate their perception of the degree of appropriateness. The survey was administered to students at a Midwestern mid-sized doctoral-granting liberal arts university. A total of 205 students completed the questionnaire. An earlier paper by the authors (Dykstra, Moen, and Davies 2008) discussed student perceptions of appropriate classroom policies of college professors with regard to adopting a described policy or practice. This paper focuses on the student perceptions concerning the degree of appropriateness for those same classroom management practices.
Specifically, respondents were given the following instructions: “Please indicate your assessment of the appropriateness of the hypothetical professor’s behavior or policy by checking the appropriate response.”
The degrees of appropriateness were defined as:
1. Always Appropriate (AA)
2. Often to Sometimes Appropriate (O/SA)
3. Rarely to Never Appropriate (R/NA)
were subsequently grouped into the six categories listed below for analysis, and have been renumbered to aid in their presentation for this paper. The scenarios are grouped into the following six categories (with the numeric references used in the subsequent discussion of the results):
1. grading policies and procedures 2. accessibility and availability policies
3. classroom management practices
4. attendance and participation rules 5. assignment, quiz and exam practices 6. differential treatment issues
In addition, the last part of the survey included a number of demographic questions. The following letters are associated with ten of the questions and correspond to the column headings found in Tables 1 and 2. Potential answers to these questions are shown in brackets.
G/UG: Whether they were a graduate or an undergraduate student
GP: What program they were in, if they were a graduate student [MBA/MBA-HSAD, MPA]
UM: What their major was, if they were an undergraduate student [accounting, management, and other]
UGL: What their undergraduate grade level was, if they were an undergraduate student [sophomore, junior, senior]
GPA: What range their overall grade point average fell in [3.51 – 4.00, 3.01 – 3.50, 3.00 or less]
G: Whether they were male or female
A: What age range they were in [21 or younger, 22 – 24, over 24] T/NT: Whether they were a traditional or a nontraditional student
PT: Whether they considered themselves to have an easy-going or competitive personality type EA: Whether or not they were involved in university-sponsored extracurricular activities
Using the responses from the 42 individual survey questions and the aforementioned demographic questions, two-way contingency tables were created to display the frequencies of the joint responses. Hypothesis tests were then performed in order to compare the counts of these categorical responses for independence; specifically, a chi-square test of independence was conducted. Statistical tests were run for each of the 42 scenarios to determine whether there were significant differences in responses based on an individual’s demographic response.
SUMMARY OF RESULTS
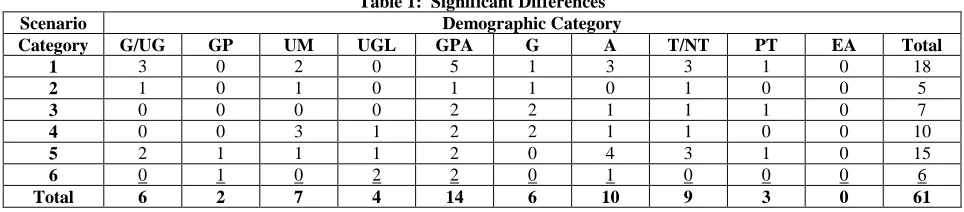
Overall, 61 statistically significant differences were found. These are described more fully below. As shown in the crosstabulation in Table 1, the following number of significant differences was observed by scenario category and demographic category.
Table 1: Significant Differences Scenario Demographic Category
Category G/UG GP UM UGL GPA G A T/NT PT EA Total 1 3 0 2 0 5 1 3 3 1 0 18
2 1 0 1 0 1 1 0 1 0 0 5
3 0 0 0 0 2 2 1 1 1 0 7
4 0 0 3 1 2 2 1 1 0 0 10
5 2 1 1 1 2 0 4 3 1 0 15
6 0 1 0 2 2 0 1 0 0 0 6
Total 6 2 7 4 14 6 10 9 3 0 61
tests for each scenario by demographic category. As mentioned earlier, the scenarios are presented in the Appendix. A single asterisk (*) indicates a 0.10 level of significance, two asterisks (**) indicate a 0.05 level of significance, and three asterisks (***) indicate a 0.01 level of significance.
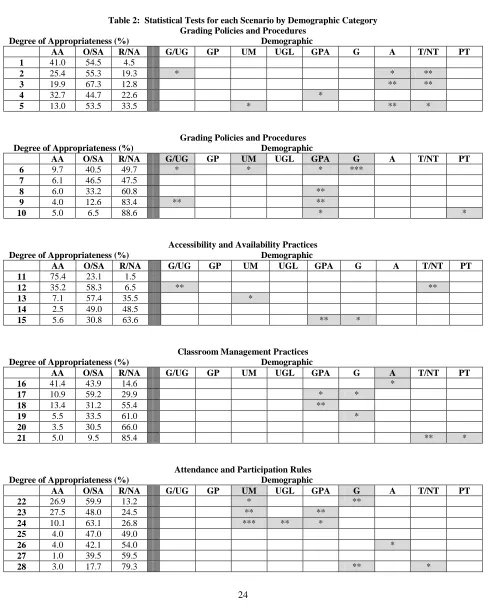
Table 2: Statistical Tests for each Scenario by Demographic Category Grading Policies and Procedures
Degree of Appropriateness (%) Demographic
AA O/SA R/NA G/UG GP UM UGL GPA G A T/NT PT 1 41.0 54.5 4.5
2 25.4 55.3 19.3 * * **
3 19.9 67.3 12.8 ** **
4 32.7 44.7 22.6 *
5 13.0 53.5 33.5 * ** *
Grading Policies and Procedures Degree of Appropriateness (%) Demographic
AA O/SA R/NA G/UG GP UM UGL GPA G A T/NT PT
6 9.7 40.5 49.7 * * * ***
7 6.1 46.5 47.5
8 6.0 33.2 60.8 **
9 4.0 12.6 83.4 ** **
10 5.0 6.5 88.6 * *
Accessibility and Availability Practices Degree of Appropriateness (%) Demographic
AA O/SA R/NA G/UG GP UM UGL GPA G A T/NT PT 11 75.4 23.1 1.5
12 35.2 58.3 6.5 ** **
13 7.1 57.4 35.5 *
14 2.5 49.0 48.5
15 5.6 30.8 63.6 ** *
Classroom Management Practices Degree of Appropriateness (%) Demographic
AA O/SA R/NA G/UG GP UM UGL GPA G A T/NT PT
16 41.4 43.9 14.6 *
17 10.9 59.2 29.9 * *
18 13.4 31.2 55.4 **
19 5.5 33.5 61.0 *
20 3.5 30.5 66.0
21 5.0 9.5 85.4 ** *
Attendance and Participation Rules Degree of Appropriateness (%) Demographic
AA O/SA R/NA G/UG GP UM UGL GPA G A T/NT PT
22 26.9 59.9 13.2 * **
23 27.5 48.0 24.5 ** **
24 10.1 63.1 26.8 *** ** *
25 4.0 47.0 49.0
26 4.0 42.1 54.0 *
27 1.0 39.5 59.5
Assignment, Quiz and Exam Practices Degree of Appropriateness (%) Demographic
AA O/SA R/NA G/UG GP UM UGL GPA G A T/NT PT
29 41.4 52.5 6.1 ** *
30 22.5 60.5 17.0 *
31 22.3 48.7 28.9 *** *
32 13.6 50.3 36.2 **
33 5.0 46.5 48.5
34 5.0 46.7 48.2 ** ** **
35 6.0 32.5 61.5 * ** **
36 5.5 34.0 60.5 *** *** ***
Differential Treatment Issues Degree of Appropriateness (%) Demographic
AA O/SA R/NA G/UG GP UM UGL GPA G A T/NT PT
37 9.5 51.5 39.0 * **
38 9.5 43.5 47.0 * *** **
39 7.1 41.1 51.8
40 7.4 26.6 66.0
41 5.5 24.6 69.8 **
42 3.0 8.5 88.6
As mentioned, in total, 61 tests resulted in statistically significant differences. Twenty-seven of these tests were significant at 0.10, another 27 were significant at 0.05, and 7 were significant at the 0.01 level of significance. The seven tests that were significant at the 0.01 level in Table 2 are highlighted in the discussion that follows.
Results by Respondent’s Status as an Undergraduate or A Graduate Student
Consider the responses to scenario 31 found in the assignment, quiz, and exam practices category. The scenario states, “The professor allows all students the same amount of time to complete an examination, even those with unregistered but likely disabilities.” Approximately 29% of all respondents to this scenario indicated that this practice was rarely to never appropriate. However, 54.5% of the graduate students responded that this practice was rarely to never appropriate, while only 23.6% of the undergraduate students provided that same response. That is, graduate students responded more than what would have been expected under the assumption of independence that this practice was rarely to never appropriate, while undergraduate students tended to respond differently. (p-value = .002)
Results by Respondent’s Undergraduate Major
Consider the responses based on undergraduate major to scenario 24 found in the attendance and participation rules category. The scenario states, “Adhering to announced course policy, the professor randomly (using shuffled note cards) calls on students each class session. The professor occasionally skips calling on selected students who are regularly prepared.” Overall, 26.8% of all respondents to this scenario indicated that this behavior was rarely to never appropriate. Only 16.3% of the accounting majors, however, indicated that the behavior was rarely to never appropriate, while 38.9% of the students with a major other than accounting or management responded that the behavior was rarely or never appropriate. In this case, accounting majors responded less than what would have been expected that this behavior was rarely or never appropriate, while students with majors other than accounting or management tended to respond differently.
(p-value = .004)
Results by Respondent’s Undergraduate Grade Level
penalizes students for excessive unexcused absences. Since the professor believes fraternity and sorority members are in general given preferential treatment, all absences relating to participation in University-sponsored Greek events are not excused.” Only 9.5% of all respondents to this scenario indicated that this behavior was always appropriate; however, 28.6% of the sophomores responded that this behavior was always appropriate. In contrast, only 4.8% of the juniors and 5.5% of the seniors provided an “always appropriate” response to this scenario. That is, sophomores responded more that what one would have expected that this behavior was always appropriate, while juniors and seniors tended to respond differently. (p-value = .004)
Results by Respondent’s Gender
Consider next the responses based on the respondent’s gender to scenario 6 found in the grading policies and procedures category. The scenario states, “The professor does not require those students who suffer a tragedy near the end of the semester to take the final exam.” Almost half of all respondents to this scenario (49.7%) indicated that this behavior was rarely to never appropriate, while only 9.7% of all respondents indicated that the behavior was always appropriate. However, 15.2% of the men indicted that the behavior was always appropriate, but only 2.3% of the women provided that same response. That is, men responded more than what would have been expected that this behavior was always appropriate, while women tended to respond differently. (Under the assumption of independence, both the men and women responded as one would have expected that this behavior was rarely to never appropriate, 49.5% and 51.7% respectively.) (p-value = .007)
Scenario 36 was significant at the 0.01 level of significance for three demographics, namely, overall grade point average (GPA), age (A), and whether a student was a traditional or a nontraditional student (T/NT). Scenario 36 is found in the assignment, quiz and exam practices category, and it states, “The professor teaches two sections of the same class. One section meets three times a week during the day for 50 minutes each session, and includes mostly full-time traditional students. The other section is a night class that meets once a week for two and one-half hours each time, and consists mostly of nontraditional part-time students who work full-time. The professor requires the daytime students to turn in homework, but does not require the same of the evening students.” Only 5.5% of all respondents to this scenario indicated that this practice was always appropriate, while 34.0% responded that this practice was often to sometimes appropriate, and 60.5% responded that it was rarely to never appropriate. The differences based on the three demographics are highlighted in the next three paragraphs.
Results by Respondent’s Grade Point Average
Students with an overall grade point average of 3.00 or less were more likely to respond than what would have been expected that the practice described in scenario 36 was always appropriate (14.8%), and they were less likely to respond that the practice was rarely or never appropriate than what one would expect (40.7%) Students with either a 3.01 – 3.50 or 3.51 – 4.00 overall grade point average were more likely to respond than what would have been expected that the practice was rarely or never appropriate (69.4% and 65.8% respectively). (p-value = .001)
Results by Respondent’s Age
Students in the 21 or younger age grouping were less likely to indicate that the practice described in scenario 36 was often or sometimes appropriate (21.8%), and they were more likely to indicate that the practice was rarely or never appropriate (70.5%). In contrast, students in the over 24 age grouping were more likely to indicate that the practice was often or sometimes appropriate (52.9%), and they were less likely to indicate that the practice was rarely or never appropriate (41.2%). (Students in the 22 – 24 age grouping responded as one would expect if there was no response difference by age grouping.) (p-value = .005)
Results Depending on Whether a Respondent was a Traditional or A Non-traditional Student
sometimes appropriate (49.2%), and they were less likely to indicate that the practice was rarely or never appropriate (44.4%). Since traditional students are typically younger in age, while non-traditional students are somewhat older, these results correspond to the findings based on a respondent’s age in the previous paragraph. (p-value = .005)
CONCLUSION
The results of this study provide valuable information for academicians to use for selection and implementation of course policies and procedures. It is clear that students with different backgrounds and educational status do have differing perceptions about the degree of appropriates of certain classroom management policies and procedures adopted by academicians. Several demographic differences help explain the majority of variation in what students find to be most appropriate or inappropriate. For example, this study’s results indicate that nontraditional students, students over 24 years of age and those with lower GPAs are more likely to consider appropriate, differential treatment with respect to homework required of part-time students working full time. GPA, age and traditional/nontraditional status were three key demographics in which significant differences related to the degree of appropriateness for selected classroom management policies and procedures were found. The student’s involvement in university-sponsored extracurricular activities was not a significant demographic, while undergraduate program of study and personality type demographics resulted in a few reported differences. Understanding how different groups of students may respond to different practices may help the academician avoid practices that will cause students to react in a negative fashion, which should, as Morgan and Korschgen (2001) suggest, “improve the quality of the classroom interaction, and consequently, student learning (p. 421).” It may also ultimately improve student evaluation of the faculty member’s teaching and courses, and, at the same time result in the academician serving as a positive ethics role model.
AUTHOR INFORMATION
David Moen is a Professor of Decision Sciences and also serves as the Chairperson for the Division of Economics and Decision Sciences. He received his Ph.D. in statistics from Oklahoma State University in 1983. He teaches courses in business statistics, and his primary research interests include the Bayesian analysis of switching linear models and innovative statistical education. Professor Moen has received the Belbas-Larson Award for Excellence in Teaching, the University’s highest teaching award.
Thomas Davies is a Professor of Accounting and also serves as Associate Dean of the Beacom School of Business and Chairperson of the Division of Accounting and Finance. He received his LL.M. from the University of Missouri-Kansas City in 1992 and is a Certified Public Accountant. He teaches tax courses, and his primary research interests include tax complexity and ethics.
De Vee Dykstra is a Professor of Business Law in the Division of Marketing, Management and Law at the Beacom School of Business, University of South Dakota. She received her J.D. from the University of South Dakota and teaches courses in law, real estate and ethics. Professor Dykstra has also received the University’s Belbas-Larson Award for Excellence in Teaching.
REFERENCES
1. Association of American Colleges and Universities (AAUP). (1940). 1940 Statement of Principles on Academic Freedom and Tenure.
2. Bruhn, J.G., Zajac, G., Al-Kazemi, A.A., and Prescott, L.D., Jr. (2002). Moral positions and academic conduct: Parameters of tolerance for ethics failure. The Journal of Higher Education, 73(4), 461-493. 3. Colnerud, G. (2006). Teacher ethics as a research problem: Syntheses achieved and new issues. Teachers
and Teaching: Theory and Practice, 12(3), 365-385.
4. Duplaga, E. & Astani, M. (2010). An exploratory study of student perceptions of which classroom policies are fairest. Decision Sciences Journal of Innovative Education, 8(1), 9-33.
6. Feldman, K. A. (1989). The association between student ratings of specific instructional dimensions and student achievement: Refining and extending the synthesis of data from multisection validity studies. Research in Higher Education, 30, 583-645.
7. Hansen, D. (2001). Teaching as a moral activity, in: V. Richardson (Ed.). Handbook of Research on Teaching, Washington, D.C., American Educational Research Association.
8. Keith-Spiegel, P.C., Tabachnick, B.G., & Allen, M. (1993). Ethics in academia: Students’ view of professors’ actions. Ethics & Behavior, 3, 149-162.
9. Kuther, T. (2003). A profile of the ethical professor: Student views. College Teaching, 51, 153-160. 10. Marks. R.B. (2000). Determinants of student evaluations of global measures of instructor and course value.
Journal of Marketing Education, 22(2), 108-119.
11. Morgan, B.L., & Korschgen, A. J. (2001). The ethics of faculty behavior: Students’ and professors’ views. College Student Journal, 35, 418-422.
12. Roberts, K. & Donahue, K. (2000). Professing professionalism: Bureaucratization and deprofessionalization in the academy, Sociological Focus, 33(4), 365-83.
13. Rodabaugh, R C., & Kravitz, D.A. (1994). Effects of procedural fairness on student judgments of professors. Journal on Excellence in College Teaching, 5(2), 67-84.
14. Tata, J. (1999). Grade distributions, grading procedures, and students’ evaluations of instructors: A justice perspective. The Journal of Psychology, 133(3), 263-271.
15. Valentine, S. & Kidwell, R. (2008). Business students’ ethical evaluations of faculty conduct. Quality Assurance in Education, 16(3), 387-300.
APPENDIX
Grading Policies and Procedures
1. The professor allows students to keep all graded exams, and commonly includes some of the old test questions on the final exam. Prior to the final, the professor comments in class that a good way for students to study for the exam is to review old test material.
2. The professor allows students to keep all graded exams, and commonly includes some of the old test questions on the final exam. The professor mentions to students who stop by seeking individual help for the final that a good way to study is to review old exams.
3. The professor awards extra-credit points to students who attend “extra” events such as research presentations and seminars conducted by invited professionals, even though not all students can attend due to class or work conflicts, etc.
4. The professor consistently and uniformly adheres to the (written) policy that in no event and under no circumstances will any student be allowed to earn extra credit.
5. The professor generally requires students to take the final exam when scheduled. Students who miss the test because of travel plans are given an “Incomplete” grade, and are allowed to take a make-up test after they return.
6. The professor does not require those students who suffer a tragedy near the end of the semester to take the final exam.
7. The professor requires all students to take the final exam when scheduled. Students who miss the test because of travel plans are given a zero, and are not allowed to take a make-up test either before they leave or after they return.
8. The professor has no written policy regarding extra credit work and makes no mention of a policy in class. Unbeknownst to the rest of the class, however, the professor gives the opportunity to earn extra points to students who ask.
9. The professor teaching the second of two required sequential courses agrees to pass a failing student who has failed the class previously and who promises not to take any advanced classes in the discipline.
10. The professor agrees to pass a failing student as long as the student agrees to not take a class from the professor again.
Accessibility/Availability Policies
11. The professor announces a job opportunity to the entire class. 12. The professor agrees to be a job reference for any student who asks.
13. The professor provides extra tutoring for student athletes outside of regular classroom hours. 14. The professor announces a job opportunity to only a select few good advisees.
15. The professor answers out-of-classroom questions only during posted office hours, even though not all students can meet during those times.
Classroom Management Practices
16. The professor provides donuts for students attending the regularly scheduled 8:00 a.m. class session every Friday morning.
17. Whenever students carry on a conversation during class, the professor makes a point of calling on them to inquire as to what they are visiting about.
18. The professor provides refreshments to students on the day of the teaching evaluation.
19. The professor never makes class notes, transparencies, etc. available to students, even those who have an excused absence.
20. The professor requires students to work in teams when completing class projects. Student teams are required to regularly meet outside of normal class time to work on assignments. Because of these mandatory work sessions, students sometimes have to miss other classes or other scheduled events such as examinations which necessitates make-up tests in other courses.
Attendance/Participation Rules
22. The professor does not specifically give students points for class participation, but gives the benefit of the doubt to above-average participating students when deciding borderline final grades.
23. The professor does not require class attendance, so students are not penalized for skipping class no matter how many sessions they miss.
24. Adhering to announced course policy, the professor randomly (using shuffled note cards) calls on students each class session. The professor occasionally skips calling on selected students who are regularly prepared. 25. Adhering to announced course policy, the professor randomly (using shuffled note cards) calls on students each class session. The professor occasionally skips calling on selected students who don’t appear to be prepared.
26. The professor teaches two sections of the same class, one during the day (three 50 minute sessions each week) and another at night (one 150 minute weekly session). The professor does not require attendance in the day section. However, night-time students are penalized for absences because the professor believes these students cannot afford to miss so much class time.
27. The professor regularly uses the Socratic method in class to cover material assigned for the day. The professor repeatedly calls on the same “suspect” students to ensure that they are adequately preparing for class and skips those who the professor believes are good students.
28. The professor, who has a strict written attendance policy, only applies it to lower the grade of those students perceived as not working hard enough in the course.
Assignment, Quiz, Exam Practices
29. The professor gives students the option of throwing out their low exam score.
30. The professor adopted a policy that exempts those students with A’s in the class from taking the comprehensive final exam.
31. The professor allows all students the same amount of time to complete an examination, even those with unregistered but likely disabilities.
32. The professor has a written policy prohibiting make-up quizzes, but occasionally allows some absent students who have a good excuse to take them late.
33. The professor does not allow students who miss an exam to take a make-up test. Instead, the professor follows the policy of weighting the next test, or the final, more heavily.
34. The professor does not allow students to make up a quiz or turn in homework late, irrespective of the reason why the student failed to comply with the given task.
35. The professor teaches two sections of the same class. One sections meets three times a week during the day for 50 minutes each session, and includes traditional students. The other section is a night class that meets once a week for two and one-half hours each time, and consists mostly of nontraditional students. The professor uses identical examinations in both sections, giving students their respective regular class period to complete the test. The professor’s rationale is that students in the night class need additional time to complete the test because they generally have less time to study.
36. The professor teaches two sections of the same class. One section meets three times a week during the day for 50 minutes each session, and includes mostly full-time traditional students. The other section is a night class that meets once a week for two and one-half hours each time, and consists mostly of nontraditional part-time students who work full-time. The professor requires the daytime students to turn in homework, but does not require the same of the evening students.
Differential Treatment Issues
37. The professor allows international students having English as a second language more time to complete exams than what is allowed the other students.
39. The professor invites selected student leaders, some of whom are currently enrolled in the professor’s class, to dinner at the professor’s home as a way to keep abreast of general student concerns.
40. The professor has no stated policy regarding extra credit work. The professor does, however, give a failing student (of the opposite sex) who needs the class to graduate the opportunity to earn additional points by doing extra assignments.
41. The professor allows student athletes additional time to complete examinations since they frequently have more absences than other students.