CEO Overconfidence And
The Effectiveness Of Internal
Control Over Financial Reporting
Jong Eun Lee, Sungkyunkwan University, South Korea
ABSTRACT
In this study, I investigate the association between overconfidence, a cognitive bias of chief executive officers (CEOs), and the existence of internal control weaknesses (ICWs). As suggested in the prior finance literature on the negative impact of CEO overconfidence on corporate policy, overconfident CEOs could disregard the importance of internal control over financial reporting (ICFR), which could negatively affect the firm’s investment for infrastructure to implement effective financial reporting information system (FRIS) and result in less reliable financial information. Empirical test results show that CEO overconfidence is positively associated with the existence of ICWs, particularly with ICWs related to insufficient accounting personnel or ineffective FRIS. Those ICWs subsequently lead to lower earnings quality, higher absolute value of discretionary accruals and lower quality of accruals. Furthermore, potentially negative consequences of CEO overconfidence to the effectiveness of ICFR could downgrade investors’ confidence in the credibility of financial statements.
Keywords: CEO Overconfidence; Material Weaknesses; SOX 404
INTRODUCTION
n this study, I investigate how CEO overconfidence, a cognitive bias, influences the effectiveness of internal control over financial reporting (ICFR) using disclosures of internal control weaknesses (ICWs) under Section 404(b) of the Sarbanes–Oxley Act of 2002 (SOX). Since the enactment of SOX, accounting academics have rigorously investigated a variety of issues (e.g., economic determinants of the existence of ICWs) related to internal control disclosure requirements under SOX Section 302 or 404 (see Schneider et al. (2009) for a review). Given that management is responsible for establishing and maintaining effective ICFR, a CEO’s characteristics, such as personality and educational background, are likely perceived as critical to establishing and maintaining such internal controls. However, prior literature primarily investigates the characteristics of firms that disclose ICWs. Little research exists on the relationship between a CEO’s characteristics and the effectiveness of ICFR. Thus, this study fills the gap by examining the association between a CEO’s personal characteristics such as overconfidence and the disclosure of ICWs.
Under SOX Section 302, CEOs are responsible for establishing and maintaining effective ICFR, are required to evaluate the effectiveness of ICFR, and must report any identified internal control deficiencies on a quarterly basis.1 In addition, SOX Section 404(a) requires CEOs to evaluate, and provide an annual management report on the effectiveness of their firms’ ICFR. Simultaneously, without regard to the management report, under SOX Section 404(b), the firm’s external auditor is required to independently evaluate the effectiveness of its client’s ICFR and issue an annual report with its opinion on this effectiveness.2 Since the adoption of the disclosure requirement on ICFR effectiveness, a variety of relevant studies have been conducted. Several studies (e.g., Ogneva et al., 2007; Chan et al., 2009; Ashbaugh-Skife et al., 2009) show that ICWs produce lower financial reporting quality, such as
1 Section 302 became effective in August 2002.
2 Section 404 became effective for accelerated filers from the fiscal year beginning on or after November 15, 2004. Although
non-accelerated filers have complied with Section 404(a) from the fiscal year beginning on or after December 15, 2007, Dodd-Frank Wall Street Reform and Consumer Protection Act of 2010 permanently exempted non-accelerated filers from Section 404(b), internal control audits (U.S. House of Representatives 2010).
higher absolute discretionary accruals and cost of equity. This result suggests that ICFR effectiveness is one of the most important factors affecting firms’ financial reporting quality. A few studies empirically investigate the economic determinants that affect the existence of ICWs using a sample of firms that disclosed ICWs under SOX Sections 302 and/or 404. For instance, Doyle et al. (2007a) and Ashbaugh-Skife et al. (2007) find that firms that have smaller size, greater financial risk, a complex operating environment, faster growth, and recent restructuring are more likely to have ICWs after controlling for factors that affect the disclosure of the identified ICWs. By expanding on prior studies that examine the factors that affect the existence of ICWs, in this study, I test the association between CEO overconfidence and the existence of ICWs, and focus in particular on ICWs related to staffing (i.e., lack of accounting/internal control personnel) or an ineffective financial reporting information system (FRIS). The empirical test results provide evidence on the effect of CEO overconfidence on the effectiveness of ICFR and their investment of an appropriate level of resources to establish and maintain effective ICFR.
Although CEOs are perceived as playing a critical role in ICFR effectiveness, recent accounting and finance literature on CEO overconfidence reports a negative impact of CEO overconfidence on corporate policies, such as investment decisions, accounting conservatism, and earnings management. For instance, Malmendier and Tate (2005) show that overconfident CEOs create inefficiencies in corporate investments. Ahmed and Duellman (2012) report that CEO overconfidence is negatively correlated with accounting conservatism. Moreover, Schrand and Zechman (2011) document that overconfident CEOs are more likely to be involved in earning management to cover up actual poor firm performance relative to their expectations, which was originally set up too optimistically. Therefore, when we consider that effective ICFR is the foundation for ensuring that accounting information from the financial reporting system is provided on a timely basis and is reliable, how CEO overconfidence—a psychological trait—affects the CEO’s role in establishing and maintaining effective ICFR is an important and interesting research question. In this study, I argue that CEO overconfidence is positively correlated to the existence of internal control deficiencies. This argument is primarily based on the findings of Schrand and Zechman (2011), who state that overconfident CEOs are more optimistic about their firm’s future performance. Their study also finds that, for firms whose actual performance is not anticipated to meet expectations, overconfident CEOs are more likely to conduct earning management to meet or beat such expectations. Because effective ICFR is more likely to deter overconfident CEOs’ earnings management, such CEOs may be less motivated to ensure effective ICFR. In addition, overconfident CEOs may pay less attention to the effectiveness of ICFR because they are more focused on overoptimistic future firm performance. Therefore, I posit that firms with overconfident CEOs are more likely to have ICWs that will subsequently be disclosed under Section 404(b) by their auditors.
For the test, I use the same proxy for CEO overconfidence as that used in Schrand and Zechman (2011), where the variable for CEO overconfidence is measured at the firm level. Consistent with the previous prediction, for the sample firms that disclose ICWs under SOX Section 404(b) during 2004–2011, I find that CEO overconfidence is significantly and positively correlated with the existence of ICWs, after controlling for factors that affect internal control risk, such as firm size, financial risk, operating complexity, potential growth, and recent restructuring. Further analysis of the relationship between CEO overconfidence and types of ICWs shows that CEO overconfidence is significantly and positively associated with ICWs related to a lack of accounting personnel or ineffective FRIS. In addition, firms that disclose staffing- or FRIS-related ICWs have higher absolute value of discretionary accruals. Collectively, these results suggest that overconfident CEOs are less likely to establish and maintain effective ICFR. Moreover, the results implicitly indicate that the negative association between CEO overconfidence and ICWs is attributable to lower investment in the ICFR infrastructure, such as accounting personnel or FRIS, subsequently producing lower quality of financial reporting.
LITERATURE REVIEW AND HYPOTHESIS DEVELOPMENT
Prior Literature Review
CEO Overconfidence
Overconfidence, a cognitive bias, is described as a psychological bias of overestimating the future outcomes of current events. Overconfidence is primarily formed from the “better-than-average effect” (Svenson, 1981), which is the tendency for humans to think of themselves as “above average.” However, future outcomes overestimated by overconfident CEOs may be unrealistically too optimistic, which could negatively affect firms’ corporate policies or financial reporting decisions.
Accordingly, Malmendier and Tate (2005) show that overconfident CEOs lead to lower investment efficiency. Malmendier and Tate (2008) also show that CEO overconfidence is positively associated with value-destroying mergers and acquisitions. In addition, Deshmukh et al. (2013) report that firms with overconfident CEOs are more likely to pay lower dividends. As a recent relevant study in the accounting literature, Schrand and Zechman (2011) use a 49-AAER sample and find that overconfident managers are more likely to engage in fraudulent financial reporting to meet or beat their overoptimistic earnings expectations. Additionally, Ahmed and Duellman (2012) document that firms with overconfident CEOs are less conservative with timely recognitions of losses. Presley and Abbott (2013) report that overconfident CEOs are more likely to restate previously reported financial statements. To summarize, relevant prior studies provide evidence that CEO overconfidence is negatively associated with a firm’s financial reporting quality through earnings management, accounting conservatism, and the restatement of previously reported financial statements.
Internal Control Weaknesses
Since the enactment of SOX Sections 302 and 404, accounting literature has extensively investigated the association between the disclosure requirement and the financial reporting system: the characteristics of firms disclosing ICWs or the consequences of disclosed ICWs. Studies on the presence of ICWs reveal that business complexity, sales growth, operating loss, bankruptcy risk, auditor change, or auditor size is positively associated with the existence of ICWs (Ge and McVay, 2005; Ashbaugh-Skife et al., 2007; Doyle et al., 2007a; Krishnan and Visvanathan, 2007; Ogneva et al., 2007; Zhang et al., 2007; Bedard et al., 2009). Meanwhile, firm size, return on assets, or firm age is negatively associated with the presence of ICWs (Ge and McVay, 2005; Ashbaugh-Skife et al., 2007; Doyle et al., 2007a; Krishnan and Visvanathan, 2007; Ogneva et al., 2007). Additionally, Krishnan and Visvanathan (2007) and Hoitash et al. (2009) show that the presence of ICWs is positively associated with the number of audit committee meetings but negatively associated with the proportion of accounting financial experts on audit committees.
In addition, extensively investigated are the consequences of disclosed ICWs. The relevant study primarily examines the association between the existence of ICWs and earnings quality, market reaction, cost of debt (equity), or earnings forecasts. Doyle et al. (2007b) show that firms with material weaknesses over ICFR have lower cash flow predictability, higher discretionary accruals, lower accruals quality, more frequent historical earnings restatements, or lower earnings persistence. Using disclosures under Section 404, Ogneva et al. (2007) and Chan et al. (2009) report that firms with material weaknesses in ICFRs have more absolute discretionary accruals. Ashbaugh-Skife et al. (2008) document that firms with ICWs have larger absolute total and working accruals, and firms that remediate their identified material weaknesses in ICFRs report improved accruals quality. Furthermore, markets react adversely to the disclosure of ICWs under Section 302 or 404 (Beneish et al., 2008; Hammersley et al., 2008; Ashbaugh-Skife et al., 2009; Kim and Park, 2009). Additionally, Ashbaugh-Skife et al. (2009) report that firms with ICWs have higher costs of equity. Feng et al. (2009) show that firms with material weaknesses in ICFR under Section 404 have less accurate management forecasts.
Hypothesis Development
As previously discussed, SOX Section 302 explicitly proscribes that CEOs are responsible for establishing and maintaining effective ICFR, and disclosures of ICWs negatively affect financial reporting quality. Additionally, markets and financial analysts adversely perceive disclosure of ICWs. To summarize, CEOs are at the center of the relation between effective ICFR and financial reporting quality, suggesting that CEO overconfidence affects the effectiveness of a firm’s ICFR. In this study, I expect that overconfident CEOs are more likely to knowingly or unknowingly place less emphasis on the importance of ICFR effectiveness.
On the one hand, overconfident CEOs may unknowingly disregard the importance of effective ICFR. Using evidence from a prior study that finds that CEO overconfidence—a cognitive bias—primarily adversely affects firm value through inefficiencies in investment outcomes or value-destroying mergers and acquisitions, I argue that overconfident CEOs are likely to pay less attention to the importance of effective ICFR compared with non-overconfident CEOs because of too strong a focus on their overoptimistic future performance. On the other hand and more importantly, as documented in Schrand and Zechman (2011), overconfident CEOs are more likely to be involved in earning management to beat or meet their overoptimistic earnings forecasts. This finding suggests that overconfident CEOs are less likely to be motivated to establish and maintain effective internal controls considering that effective ICFR is more likely to deter earnings management efforts by such CEOs.
Therefore, I hypothesize as follows (at the alternative form).
Hypothesis 1: CEO overconfidence is positively associated with the existence of internal control weaknesses. Next, I use types of ICWs to examine the impact of CEO overconfidence on investments in ICFR effectiveness. Overall, material weaknesses exist at the account (transaction) level and at the company level. Account-level material weaknesses represent those caused by a lack of controls over accounting, documentation, or applications of specific accounts or transactions, such as accounts receivables and inventories. Company-level material weaknesses are those that affect the overall effectiveness of ICFR, such as insufficient staffing in charge of the financial reporting system and ineffective FRIS. Consistent with the reasoning in Hypothesis 1, I expect that overconfident CEOs are less likely to invest adequate resources to establish and maintain effective ICFR. Such a lack of investment in ICFR infrastructure is more likely to cause company-level material weaknesses related to staffing or ineffective FRIS.
Therefore, I hypothesize as follows (at the alternative form).
Hypothesis 2: CEO overconfidence is negatively associated with investments that establish and maintain effective internal control over financial reporting.
Lastly, I reinvestigate the financial reporting quality of firms whose overconfident CEOs fail to invest sufficient resources to establish and maintain effective ICFRs compared with firms with non-overconfident CEOs and effective ICFRs. Prior literature (e.g., Doyle et al., 2007b; Ogneva et al., 2007; Chan et al., 2009; Ashbaugh-Skife et al., 2009) provides collective evidence that firms disclosing internal control deficiencies are more likely to have inferior financial reporting quality, such as higher discretionary accruals, lower accruals quality, more historical earnings restatements, lower earnings persistence, or higher costs of equity. In addition, insufficient investments in the infrastructure of effective ICFR primarily result in company-level material weaknesses that more severely affect financial reporting quality than account-level material weaknesses.
Taken together, I expect that firms with overconfident CEOs that fail to make adequate investments for effective ICFR are more likely to produce lower earnings quality.
Hypothesis 3: Compared with firms with non-overconfident CEOs and that disclose no internal control deficiencies, firms with overconfident CEOs who fail to appropriately invest their resources to establish and maintain effective internal control over financial reporting are more likely to have lower earnings quality.
RESEARCH DESIGN
To test the hypotheses of the impact of managerial overconfidence on the existence of ICWs or infrastructure investments for effective ICFR, I use the following logit model.
ICW (or Staffing/FRIS)it=β0+β1*CEO_OCit+β2*Foreign_OPit+β3*M&Ait +β4*Restructureit+β5*Salesgrowthit+β6*Sizeit+β7*Lossit +β8*Bankzit+β9*Restatementit+β10*Big 4it
+β11*Litigation riskit+ εit (1) where:
ICW = coded 1 if a firm discloses internal control weaknesses under SOX Section 404(b), and 0 otherwise. Staffing = coded 1 if a firm discloses internal control weaknesses related to staffing (i.e., a lack of accounting/internal
control personnel) under SOX Section 404(b), and 0 otherwise.
FRIS = coded 1 if a firm discloses internal control weaknesses related to ineffective financial reporting information system under SOX Section 404(b), and 0 otherwise.
CEO_OC = coded 1 if the CEO of a firm is overconfident, and 0 otherwise. Foreign_OP = coded 1 if a firm operates a foreign operation, and 0 otherwise. M&A = coded 1 if a firm is involved in a merger or acquisition, and 0 otherwise. Restructure = coded 1 if a firm is involved in a restructuring, and 0 otherwise.
Salesgrowth = growth rate in sales, measured as (sales in the current fiscal year-sales in the previous fiscal year)/sales in the previous fiscal year,
Size = coded 1 if a firm reports net loss for the previous fiscal year, and 0 otherwise Loss = coded 1 if a firm reports net loss for the current fiscal year, and 0 otherwise
Bankz = bankruptcy score (Zmijewski 1984), measured as -4.803-3.599*(net income/total assets)+5.406*(total liabilities/total assets)-0.100*(current assets/current liabilities)
Restatement = coded 1 if a firm reports that they restated previously issued financial statements in the current fiscal year, and 0 otherwise
Big4 = coded 1 if a firm’s auditor is one of PWC, EY, Deloitte, KPMG, and 0 otherwise.
Litigation risk = coded 1 if a firm belongs to a litigious industry-SIC code 2833 to 2836, SIC code 3570 to 3577, SIC code 3600 to 3674, SIC code 5200 to 5961, SIC code 7370 to 7374, or SIC code 8731 to 8734, and 0 otherwise.
In Model (1), CEO_OC, a proxy for CEO overconfidence, is measured using firm characteristics based on Schrand and Zechman (2011). CEO_OC, a time-invariant measure, is measured at the firm level using five components from the study of Schrand and Zechman (2011): 1) excess investment, 2) net acquisition, 3) debt-to-equity ratio, 4) risk debt, and 5) dividend yield.3 The first three components are equal to 1 if each measure is in the top quartile of firms in a certain three-digit SIC code for a year. The last two components, risk debt and dividend yield, equal 1 if a firm uses risk debt or does not pay a dividend, respectively. The measurement procedure is as follows. First, CEO_OC_firm_based is set to 1 if the sum of the five dummy variables previously described is greater than 2 in a year. The use of CEO overconfidence measures (e.g., Schrand and Zechman, 2011) at the firm level is rationalized because prior studies on CEO overconfidence documents that CEO overconfidence is positively correlated with excessive investments (e.g., Malmendier and Tate, 2005, 2008; Ben-David et al., 2007), a value-destroying merger and acquisition (e.g., Malmendier and Tate, 2008), preference for debt over equity (e.g., Heaton, 2002; Hackbarth, 2008) or long-term risky debt (e.g., Malmendier et al., 2011; Ben-David et al., 2007), and is negatively correlated with dividend payment (e.g., Ben-David et al., 2007).
Using CEO_OC_firm_based as previously measured for CEO overconfidence, I create a test variable, CEO_OC, following Malmendier and Tate (2005). I assume that once a CEO exhibits overconfidence for the measures of
CEO_OC, the CEO is then regarded as overconfident. Therefore, CEO_OC is set to 1 during the rest of the sample period since the first year in which a dummy variable of CEO_OC_firm_based for the CEO’s firm is equal to 1. Next, I control for the factors that affect the existence of ICWs and the incentives to discover and report them. First, Ashbaugh-Skaife et al. (2007) document that the existence of ICWs is positively associated with operational complexity and changes in the organizational structure. Thus, I control for the existence of foreign operation(s) (Foreign_OP) and the involvement of mergers and acquisitions (M&A) and restructuring activities (Restructure). I also add Salesgrowth to control for this operating characteristic of firms because Ashbaugh-Skaife et al. (2007) report that faster-growing firms are more likely to have ICWs. Another factor affecting the existence of ICWs is whether or not firms have adequate resources to invest in and establish and maintain their effective ICFRs. Larger, profitable, or financially stable firms are expected to be less likely to have ICWs. Therefore, I control for firm size (Size), firm losses (Loss), and bankruptcy probability (Bankz). Finally, I include factors related to incentives to discover and report ICWs. Restatement is strongly and positively associated with ICWs. Management of firms that restate previous financial statements is perceived to have an incentive to discover and report relevant ICWs. Big 4 auditors have incentives to disclose identified ICWs (Ashbaugh-Skaife et al. 2007). Additionally, management of firms with greater litigation risk is more likely to report identified ICWs to avoid potential litigation risk, which is measured by whether a firm runs its business in litigious industries. Thus, I control for Restatement, Big4, and Litigation risk.
Lastly, to test Hypothesis 3, I examine the impact of CEO overconfidence and a lack of investments needed to establish and maintain effective ICFR on earnings quality, which is proxied as discretionary accruals and accruals quality. First I explore the association between CEO overconfidence and ICWs and discretionary accruals using two measures of discretionary accruals following Kothari et al. (2005)’s performance-controlled model and modified Jones (1991) model. The measurement procedure of discretionary accruals based on performance-controlled model is as follows. First, I cross-sectionally estimate the coefficients of model (2) for firms with no ICWs by year and two-digit SIC code.
TACCit/Ait-1=α1(1/Ait-1)+α2(∆REVit-1-∆RECit-1)/Ait-1+α3(PPEit-1/Ait-1)+α4ROAit-1+εit (2) where TACCit represents discretionary accruals, measured by IBEXit-CFOit using a cash flow approach (Hribar and Collins, 2002) where IBEXit represents earnings before extraordinary items for firm i in year t, and CFOit represents cash flows from operations for firm i in year t, ∆REVit represents revenues in year t less revenues in year t–1, ∆RECit represents receivables in year t less revenues in year t–1, PPEit represents gross property, plant, and equipment, and Ait-1 represents lagged total assets. ROAit represents return on assets measured using IBEXit divided by lagged total assets. Then, these previously estimated coefficients are used to compute discretionary accruals (DA) in the following model for the ICWs sample firms in this study.
DAit=TACCit –[ā1(1/Ait-1)+ā2(∆REVit-1-∆RECit-1)/Ait-1+ā3(PPEit-1/Ait-1)+ā4ROAit-1] (3) where DAit represents discretionary accruals (DA), which are calculated by subtracting non-discretionary accruals from total accruals. Next, to compute discretionary accruals based on modified Jones (1991) model, I re-conduct the measurement procedures in Models (2) and (3) without ROA.
To test the association of CEO overconfidence and ICWs with discretionary accruals, I establish Model (4) as follows:
ABS(DA_KO) or ABS(DA_MJ)it=β0+β1*OC_Staffing (OC_IFRS)it+β2*Sizeit +β3*CFOit+β4*Loss+β5*BTM+β6*Salesgrowth+β7*Bankzit
where:
ABS(DA_KO) = Absolute value of discretionary accruals, measured by performance-controlled model (Kothari et al. 2005). ABS(DA_MJ) = Absolute value of discretionary accruals, measured by modified Jones (1991) model.
OC_Staffing = coded 1 if a firm discloses internal control weaknesses related to staffing (i.e., a lack of accounting/internal control personnel) under SOX Section 404(b) and its CEO is overconfident, and 0 otherwise.
OC_FRIS = coded 1 if a firm discloses internal control weaknesses related to ineffective financial reporting information system under SOX Section 404(b) and its CEO is overconfident, and 0 otherwise. CFO = Cash flows from operations, deflated by total assets.
Lev = The ratio of total liabilities divided by total assets.
BTM = The ratio of book value of equity to market capitalization, measured by multiplying the number of outstanding shares by stock price.
ABS(TACC) = Absolute value of earnings before extraordinary items less cash flows from operations, deflated by lagged total assets.
To test Hypothesis 3, I reproduced two variables of interest: OC_Staffing and OC_FRIS. OC_Staffing is coded 1 if a firm discloses ICWs related to staffing (i.e., a lack of accounting/internal control personnel) under SOX Section 404(b) and its CEO is overconfident. OC_FRIS is coded 1 if a firm discloses ICWs related to an ineffective FRIS under SOX Section 404(b) and its CEO is overconfident. Additionally, I created three sub-samples from the full sample. Sub-sample 1 (n=185) consists of firms that disclose ICWs related to staffing (i.e., a lack of accounting/internal control personnel) under SOX Section 404(b) and have overconfident CEOs. Sub-sample 2 (n=75) consists of firms that disclose ICWs related to an ineffective FRIS under SOX Section 404(b) and have overconfident CEOs. Sub-sample 3 (n=2,586) consists of firms that do not disclose ICWs and have non-overconfident CEOs. The first two sub-samples are test samples and the last one represents the control sample. Each test sub-sample is merged with the control sample for the regression analysis.
In Model (4), I use the absolute value of the discretionary accruals (Abs(DA)) as a proxy for financial reporting quality. Discretionary accruals represent one of the most popular proxies for earnings management. In this study, this proxy is measured using a performance-adjusted model (Kothari et al., 2005). In addition, following prior studies (e.g., Reynolds and Francis, 2000; Becker et al., 1998; Warfield et al., 1995), I control for firm size (Size), cash flows from operations (CFO), loss firms (Loss), growth opportunity (BTM), growth rate (Salesgrowth), financial stability (Bankz), and absolute value of total accruals (Abs(Tacc)).
Lastly, accruals quality is another popular proxy for earnings quality (Dechow and Dichev, 2002; Dechow et al., 2011). To compute each firm’s residual and its industry mean residual, I cross-sectionally estimate Model (5), which is based on Dechow and Dichev (2002), by year and two-digit SIC code. Accrual Quality is defined as the absolute value of firm residual minus industry mean residual in year t, estimated in Model (5).
∆WCAit = c0 + c1CFOit-1 + c2CFOit + c3CFOit+1 + c4ΔREVit + c5PPEit + εit (5) where WCA represents working capital accruals measured as ((Δcurrent assets – Δcash and cash equivalents)-(Δcurrent liabilities –Δshort-term liabilities)), CFO represents operating cash flows, ΔREV represents change in sales, and PPE represents the gross amount of property, plant, and equipment. All variables in model (5) are deflated by average total assets. Following McNichlos (2002) and Francis et al. (2005), I also include the change in sales (ΔREV) and the level of property, plant, and equipment (PPE) in year t.
To test the association of CEO overconfidence and ICWs with accruals quality, I establish Model (6) as follows: Accruals Qualityit=β0+β1*OC_Staffing(OC_IFRS)it+β2*Sizeit+β3*CFOit+β4*Loss
+β5*BTM+β6*Salesgrowthit+β7*Bankzit+β8*ABS(TACC)it+εit (6) where:
SAMPLE AND DATA
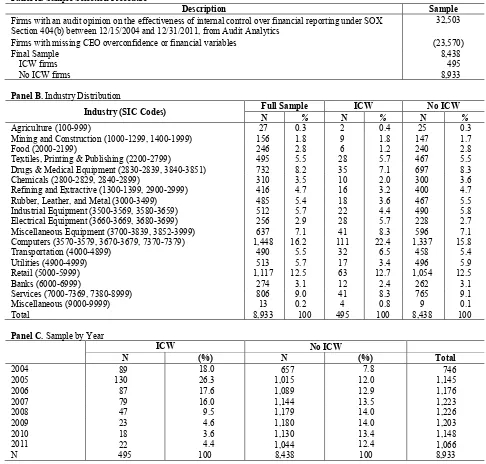
The sample period for this study is 2004 to 2011. Data for ICWs, CEOs, and financial variables are collected from the Audit Analytics database, the Execucomp database, and the Compustat database. An initial sample from Audit Analytics comprises 32,503 firm-year observations that disclose the effectiveness of ICFR under SOX Section 404(b) during the sample period. Then, merging the initial sample with CEO overconfidence and financial variables results in the deletion of 23,570 firm-year observations given missing CEO overconfidence or financial variables. The final sample contains 8,933 firm-year observations consisting of 495 (8,438) firm-year observations that (did not) disclosed ICWs under SOX Section 404(b). Table 1 panel A summarizes the sample selection procedures.
Table 1. Sample Panel A. Sample Selection Procedure
Description Sample
Firms with an audit opinion on the effectiveness of internal control over financial reporting under SOX Section 404(b) between 12/15/2004 and 12/31/2011, from Audit Analytics
32,503
Firms with missing CEO overconfidence or financial variables (23,570)
Final Sample 8,438
ICW firms 495
No ICW firms 8,933
Panel B. Industry Distribution
Industry (SIC Codes) Full Sample N % N ICW % N No ICW %
Agriculture (100-999) 27 0.3 2 0.4 25 0.3
Mining and Construction (1000-1299, 1400-1999) 156 1.8 9 1.8 147 1.7
Food (2000-2199) 246 2.8 6 1.2 240 2.8
Textiles, Printing & Publishing (2200-2799) 495 5.5 28 5.7 467 5.5 Drugs & Medical Equipment (2830-2839, 3840-3851) 732 8.2 35 7.1 697 8.3
Chemicals (2800-2829, 2840-2899) 310 3.5 10 2.0 300 3.6
Refining and Extractive (1300-1399, 2900-2999) 416 4.7 16 3.2 400 4.7
Rubber, Leather, and Metal (3000-3499) 485 5.4 18 3.6 467 5.5
Industrial Equipment (3500-3569, 3580-3659) 512 5.7 22 4.4 490 5.8 Electrical Equipment (3660-3669, 3680-3699) 256 2.9 28 5.7 228 2.7 Miscellaneous Equipment (3700-3839, 3852-3999) 637 7.1 41 8.3 596 7.1 Computers (3570-3579, 3670-3679, 7370-7379) 1,448 16.2 111 22.4 1,337 15.8
Transportation (4000-4899) 490 5.5 32 6.5 458 5.4
Utilities (4900-4999) 513 5.7 17 3.4 496 5.9
Retail (5000-5999) 1,117 12.5 63 12.7 1,054 12.5
Banks (6000-6999) 274 3.1 12 2.4 262 3.1
Services (7000-7369, 7380-8999) 806 9.0 41 8.3 765 9.1
Miscellaneous (9000-9999) 13 0.2 4 0.8 9 0.1
Total 8,933 100 495 100 8,438 100
Panel C. Sample by Year
ICW No ICW
N (%) N (%) Total
2004 89 18.0 657 7.8 746
2005 130 26.3 1,015 12.0 1,145
2006 87 17.6 1,089 12.9 1,176
2007 79 16.0 1,144 13.5 1,223
2008 47 9.5 1,179 14.0 1,226
2009 23 4.6 1,180 14.0 1,203
2010 18 3.6 1,130 13.4 1,148
2011 22 4.4 1,044 12.4 1,066
N 495 100 8,438 100 8,933
of the 495 ICW sample firm-year observations, 111 (22.6%) sample firm-year observations within the computer industry report ICWs, which is the most frequent, followed by retail (12.5%), service (8.3%), miscellaneous equipment (8.3%), drug & medical equipment (7.1%).4 Table 1 Panel C presents the yearly distribution of the full sample based on internal control effectiveness. This distribution shows that the enactment of SOX Section 404(b) in 2004 resulted in an increase in firms that disclose ineffective internal controls, from 89 in 2004 to 130 in 2005. However, in 2006, firms with ineffective internal controls decreased to 87; since then, the number of firms that report ineffective internal controls has decreased every year until 2010.
EMPIRICAL RESULTS
Univariate Analysis
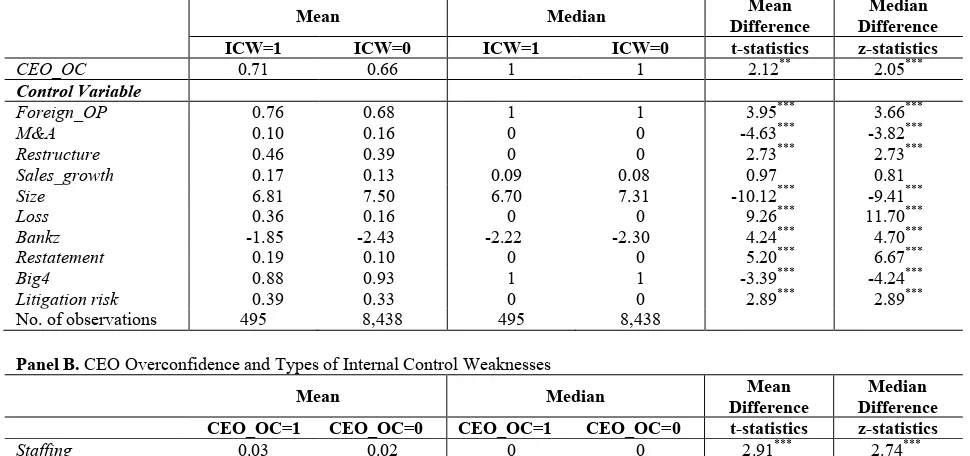
Table 2 Panel A reports the mean and median differences of all of the independent variables used in the empirical model between firms that report effective or ineffective ICFR (i.e., material weakness) under SOX Section 404(b). As shown in columns 2, 3, and 6 in Table 2 Panel A, the mean (0.71) of CEO_OC for firms with ineffective ICFR is greater than that (0.66) of those with effective ICFR, and the mean difference is significant at the 5 percent level (t-statistics=2.05), suggesting that firms managed by overconfident CEOs are more likely to have ineffective ICFRs. All of the control variables (i.e., Foreign_OP, Restructure, Size, Loss, Bankz, Restatement, Litigation risk) except for M&A, Salesgrowth, and Big4, have the expected signs and are significant at the 1 percent level. In contrast to my expectations, M&A and Big4 are negative and significant at the 1 percent level. As expected, Salesgrowth is positive but insignificant. The results of the median difference test are presented in columns 4, 5, and 7 in Table 2 Panel A, and are very similar to those from the mean difference test.
Table 2. Descriptive Statistics for Variables Related to Internal Control Weaknesses Panel A. Internal Control Weaknesses and Determinants Affecting their Existence
Mean Median Difference Mean Difference Median ICW=1 ICW=0 ICW=1 ICW=0 t-statistics z-statistics
CEO_OC 0.71 0.66 1 1 2.12** 2.05***
Control Variable
Foreign_OP 0.76 0.68 1 1 3.95*** 3.66***
M&A 0.10 0.16 0 0 -4.63*** -3.82***
Restructure 0.46 0.39 0 0 2.73*** 2.73***
Sales_growth 0.17 0.13 0.09 0.08 0.97 0.81
Size 6.81 7.50 6.70 7.31 -10.12*** -9.41***
Loss 0.36 0.16 0 0 9.26*** 11.70***
Bankz -1.85 -2.43 -2.22 -2.30 4.24*** 4.70***
Restatement 0.19 0.10 0 0 5.20*** 6.67***
Big4 0.88 0.93 1 1 -3.39*** -4.24***
Litigation risk 0.39 0.33 0 0 2.89*** 2.89***
No. of observations 495 8,438 495 8,438
Panel B. CEO Overconfidence and Types of Internal Control Weaknesses
Mean Median Difference Mean Difference Median CEO_OC=1 CEO_OC=0 CEO_OC=1 CEO_OC=0 t-statistics z-statistics
Staffing 0.03 0.02 0 0 2.91*** 2.74***
FRIS 0.01 0.01 0 0 2.00** 1.87*
No. of observations 5,957 2,976 5,957 2,976
4 In addition, prior study (e.g., Johnson et al. 2001; Francis et al. 1994) documents that those industries such as computer (including SIC codes
(Table 2 continued)
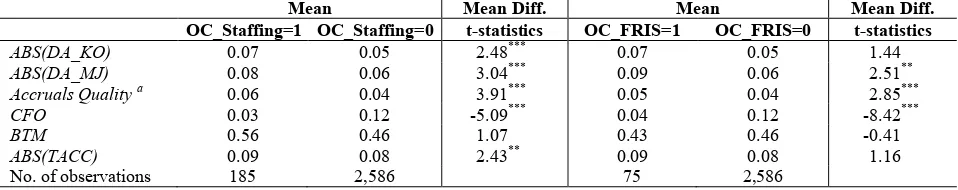
Panel C. CEO Overconfidence/Staffing- or FRIS-Related ICWs and Discretionary Accruals/Accruals Quality
Mean Mean Diff. Mean Mean Diff.
OC_Staffing=1 OC_Staffing=0 t-statistics OC_FRIS=1 OC_FRIS=0 t-statistics
ABS(DA_KO) 0.07 0.05 2.48*** 0.07 0.05 1.44
ABS(DA_MJ) 0.08 0.06 3.04*** 0.09 0.06 2.51**
Accruals Quality a 0.06 0.04 3.91*** 0.05 0.04 2.85***
CFO 0.03 0.12 -5.09*** 0.04 0.12 -8.42***
BTM 0.56 0.46 1.07 0.43 0.46 -0.41
ABS(TACC) 0.09 0.08 2.43** 0.09 0.08 1.16
No. of observations 185 2,586 75 2,586
where:
CEO_OC = coded 1 if the CEO of a firm is overconfident, and 0 otherwise.
ICW = coded 1 if a firm discloses internal control weaknesses under SOX Section 404(b), and 0 otherwise. Staffing = coded 1 if a firm discloses internal control weaknesses related to staffing (i.e., a lack of accounting/internal
control personnel) under SOX Section 404(b), and 0 otherwise.
FRIS = coded 1 if a firm discloses internal control weaknesses related to ineffective financial reporting information system under SOX Section 404(b), and 0 otherwise.
OC_Staffing = coded 1 if a firm discloses internal control weaknesses related to staffing (i.e., a lack of accounting/internal control personnel) under SOX Section 404(b) and its CEO is overconfident, and 0 otherwise.
OC_FRIS = coded 1 if a firm discloses internal control weaknesses related to ineffective financial reporting information system under SOX Section 404(b) and its CEO is overconfident, and 0 otherwise. Foreign_OP = coded 1 if a firm operates a foreign operation, and 0 otherwise.
M&A = coded 1 if a firm is involved in a merger or acquisition, and 0 otherwise. Restructure coded 1 if a firm is involved in a restructuring, and 0 otherwise.
Salesgrowth = growth rate in sales, measured as (sales in the current fiscal year-sales in the previous fiscal year)/sales in the previous fiscal year,
Size = coded 1 if a firm reports net loss for the previous fiscal year, and 0 otherwise Loss = coded 1 if a firm reports net loss for the current fiscal year, and 0 otherwise
Bankz = bankruptcy score (Zmijewski 1984), measured as -4.803-3.599*(net income/total assets)+5.406*(total liabilities/total assets)-0.100*(current assets/current liabilities)
Restatement = coded 1 if a firm reports that they restated previously issued financial statements in the current fiscal year, and 0 otherwise
Big4 = coded 1 if a firm’s auditor is one of PWC, EY, Deloitte, KPMG, and 0 otherwise.
Litigation risk = coded 1 if a firm belongs to a litigious industry-SIC code 2833 to 2836, SIC code 3570 to 3577, SIC code 3600 to 3674, SIC code 5200 to 5961, SIC code 7370 to 7374, or SIC code 8731 to 8734, and 0 otherwise. ABS(DA_KO) = Absolute value of discretionary accruals, measured by performance-controlled model (Kothari et al. 2005). ABS(DA_MJ) = Absolute value of discretionary accruals, measured by modified Jones (1991) model.
Accruals Quality
= Absolute value of firm residual minus industry mean residual in year t, estimated in the model by year and two-digit SIC code: ∆WCAit = c0 + c1CFOit-1 + c2CFOit + c3CFOit+1 + c4ΔREVit + c5PPEit + εit.
CFO = Cash flows from operations, deflated by total assets.
BTM = The ratio of book value of equity to market capitalization, measured by multiplying the number of outstanding shares by stock price.
ABS(TACC) = Absolute value of earnings before extraordinary items less cash flows from operations, deflated by lagged total assets.
a For Accruals Quality test, the size of each sub-sample is varied due to missing values: 1) n=174 for OC_Staffing=1, 2) n=2,504 for
OC_Staffing=0, 3) n=72 for OC_FRIS=1, 4) n=2,504 for OC_FRIS=0. ***/**/* Significant at or below the 0.01/0.05/0.1 level (two-tailed).
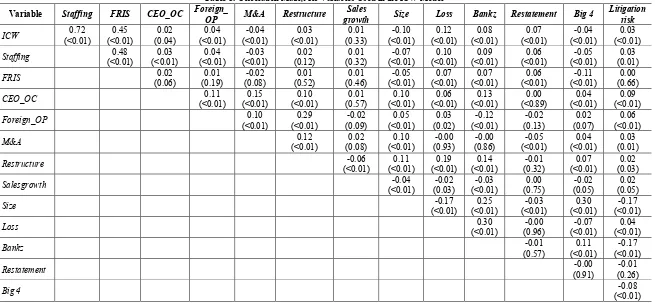
In addition, Table 3 exhibits the results of the correlation analysis, which show positive and significant (p-value: 0.04, <0.01, and 0.06, respectively) correlations (0.02, 0.03, and 0.02, respectively) between ICW, Staffing, or FRIS and CEO_OC. In contrast to my expectations, as suggested in the results of the mean difference test in Table 2, ICW is negatively correlated with M&A or Big4 at the 1 percent level, but the magnitudes are low (–0.04). The other correlations between CEO_OC and each of the independent variables are less than 0.4.
Table 3. Correlation Matrix for Variables Used in the ICW Model
Variable Staffing FRIS CEO_OC Foreign_ OP M&A Restructure growth Sales Size Loss Bankz Restatement Big 4 Litigation risk
ICW (<0.01) 0.72 (<0.01) 0.45 (0.04) 0.02 (<0.01) 0.04 (<0.01) -0.04 (<0.01) 0.03 (0.33) 0.01 (<0.01) -0.10 (<0.01) 0.12 (<0.01) 0.08 (<0.01) 0.07 (<0.01) -0.04 (<0.01) 0.03
Staffing (<0.01) 0.48 (<0.01) 0.03 (<0.01) 0.04 (<0.01) -0.03 (0.12) 0.02 (0.32) 0.01 (<0.01) -0.07 (<0.01) 0.10 (<0.01) 0.09 (<0.01) 0.06 (<0.01) -0.05 (0.01) 0.03
FRIS (0.06) 0.02 (0.19) 0.01 (0.08) -0.02 (0.52) 0.01 (0.46) 0.01 (<0.01) -0.05 (<0.01) 0.07 (<0.01) 0.07 (<0.01) 0.06 (<0.01) -0.11 (0.66) 0.00
CEO_OC (<0.01) 0.11 (<0.01) 0.15 (<0.01) 0.10 (0.57) 0.01 (<0.01) 0.10 (<0.01) 0.06 (<0.01) 0.13 (<0.89) 0.00 (<0.01) 0.04 (<0.01) 0.09
Foreign_OP (<0.01) 0.10 (<0.01) 0.29 (0.09) -0.02 (<0.01) 0.05 (0.02) 0.03 (<0.01) -0.12 (0.13) -0.02 (0.07) 0.02 (<0.01) 0.06
M&A (<0.01) 0.12 (0.08) 0.02 (<0.01) 0.10 (0.93) -0.00 (0.86) -0.00 (<0.01) -0.05 (<0.01) 0.04 (0.01) 0.03
Restructure (<0.01) -0.06 (<0.01) 0.11 (<0.01) 0.19 (<0.01) 0.14 (0.32) -0.01 (<0.01) 0.07 (0.03) 0.02
Salesgrowth (<0.01) -0.04 (0.03) -0.02 (<0.01) -0.03 (0.75) 0.00 (0.05) -0.02 (0.05) 0.02
Size (<0.01) -0.17 (<0.01) 0.25 (<0.01) -0.03 (<0.01) 0.30 (<0.01) -0.17
Loss (<0.01) 0.30 (0.96) -0.00 (<0.01) -0.07 (<0.01) 0.04
Bankz (0.57) -0.01 (<0.01) 0.11 (<0.01) -0.17
Restatement (0.91) -0.00 (0.26) -0.01
Big 4 (<0.01) -0.08
MULTIVARIATE ANALYSIS
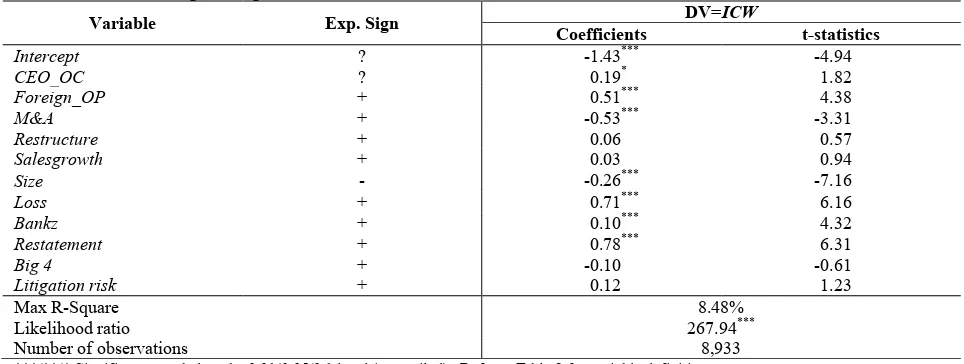
Table 4 reports the results of the logistic regression to test Hypothesis 1 using the full sample (n=8,933). The dependent variable is the dummy variable ICW, which is coded 1 if a firm reports ineffective ICFR under SOX Section 404(b). Columns 3 and 4 in Table 4 present the logistic regression results of the impact of CEO overconfidence on the effectiveness of ICFR, where CEO_OC is measured at the firm level using five variables from Schrand and Zechman (2011) that represent the characteristics of firms with overconfident CEOs. Columns 3 and 4 of Table 4 shows that the coefficient (0.19) of CEO_OC, a test variable, is positive and significant at the conventional level (t-statistic=1.82). Therefore, firms with overconfident CEOs are more likely to have ineffective ICFR.
Table 4. Results of Logistic Regression of the Effect of CEO Overconfidence on Disclosures of Internal Control Effectiveness
Variable Exp. Sign Coefficients DV=ICW t-statistics
Intercept ? -1.43*** -4.94
CEO_OC ? 0.19* 1.82
Foreign_OP + 0.51*** 4.38
M&A + -0.53*** -3.31
Restructure + 0.06 0.57
Salesgrowth + 0.03 0.94
Size - -0.26*** -7.16
Loss + 0.71*** 6.16
Bankz + 0.10*** 4.32
Restatement + 0.78*** 6.31
Big 4 + -0.10 -0.61
Litigation risk + 0.12 1.23
Max R-Square 8.48%
Likelihood ratio 267.94***
Number of observations 8,933
***/**/* Significant at or below the 0.01/0.05/0.1 level (two-tailed). Refer to Table 2 for variable definitions.
The dependent variable is ICW, which is coded 1 if a firm discloses ICWs under SOX Section 404(b), and 0 otherwise. CEO_OC is coded 1 if the CEO of a firm is overconfident, and 0 otherwise. Out of 8,933 firm-year observations, 495 (8,438) disclose (no) ICWs under SOX Section 404(b).
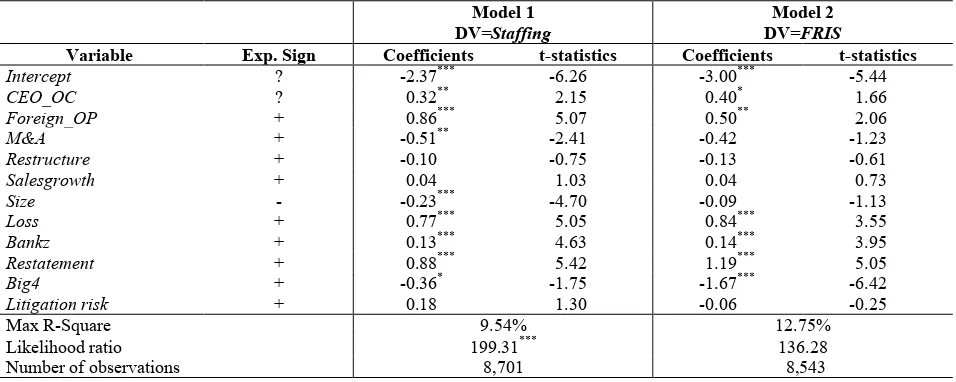
Table 5. Results of Logistic Regression of the Effect of CEO Overconfidence on Internal Control Weaknesses Related to Staffing/Financial Reporting Information System
Model 1
DV=Staffing DVModel 2 =FRIS
Variable Exp. Sign Coefficients t-statistics Coefficients t-statistics
Intercept ? -2.37*** -6.26 -3.00*** -5.44
CEO_OC ? 0.32** 2.15 0.40* 1.66
Foreign_OP + 0.86*** 5.07 0.50** 2.06
M&A + -0.51** -2.41 -0.42 -1.23
Restructure + -0.10 -0.75 -0.13 -0.61
Salesgrowth + 0.04 1.03 0.04 0.73
Size - -0.23*** -4.70 -0.09 -1.13
Loss + 0.77*** 5.05 0.84*** 3.55
Bankz + 0.13*** 4.63 0.14*** 3.95
Restatement + 0.88*** 5.42 1.19*** 5.05
Big4 + -0.36* -1.75 -1.67*** -6.42
Litigation risk + 0.18 1.30 -0.06 -0.25
Max R-Square 9.54% 12.75%
Likelihood ratio 199.31*** 136.28
Number of observations 8,701 8,543
***/**/* Significant at or below the 0.01/0.05/0.1 level (two-tailed). Refer to Table 2 for variable definitions.
The dependent variables are Staffing and FRIS. Staffing is coded 1 if a firm discloses ICWs related to staffing (i.e., a lack of accounting/internal control personnel) under SOX Section 404(b), and 0 otherwise. FRIS is coded 1 if a firm discloses ICWs related to an ineffective FRIS under SOX Section 404(b), and 0 otherwise. CEO_OC is coded 1 if the CEO of a firm is overconfident, and 0 otherwise.
In Model 1, the number of firm-year observations is 8,701, consisting of 263 observations that disclose staffing-related ICWs and 8,670 that disclose no ICWs. In Model 2, the number of firm-year observations is 8,438, consisting of 105 observations that disclose staffing-related ICWs and 8,438 that disclose no ICWs.
Table 5 presents the logistic regression results. Columns 3 and 4 of Table 5 report the results of the association between CEO overconfidence (CEO_OC) and Staffing, which show that the coefficient (0.33) of CEO_OC is positive and significant at the 5 percent level (t-statistics=2.21). This result suggests that firms with overconfident CEOs are more likely to experience a lack of accounting personnel given insufficient investment in staffing. Additionally, columns 5 and 6 in Table 5 present the results of the association between CEO overconfidence
(CEO_OC) and FRIS, which shows that the coefficient (0.40) of CEO_OC is positive and marginally significant
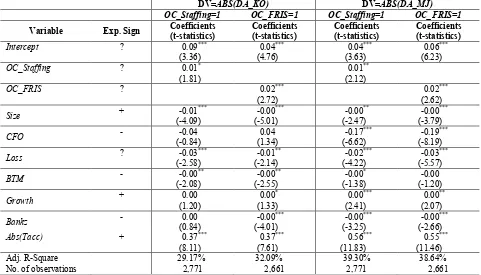
Table 6. Results of Regression on the Effect of CEO Overconfidence/Internal Control Weaknesses Related to Staffing/Financial Reporting Information System on Discretionary Accruals
DV=ABS(DA_KO) DV=ABS(DA_MJ) OC_Staffing=1 OC_FRIS=1 OC_Staffing=1 OC_FRIS=1 Variable Exp. Sign Coefficients (t-statistics) Coefficients (t-statistics) Coefficients (t-statistics) Coefficients (t-statistics)
Intercept ? 0.09***
(3.36) 0.04*** (4.76) 0.04*** (3.63) 0.06*** (6.23)
OC_Staffing ? 0.01*
(1.81)
0.01** (2.12)
OC_FRIS ? 0.02***
(2.72) 0.02
***
(2.62)
Size + (-4.09) -0.01*** (-5.01) -0.00*** (-2.47) -0.00** (-3.79) -0.00***
CFO - (-0.84) -0.04 (1.34) 0.04 (-6.62) -0.17*** (-8.19) -0.19***
Loss ? (-2.58) -0.03*** (-2.14) -0.01** (-4.22) -0.02*** (-5.57) -0.03***
BTM - (-2.08) -0.00** (-2.55)-0.00** (-1.38) -0.00* (-1.20) -0.00
Growth + (1.20) 0.00 (1.33) 0.00* (2.41) 0.00*** (2.07) 0.00**
Bankz - (0.84) 0.00 (-4.01) -0.00*** (-3.25) -0.00*** (-2.66) -0.00***
Abs(Tacc) + 0.37***
(8.11) 0.37 ***
(7.61) 0.56
***
(11.83) 0.55 ***
(11.46)
Adj. R-Square 29.17% 32.09% 39.30% 38.64%
No. of observations 2,771 2,661 2,771 2,661
***/**/* Significant at or below the 0.01/0.05/0.1 level (two-tailed). All statistics and significance levels are based on standard errors adjusted by a two-dimensional cluster at the firm and year levels. Refer to Table 2 for variable definitions.
The dependent variable is ABS(DA_KO), absolute value of discretionary accruals estimated using a performance-controlled model, as in Kothari et al. (2005). ABS(DA_MJ), absolute value of discretionary accruals estimated using modified Jones (1991) model. OC_Staffing is coded 1 if a firm discloses ICWs related to staffing (i.e., a lack of accounting/internal control personnel) under SOX Section 404(b) and its CEO is overconfident, and 0 otherwise.
OC_FRIS is coded 1 if a firm discloses ICWs related to an ineffective FRIS under SOX Section 404(b) and its CEO
is overconfident, and 0 otherwise.
In Model 1, the number of firm-year observations is 2,771, consisting of 185 (OC_Staffing=1) observations that disclose a lack of accounting personnel (Staffing=1) and overconfident CEOs (CEO_OC=1) and 2,586 observations that disclose both non-overconfident CEOs (CEO_OC=0) and no ICWs (ICW=0). In Model 2, the number of firm-year observations is 2,661, consisting of 75 (OC_FRIS=1) observations that disclose an ineffective FRIS and overconfident CEOs (CEO_OC=1) and 2,586 observations with both non-overconfident CEOs (CEO_OC=0) and no ICWs (ICW=0).
Finally, I test Hypothesis 3 by examining the association between CEO overconfidence and a lack of investment in the establishment and maintenance of effective ICFR and absolute value of discretionary accruals. Table 6 columns 3 and 5 report the regression results on the difference in discretionary accruals between firms (n=185) with
overconfident CEOs and ICWs related to staffing and firms (n=2,586) without overconfident CEOs and any ICWs, using performance-controlled model (Kothari et al. 2005) and modified Jones (1991) model, respectively. Consistent with prior studies, I find that the coefficients of OC_Staffing are positive and significant at the conventional or 5 percent level, suggesting that firms whose CEOs are overconfident and that disclose staffing-related ICWs are more likely to manage earnings. Additionally, columns 4 and 6 in Table 6 report the difference in discretionary accruals between firms (n=85) with overconfident CEOs and ICWs related to financial reporting information system (FRIS) and firms (n=2,586) without overconfident CEOs and any ICWs. Consistently, I find that the coefficients of
OC_FRIS are positive and significant at the 1 percent level, suggesting that firms whose CEOs are overconfident
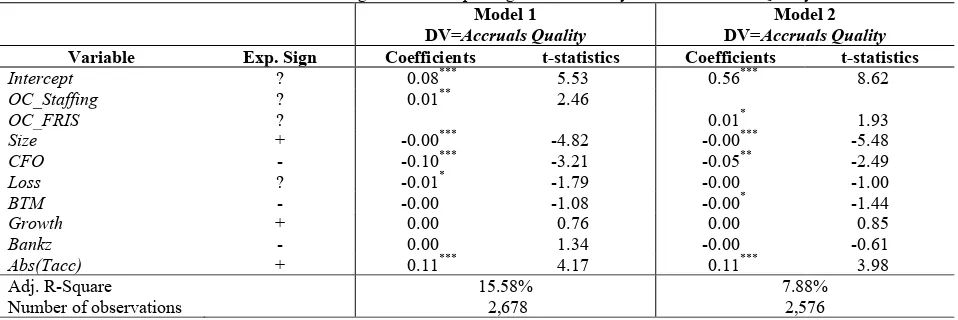
3 by examining the association between CEO overconfidence and a lack of investment in the establishment and maintenance of effective ICFR and accruals quality. Table 7 Model 1 reports the regression results on the difference in accruals quality between firms (n=174) with overconfident CEOs and ICWs related to staffing and firms (n=2,504) without overconfident CEOs and any ICWs. Consistent with prior studies, I find that the coefficient of
OC_Staffing is positive and significant at the 5 percent level (t-statistics=2.46), suggesting that firms whose CEOs
are overconfident and that disclose staffing-related ICWs are more likely to have lower quality of accruals. Additionally, Model 2 in Table 7 reports the difference in accruals quality between firms (n=72) with overconfident CEOs and ICWs related to financial reporting information system (FRIS) and firms (n=2,504) without overconfident CEOs and any ICWs. Consistently, I find that the coefficient of OC_FRIS is positive and significant at the conventional level (t-statistics=1.93), suggesting that firms whose CEOs are overconfident and that disclose FRIS-related ICWs are more likely to have lower quality of accruals.
Table 7. Results of Regression on the Effect of CEO Overconfidence/Internal Control Weaknesses Related to Staffing/Financial Reporting Information System on Accruals Quality
Model 1
DV=Accruals Quality DV=Accruals QualityModel 2 Variable Exp. Sign Coefficients t-statistics Coefficients t-statistics
Intercept ? 0.08*** 5.53 0.56*** 8.62
OC_Staffing ? 0.01** 2.46
OC_FRIS ? 0.01* 1.93
Size + -0.00*** -4.82 -0.00*** -5.48
CFO - -0.10*** -3.21 -0.05** -2.49
Loss ? -0.01* -1.79 -0.00 -1.00
BTM - -0.00 -1.08 -0.00* -1.44
Growth + 0.00 0.76 0.00 0.85
Bankz - 0.00 1.34 -0.00 -0.61
Abs(Tacc) + 0.11*** 4.17 0.11*** 3.98
Adj. R-Square 15.58% 7.88%
Number of observations 2,678 2,576
***/**/* Significant at or below the 0.01/0.05/0.1 level (two-tailed). All statistics and significance levels are based on standard errors adjusted by a two-dimensional cluster at the firm and year levels.
The dependent variable is Accruals Quality, absolute value of firm residual minus industry mean residual in year t, estimated in the model by year and two-digit SIC code: ∆WCAit = c0 + c1CFOit-1 + c2CFOit + c3CFOit+1 + c4ΔREVit +
c5PPEit + εit. OC_Staffing is coded 1 if a firm discloses ICWs related to staffing (i.e., a lack of accounting/internal
control personnel) under SOX Section 404(b) and its CEO is overconfident, and 0 otherwise. OC_FRIS is coded 1 if a firm discloses ICWs related to an ineffective FRIS under SOX Section 404(b) and its CEO is overconfident, and 0 otherwise.
In Model 1, the number of firm-year observations is 2,678, consisting of 174 (OC_Staffing=1) observations that disclose a lack of accounting personnel (Staffing=1) and overconfident CEOs (CEO_OC=1) and 2,504 observations that disclose both non-overconfident CEOs (CEO_OC=0) and no ICWs (ICW=0). In Model 2, the number of firm-year observations is 2,576, consisting of 72 (OC_FRIS=1) observations that disclose an ineffective FRIS and overconfident CEOs (CEO_OC=1) and 2,504 observations with both non-overconfident CEOs (CEO_OC=0) and no ICWs (ICW=0).
THEORETICAL AND MANAGERIAL IMPLICATIONS
Psychologically, the overconfidence is a cognitive bias in which a person believes subjectively that his or her judgment or ability is better than that of an average person. From the viewpoint of corporate managers, overconfident CEOs are so overoptimistic that they overestimate future outcomes from current investment projects. Theoretically, such CEO overconfidence can result in either positive consequences such as success in innovation (e.g., Galasso and Simcoe 2011; Hirshleifer et al. 2012) or negative consequences such as value-destroying investments or mergers and acquisitions (e.g., Malmendier and Tate 2005, 2008). Also, Goel and Thakor (2008) provide theoretical evidence that overconfident CEOs “underinvest in information production”, which can lead to investment decision-making errors and in turn inefficient investments. In this study, consistent with the study of Goel and Thakor (2008), I find that overconfident CEOs are less likely to establish and maintain effective ICFR, which is critical to the reliability of financial information and in turn, the ineffective ICFR produces inferior earnings quality such as more discretionary accruals or less accruals reliability. When we consider that CEOs play a central role in setting up and achieving their firm’s objectives, those results imply that overconfident CEOs should be well monitored and directed to maximize the firm value by internal or external corporate governance.
SUMMARY AND CONCLUSION
In this study, I examine the association between CEO overconfidence and the effectiveness of ICFR. I find that CEO overconfidence is positively associated with the existence of ICWs and, in particular, with ICWs related to insufficient accounting personnel or ineffective FRIS. Moreover, I find that firms with overconfident CEOs and that disclose staffing- or FRIS-related ICWs are more inclined to opportunistically manage earnings, producing lower quality of accruals.
Taken together, those findings suggest that firms with overconfident CEOs are less likely to be motivated to invest sufficient resources in establishing and maintaining effective ICFR, leading to ineffective ICFR and, further, lower earnings quality.
As suggested in prior finance literature on the impact of CEO overconfidence on corporate policy, in conclusion, the attitude of overconfident CEOs toward the importance of ICFR could negatively affect the firm’s infrastructure with respect to implementing an effective FRIS, thus producing less reliable financial information. Furthermore, potentially negative consequences could downgrade investors’ confidence regarding the credibility of financial statements.
Data Availability: The data used in this study are available from public sources.
AUTHOR BIOGRAPHIES
Jong Eun Lee is an associate professor at Business School, SungKyunKwan University, South Korea. He received his Ph.D. from Temple University. His research areas include audit quality, internal control, and corporate governance. E-mail:jelee2012@skku.edu.
REFERENCES
Ahmed, A. S. and S. Duellman (2012), ‘Managerial Overconfidence and Accounting Conservatism’, Journal of Accounting Research, Vol.51, pp. 1–30.
Anderson, C., S. Brion, D. M. Moore and J. A. Kennedy, (2012), ‘A Status-Enhancement Account of Overconfidence’, Journal of Personality and Social Psychology, No.103, pp.718–735.
Ashbaugh-Skife, H., D. Collins and W. Kinney, (2007), ‘The Discovery and Reporting of Internal Control Deficiencies Prior to SOX-mandated Audits’, Journal of Accounting and Economics, Vol.44, Nos.1&2, pp.166–192.
Ashbaugh-Skife, H., D. Collins, W. Kinney and R. LaFond, (2008), ‘The Effects of SOX Internal Control Deficiencies and their Remediation on Accrual Quality’, The Accounting Review, Vol.83, No.1, pp.217–250. (2009), ‘The Effects of Internal Control Deficiencies on Firm Risk and Cost of Equity’, Journal of Accounting Research, Vol.47, No.1, pp.1–43. Becker, C. L., M. L. DeFond, J. Jiambalvo and K. R. Subramanyam, (1998), ‘The Effect of Audit Quality on Earnings
Bedard J. C., R. Hoitash and U. Hoitash, (2009), ‘Evidence from the U.S. on the Effect of Auditor Involvement in Assessing Internal Control over Financial Reporting’, International Journal of Auditing, Vol.13, No.2, pp.105–125.
Ben-David, I., J. Graham and C. Harvey, (2007), ‘Managerial Overconfidence and Corporate Policies’, Unpublished Working Paper.
Beneish, M. D., M. B. Billings and L. D. Hodder, (2008), ‘Internal Control Weaknesses and Information Uncertainty’, The Accounting Review, Vol.83, No.3, pp.665–703.
Chan, K. C., B. R. Farrell and P. Lee, (2009), ‘Earnings Management of Firms Reporting Material Internal Control Weaknesses under Section 404 of the Sarbanes–Oxley Act’, Auditing: A Journal of Practice & Theory, Vol.27, No.2, pp.161–179. Dechow, P. and I. Dichev, (2002), ‘The Quality of Accruals and Earnings’, The Accounting Review, Vol.77, pp.35–59. Deshmukh, S., A. M. Goel and K. M. Howe, (2013), ‘CEO Overconfidence and Dividend Policy’, Journal of Financial
Intermediation, Vol.22, pp.440–463.
Doyle, J., W. Ge and S. McVay, (2007a), ‘Determinants of Weaknesses in Internal Control over Financial Reporting and the Implications for Earnings Quality’, Journal of Accounting and Economics, Vol.44, Nos.1&2, pp.193–223. Doyle, J., W. Ge and S. McVay, (2007b), ‘Accrual Quality and Internal Control over Financial Reporting’, The Accounting
Review, Vol.82, No.5, pp.1141–1170.
Feng, M., C. Li and S. McVay, (2009), ‘Internal Control and Management Guidance’, Journal of Accounting and Economics, Vol.48, Nos.2&3, pp.190–209.
Francis, J., D. Philbrick and K. Schipper, (1994), ‘Shareholder Litigation and Corporate Disclosures’, Journal of Accounting Research’, Vol.32, pp.137-164.
Francis, J., R. LaFond., P. Olsson and K. Schipper, (2005), ‘The Market Pricing of Accruals Quality’, Journal of Accounting and Economics, Vol.39, pp.295–327.
Galasso, A., and T. S. Simcoe, 2011, CEO overconfidence and innovation, Management Science 57 (8), 1469–1484. Ge, W. and S. McVay, (2005), ‘The Disclosure of Material Weaknesses in Internal Control after the Sarbanes–Oxley Act’,
Accounting Horizons, Vol.19, No.3, pp.137–158.
Goel, M A. and A. V. Thakor, (2008), ‘Overconfidence, CEO Selection, and Corporate Governance’, The Journal of Finance, Vol.63, No.6, pp. 2737-2784.
Hackbarth, D. (2008), ‘Managerial Traits and Capital Structure Decisions’, Journal of Financial and Quantitative Analysis, Vol.43, No.4, pp.843–881.
Hammersley, J. S., L. A. Myers and C. Shakespeare, (2008), ‘Market Reactions to the Disclosure of Internal Control Weaknesses and to the Characteristics of those Weaknesses under Section 302 of the Sarbanes–Oxley Act of 2002’, Review of Accounting Studies, Vol.14, Nos.2&3, pp.401–439.
Heaton, J. B. (2002), ‘Managerial Optimism and Corporate Finance’, Financial Management, Vol.31, No.2, pp.33–45.
Hirshleifer, D., A. Low, and S. H. Teoh, 2012, Are overconfident CEOs better innovators?, The Journal of Finance 67 (4), 1457– 1498.
Hoitash, R., U. Hoitash and J. C. Bedard, (2009), ‘Corporate Governance and Internal Control over Financial Reporting: A Comparison of Regulatory Regimes’, The Accounting Review, Vol.84, No.3, pp.839–867.
Hribar, P. and D. Collins, (2002), ‘Errors in Estimating Accruals: Implications for Empirical Research’, Journal of Accounting Research, Vol.40, No.5, pp.105-134.
Jones, J, (1991), ‘Earnings Management during Import Relief Investigations’, Journal of Accounting Research, Vol.29, pp.193-228.
Johnson, M.F., R. Kasznik and K.K. Nelson, (2001), ‘The Impact of Securities Litigation Reform on the Disclosure of Forward-Looking Information by High Technology Firms’, Journal of Accounting Research, Vol.39, pp.297-327.
Kim, Y. and M. S. Park, (2009), ‘Market Uncertainty and Disclosure of Internal Control Deficiencies under the Sarbanes–Oxley Act’, Journal of Accounting and Public Policy, Vol.28, No.5, pp.419–445.
Kothari, S. P., A. J. Leone and C. Wasley, (2005), ‘Performance Matched Discretionary Accruals Measures’, Journal of Accounting and Economics, Vol.39, pp. 163-197.
Krishnan, G. V. and G. Visvanathan, (2007), ‘Reporting Internal Control Deficiencies in the Post-Sarbanes–Oxley Era: The Role of Auditors and Corporate Governance’, International Journal of Auditing, Vol.11, pp.73–90.
Malmendier, U. and G. Tate, (2005), ‘CEO Overconfidence and Corporate Investment’, The Journal of Finance, Vol.60, pp.2661–2700.
Malmendier, U. and G. Tate, (2008), ‘Who Makes Acquisitions? CEO Overconfidence and the Market’s Reaction’, Journal of Financial Economics, Vol.89, pp.20–43.
Malmendier, U., G. Tate and J. Yan, (2011), ‘Overconfidence and Early-life Experiences: The Effect of Managerial Traits on Corporate Financial Policies’, The Journal of Finance, Vol.66, pp.1687–1733.
McNichols, M, (2002), ‘Discussion of the Quality of Accruals and Qarnings: The Role of Accrual Estimation Errors’, The Accounting Review, Vol.77, pp.61–69.
Ogneva, M., K. Raghunandan and K. Subramanyam, (2007), ‘Internal Control Weakness and Cost of Equity: Evidence from SOX 404 Disclosures’, The Accounting Review, Vol.82, No.5, pp.1255–1297.
Reynolds, J. K. and J. R. Francis, (2000), ‘Does Size Matter? The Influence of Large Clients on Office-Level Auditor Reporting Decisions’, Journal of Accounting and Economics, Vol.30, pp. 375-400.
Schneider, A., A.A. Gramling, D.R. Hermanson and Z. Ye, (2009), ‘A Review of Academic Literature on Internal Control Reporting under SOX’, Journal of Accounting Literature, Vol. 28, pp.1-46.
Schrand, C. and S. Zechman, (2011), ‘Executive Overconfidence and the Slippery Slope to Financial Misreporting’, Journal of Accounting and Economics, Vol.53, pp.311–329.
Svenson, A. (1981), ‘Are We all Less Risky than Our Fellow Drivers?’ Acta Psychologica, Vol.4, pp.143–148.
U.S. House of Representatives, (2010), ‘Dodd-Frank Wall Street Reform and Consumer Protection Act’, Public Law 111-203 [H. R. 4173], Washington, D.C.: Government Printing Office.
Warfield, T. D., J. J. Wild and K. L. Wild (1995), ‘Managerial Ownership, Accounting Choices, and Informativeness of Earnings’, Journal of Accounting and Economics, Vol.20, pp. 61-91.
Zhang, Y. and J. Zhou (2007), ‘Audit Committee Quality, Auditor Independence, and Internal Control Weaknesses’, Journal of Accounting and Public Policy, Vol.26, No.3, pp.300–327.