www.orientjchem.org
An International Open Free Access, Peer Reviewed Research Journal
2017, Vol. 33, No. (3): Pg.1347-1353
Development of the Composition and Method of Producing A
Liquid Complex Fertilizers With A Stabilizing Additive
U.B.NAzARBEk
1*, A.A. kADIRBAYEvA
1, M.zH.AITUREEv
2,
O.P.BAYISBAI
1and L.AIkOzOvA
31Department of Chemical Technology of Inorganic Substances, M. Auezov South
Kazakhstan State University, Shymkent, Kazakhstan.
2Department of Chemical technology of silicate and refractory non-metallic substances.
M. Auezov South Kazakhstan State University, Shymkent, Kazakhstan.
3Department of Chemistry. M. Auezov South Kazakhstan State University,
Shymkent, Kazakhstan.
*Corresponding author E-mail: [email protected] http://dx.doi.org/10.13005/ojc/330335 (Received: April 14, 2017; Accepted: May 10, 2017)
ABSTRACT
The article is devoted to the study of technological bases of processing of phosphate waste – cottrell dust and vermiculite as a stabilizing additive in a liquid complex fertilizer. Target of the research work were implemented as a result of engaging in technological conversion of solid industrial waste – cottrell dust. While cottrell dust was used as a phosphorus raw material, and vermiculite as the substrate, for mulching and aeration of the soil, nourishes the plants with minerals. Results of studies allowed to establish as a optimal regime parameters of the process of obtaining liquid complex fertilizers.
keywords: chemical industry, cottrell dust, recycling, industrial waste, liquid complex fertilizer.
INTRODUCTION
Liquid fertilizers are water solutions or slurries of mineral and some organic nutrients. The most common mineral nitrogen - and phosphorus-containing liquid complex fertilizers. This product group includes solutions of salts containing two or three major nutrients (N, P, K) and macronutrients (Ca, Mg, S) and micronutrients (Fe, Mn, B, Cu,
Zn, Mo, Co). Nitrogen-phosphorus liquid complex fertilizer are solutions of phosphates of ammonium, obtained by high temperature treatment with ammonia, H3PO4 or polyphosphoric acids1.
MATERIAL AND METHODS
cottrell dust, vermiculite and humic acid at2 various
ratios. Vermiculite of Kulantau field3 having the
following composition: SiO2- 37,44, CaO-2,10, MgO-23,88, K2O+Na2O-1,18, Fe2O3 - 6,01, Al2O3 - 11,23, H2O - 17,18, used as stabilizing additive4.
Pre-synthesized humic acid with pH = 0,760, as in previous works, is used as a substitute for sulphuric, nitric or phosphoric acids.
It was established that the composition cottrell dust5 meets the following content, %: P
2O5
total - 25, K2O - 5, Na2O- 1, SiO2 - 25, CaO - 10, MgO - 1, Al2O3 - 3, Fe2O3 - 1, C - 24.
A mixture of finely cottrell dust, activated water, vermiculite, of a dilution solution consisting of potassium sulphate and 30% ammonium sulphate is decomposed by humic acid at a temperature of 600C and 90 minutes. The addition of solutions
of potassium sulphate and ammonium sulphate increases6 potassium and nitrogen and consequently
in the composition of the liquid complex fertilizer7.
The process chemistry is possible will present as follows8,9
Ca5(PO4)3F + 6Humic Acid + 2(NH4) 2SO4 + K 2SO4 + H2O = 2CaSO4 + NH4(Hum) + H3PO4 + 2Ca(Hum)2+ Ca(H2PO4)2 + HF + 2KHum
Process flow diagram for synthesizing the liquid complex fertilizer is shown in Fig. 1.
The mixture after decomposition is filtered. It is established that the obtained liquid phase has a density of 1.2 and pH = 2,7.
The resulting solution is analyzed for the content of assimilable and water-soluble P2O5, ammonia and nitrogen.
RESULTS AND DISCUSSION
Laboratory work has been tested in the laboratory of the Department Chemical technology of inorganic substances, M. Auezov SKSU, and physicochemical analyses10 were performed in
the Regional Laboratory Test Engineering Profile (RLTEP) on the basis of the M. Auezov SKSU.
The resulting product has the following material composition:
Physicochemical features derived from cottrell dust liquid complex fertilizer. Using a scanning electron microscope is performed element-by-element and mineralogical analysis of its composition. The results of the microscopic studies allowed to image the surface of samples and the spectra of individual points, with the idea element by element, and percentage composition, as well as diffraction peaks of individual elements with high
Fig. 1: Process flow diagram of receiving liquid complex fertilizer with a stabilizing additive
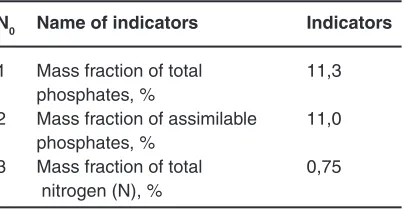
Table 1. Physico chemical parameters obtained in the laboratory liquid complex fertilizer
N0 Name of indicators Indicators
1 Mass fraction of total 11,3 phosphates, %
2 Mass fraction of assimilable 11,0 phosphates, %
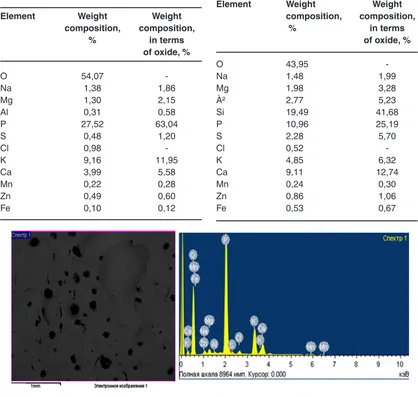
Table 2: Element wise composition of liquid complex fertilizer, calcined at 5000C
Element Weight Weight
composition, composition,
% in terms
of oxide, %
O 54,07
-Na 1,38 1,86
Mg 1,30 2,15
Al 0,31 0,58
P 27,52 63,04
S 0,48 1,20
Cl 0,98
-K 9,16 11,95
Ca 3,99 5,58
Mn 0,22 0,28
Zn 0,49 0,60
Fe 0,10 0,12
Table 3: Element wise composition of solids
Element Weight Weight
composition, composition,
% in terms
of oxide, %
O 43,95
-Na 1,48 1,99
Mg 1,98 3,28
À² 2,77 5,23
Si 19,49 41,68
P 10,96 25,19
S 2,28 5,70
Cl 0,52
-K 4,85 6,32
Ca 9,11 12,74
Mn 0,24 0,30
Zn 0,86 1,06
Fe 0,53 0,67
Fig. 2: Microscopic picture of liquid complex fertilizers
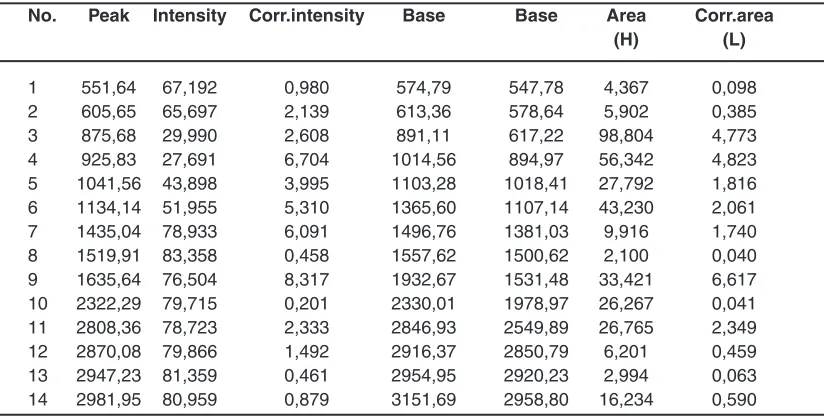
Table 4: The peaks in the IR-spectral analysis of liquid complex fertilizers
No. Peak Intensity Corr.intensity Base Base Area Corr.area
(H) (L)
1 551,64 67,192 0,980 574,79 547,78 4,367 0,098
2 605,65 65,697 2,139 613,36 578,64 5,902 0,385
3 875,68 29,990 2,608 891,11 617,22 98,804 4,773
4 925,83 27,691 6,704 1014,56 894,97 56,342 4,823 5 1041,56 43,898 3,995 1103,28 1018,41 27,792 1,816 6 1134,14 51,955 5,310 1365,60 1107,14 43,230 2,061 7 1435,04 78,933 6,091 1496,76 1381,03 9,916 1,740 8 1519,91 83,358 0,458 1557,62 1500,62 2,100 0,040 9 1635,64 76,504 8,317 1932,67 1531,48 33,421 6,617 10 2322,29 79,715 0,201 2330,01 1978,97 26,267 0,041 11 2808,36 78,723 2,333 2846,93 2549,89 26,765 2,349 12 2870,08 79,866 1,492 2916,37 2850,79 6,201 0,459 13 2947,23 81,359 0,461 2954,95 2920,23 2,994 0,063 14 2981,95 80,959 0,879 3151,69 2958,80 16,234 0,590 spatial resolution and the desired depth of field of
view.
Microscopic picture and the results of elemental analysis of the liquid complex fertilizer is presented in fig. 2 and table 2.
The dry residue remaining after filtration is also is a useful product which corresponds to a double super phosphate low grade (Fig.3, table 3). The residue is granulated and dried at a temperature of 100-110 0C in 3-5 hours. The obtained dry residue
has the following physical characteristics, %: P2O5
total – 20; P2O5 assimilable-15; P2O5 water-soluble-8,75.
IR spectral analysis of liquid complex fertilizers was conducted on the instrument IR spectrometer Shimadzu IR Prestige-21. In table 4 and fig.4 shows the main peaks according to the results of IR spectral analysis of liquid complex fertilizers.
IR spectra of the studied10 samples of the
liquid complex fertilizers are characterized by intense peaks of the broad bands of absorption with satellites
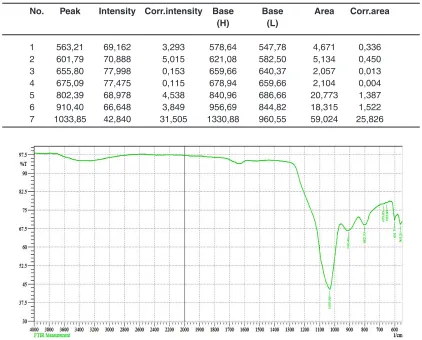
Table 5. The peaks in the IR-spectral analysis of dry residue after filtration
No. Peak Intensity Corr.intensity Base Base Area Corr.area
(H) (L)
1 563,21 69,162 3,293 578,64 547,78 4,671 0,336 2 601,79 70,888 5,015 621,08 582,50 5,134 0,450 3 655,80 77,998 0,153 659,66 640,37 2,057 0,013 4 675,09 77,475 0,115 678,94 659,66 2,104 0,004 5 802,39 68,978 4,538 840,96 686,66 20,773 1,387 6 910,40 66,648 3,849 956,69 844,82 18,315 1,522 7 1033,85 42,840 31,505 1330,88 960,55 59,024 25,826
Fig. 5: IR spectral analysis of dry residue after filtration
in the areas of 500-900 cm-1 and 2600-3700 cm-1.
It should be noted that the wavelengths in the absorption region of 550-700 cm-1 is characteristic
for alkanes and alkene with communication RC≡CH, and 850-900 cm-1 for compounds alkane and alkene
of a number of types of the C=C=C. The peaks of intensive absorption in the region of 2600-3700 cm-1
characterizes carbonyl group aromatic a number of types CH2-COOH, C=C-COOH.
In table 5 and fig.5 shows the main peaks according to the results of infrared spectral analysis of dry residue after filtration.
From fig.5 and table 5 data follows
- 1049-1060 absor ption spectra with wavelengths characteristic of phosphorus
compounds, P=O (with hydrogen bonds) - 952-906 typical P-F and phosphates - absorption spectra with wavelengths of
1020-1090 characterize the presence of cottrell dust in compounds of silicates with valence relations Si-O-Si
- absorption spectra in the region 800-802 characteristic of silicate compounds charge materials in the valence state of Si-O-Ca and Si-O-Al10
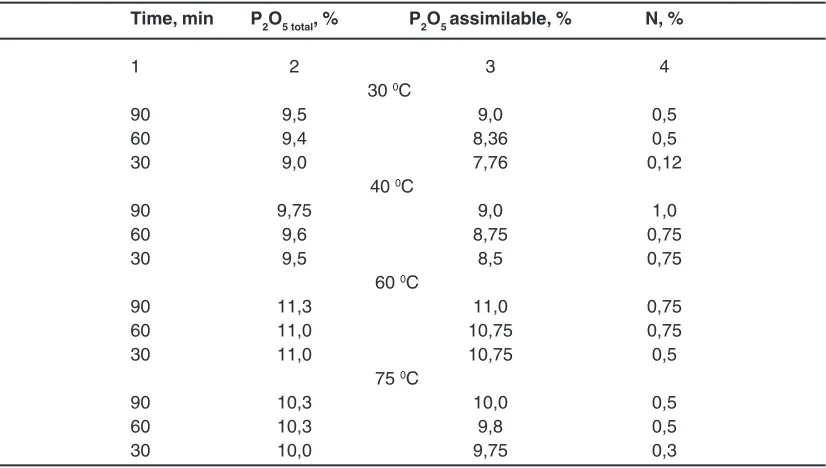
Studied optimal regime parameters to the production of liquid complex fertilizers. The results are shown in table 6 and fig.6.
- temperature – 60 0C
- for the duration of the process – 90 min. CONCLUSION
Thus, on the basis of a mixture of phosphorus sludge and vermiculite in conditions of temperature 60 degrees and at optimum process duration of 90 minutes it is possible to obtain liquid complex fertilizer with the content of assimilable phosphoric anhydride - 11%, nitrogen is 0.75%, zinc is 0.60%; the dry residue obtained after the stage filtration, is composed of : phosphor – of 10.96% (calculated
as P2O5 – 25%, including P2O5 assimilable – 15%, P2O5 water-soluble – 8,75%), in line with double superphosphate; the source of the vermiculite used in the process of decomposition of the phosphate of secondary raw materials, is a highly effective stabilizing additive, which are used to improve soil structure, referred to as the “agronomic” rock. The residual part of the utility and double superphosphate humic acid will fulfill the role of organic-mineral additives, which improve the soil structure, and show the quality of the protective compositions of plants from pests and diseases.
Fig. 6: The dependence of the process at 600C
Table 6: The results of the research of optimal regime parameters
Time, min P2O5 total, % P2O5 assimilable, % N, %
1 2 3 4
30 0C
90 9,5 9,0 0,5
60 9,4 8,36 0,5
30 9,0 7,76 0,12
40 0C
90 9,75 9,0 1,0
60 9,6 8,75 0,75
30 9,5 8,5 0,75
60 0C
90 11,3 11,0 0,75
60 11,0 10,75 0,75
30 11,0 10,75 0,5
75 0C
90 10,3 10,0 0,5
60 10,3 9,8 0,5
REFERENCES
1. Kapranov, V.N., The use of natural fertilizers and mineral nutrition of field crops. Author’s abstract of Doctoral thesis. Moscow, 2009. 2. Nazarbek, U.B.; Besterekov, U; Petropavlovsky,
I.A.; Nazarbekova, S.P.; Beisenbayev, O.K.,
Orien. J. Chem., 2015, 31(3), 1409-1416.
3. The field of mining raw materials of Kazakhstan: guide. Almaty, 2000.
4. Ivanova, L.A.; Kotelnikov, V.V.; Bykova, A.E., Physico-chemical transformation of the mineral vermiculite into the substrate for growing plants. Bulletin of MSTU, 2006, 9, 885-891.
5. Nazarbek, U.B.; Besterekov, U; Nazarbekova, S.P.; Bolysbek A.A., Orien. J. Chem., 2015,
31(1), 215-221.
6. Ulianova, O.A., Ecological and agrochemical
assessment of fertilizer compositions to increase the productivity of the system soil-plant. Author’s abstract of Doctoral thesis. Ulan-Ude, 2011.
7. Bolatbekuly, O.; Aitureyev, M.; Nazarbek, U.B., Bulletin of KazNRTU, 2016, 6(118), 541-545.
8. Nazarbek, U.B.; Besterekov, U; Nazarbekova, S.P.; Beisenbayev, O.K.; Bolysbek A.A., Orien.
J. Chem., 2016, 32(4), 2027-2033.
9. Besterekov, U; Nurasheva, K.K.; Nazarbek, U.B.; Nazarbekova, S.P.; Bolysbek A.A., Orien.
J. Chem., 2017, 33(1), 92-103.