CEP Discussion Paper No 763
December 2006
The Effect of Trade Liberalization on Informality and
Wages: Evidence from Mexico
Abstract
This paper studies the impact of NAFTA on informality and real wages in Mexico. Using a dynamic industry model with firm heterogeneity, it is predicted that import tariff elimination could reduce the incidence of informality by making more profitable to some firms to enter the formal sector, forcing the less productive informal firms to exit the industry, and inducing the most productive formal firms to engage in trade. The model also predicts market share reallocations towards the most productive firms, and an increase in real wages due to the increased labour demand by these firms. Using data on Mexican and U.S. import tariffs together with the Mexican National Survey of Urban Labour (ENEU), I find that reductions in the Mexican import tariffs are significantly related to reductions in the likelihood of informality in the tradable industries. I also find that informality decreases less in industries with higher levels of import penetration, while it decreases more in industries that are relatively more export oriented. Finally, I confirm that the elimination of the Mexican import tariffs is related to an increase in real wages, and that the elimination of the U.S. import tariff has contributed to the expansion of the formal-informal wage differentials.
Keywords: trade liberalization, informality, wage differentials JEL Classifications: F00, F02, F14, F15, F16, J00, J21, J23, J31
Data: Mexican National Survey of Urban Labour (ENEU) 1989-2002; Law of General Import and Export Tariffs (TIGIE) 1989-2002 (Publicly available at Diario Oficial de la Federacion, Mexico), NBER U.S. Tariff Database.
This paper was produced as part of the Centre’s Labour Markets Programme. The Centre for Economic Performance is financed by the Economic and Social Research Council.
Acknowledgements
I am very grateful to Alan Manning for his advice. I also thank Barbara Petrongolo, Steve Pischke, Steve Redding, Ricardo Sousa, Mariano Bosch, Regis Barnichon, Ghazala Azmat, and participants at the LSE Labour Economics Work in Progress Seminar for their comments. Gonzalo Hernandez must be thanked for sharing the labour survey database, and Arturo Ramirez for sharing the industry-level data from the industrial survey. Financial support from CONACYT (Consejo Nacional de Ciencia y Tecnología) is acknowledged.
Benjamin Aleman-Castilla is an Occasional Research Assistant at the Centre for Economic Performance, London School of Economics. Email: [email protected]
Published by
Centre for Economic Performance
London School of Economics and Political Science Houghton Street
London WC2A 2AE
All rights reserved. No part of this publication may be reproduced, stored in a retrieval system or transmitted in any form or by any means without the prior permission in writing of the publisher nor be issued to the public or circulated in any form other than that in which it is published.
Requests for permission to reproduce any article or part of the Working Paper should be sent to the editor at the above address.
© B. Aleman-Castilla, submitted 2006 ISBN 0 7530 2069 6
1. Introduction
Over the last 25 years many Latin American countries have abandoned their import-substitution strategies in order to embrace free trade. While it has been found that this change in policy helped the region to recover from the 1980s period of stagnation and crises by increasing exports, investment, productivity and growth, there has not been any sign of beneficial effects from trade liberalization on the allocation of labour between the formal and the informal sector, the latter defined as the set of economic activities often, but not exclusively, carried out in small firms or by the self-employed, which elude government requirements such as registration, tax and social security obligations, as well as health and safety rules (Roberts, B. R. (1989)). Under the absence of unemployment benefits and a well developed social insurance system, one could think of working in the informal sector as the best alternative for a worker who loses his formal job and is not able to return to the formal sector, either temporarily or permanently, because going into unemployment would leave him receiving no income at all. In fact, one can think of the informal sector as a competitive sector with relatively free worker entry. It is not difficult to find examples of free entry to the informal sector: just think for example of a worker that loses his or her job and becomes a street vendor or opens an informal food stand in his own house. The investment required in both cases is minimal and in general there are no
“bureaucratic” or similar kinds of barriers to do so1.
This paper focuses precisely on analyzing whether trade liberalization leads to an increase or a decrease in the rate of informality. It adds to the existing literature by analyzing the 1990s Mexican experience. The North American Free Trade Agreement
came into effect on the 1st of January, 1994 and, according to the legal text, its general
objective was to create a free-trade zone, through the establishment of clear and permanent rules for commerce, so as to help increasing trade volume and investment,
as well as generating new employment opportunities and better living standards2. The
impact that NAFTA and other trade liberalization processes have had on the Mexican
1
Cases in which there could be “bureaucratic” barriers to entry are those activities that are controlled by an informal, clandestine union. An example is perhaps car washing in Mexico City. The only investment a person needs to make in order to enter the business is a bucket and a cloth, but it is well known that this activity is usually controlled by a person or a group that decides if the new car washer will be allowed to work or not, and it normally depends on paying a regular “fee”. However, even though this is common practice, the power of these groups is often limited to a small zone or a particular neighbourhood, and the new entrant can always choose to move to another one or to join a more convenient group.
2
labour market outcomes and living standards has been previously studied by a number of researchers. Among others, Revenga, A. (1995) analyzes how Mexico’s 1985-87 trade liberalization affected average employment and earnings; Hanson, G. H. (1994) studies the effect of economic integration with the United States on state-industry employment growth in Mexico. In another paper (Hanson, G. H. (2003)) he examines the impacts of trade and investment liberalization on the wage structure of Mexico. Finally, Nicita, A. (2004) performs an ex-post analysis of the effects of the trade liberalization process in Mexico between 1989 and 2000 on labour income and welfare. However, none of these previous studies has dealt with the effect of trade liberalization on the size of the informal sector.
Recent estimates by the World Bank (Maloney, W. F. (1999)) suggest that between 30 and 40% of the Mexican labour force works in the informal sector. From here, the importance of this phenomenon is evident: First, it implies that a significant fraction of Mexican workers are unprotected, which puts them in a vulnerable bargaining position with their employers. Second, it also means that the corresponding proportion of labour income in the country does not generate fiscal revenue, and this is directly reflected in the quantity and the quality of the public goods and services provided by the state. And third, as the results in this paper will show, informality disproportionately affects the less favoured groups, such as the low-skilled workers. This intensifies the problems of inequality and poverty for the country as a whole. Furthermore, the informal sector does not seem to shrink with economic growth. In the case of Mexico, while real GDP grew at an average quarterly rate of 3.17% between 1990 and 2002, the rate of informality also increased and, as estimated in this paper, it passed from about 47% to approximately 49% of total employment.
Informality is also an important characteristic of the labour markets in other developing countries. Goldberg, P. K. and N. Pavcnik (2003) analyze the cases of Brazil and Colombia, two countries that joined the General Agreement on Tariffs and Trade (GATT) and where the rates of informality are approximately 35% and 50% of the labour force, respectively. They conclude that trade liberalization did not have any significant effect on the size of the informal sector in these countries. Currie, J. and A. Harrison (1997) study the effect of trade reforms on capital and labour in Morocco during the 1980s, and they find that state-owned firms increased employment by hiring low-paid temporary workers. Even though these previous studies suggest a null or positive effect of the elimination of barriers to trade, the study of the 1990s
Mexican experience could provide more conclusive evidence, given that it involves a free trade agreement with the largest economy in the world, which means the bilateral elimination of import tariffs and at the same time a privileged access for the Mexican firms to a much wider market.
The present study uses a dynamic industry model with heterogeneous firms to analyse the possible implications of trade liberalization on the rate of informality. By making more profitable to some firms to enter the formal sector rather than the informal sector, forcing the less productive informal firms to exit the industry, and inducing the most productive formal firms to engage in trade, the model predicts that it is possible for trade liberalization to reduce the incidence of informality. Both the exit of the least productive firms and the additional export sales gained by the more productive firms reallocate market shares towards the more productive firms and contribute to an aggregate productivity increase. The increased labour demand by the more productive firms (due to their larger market shares) will tend to increase more the real wages in industries that experience larger tariff cuts.
These implications seem to be confirmed by the econometric analysis, which mainly relates data on both Mexican and U.S. import tariffs to the Mexican National Survey of Urban Labour (ENEU) for the period 1989 through 2002. To preview the results, reductions in the Mexican import tariffs are found to reduce significantly the likelihood of informality in the tradable sectors: a 1-percentage point decline in the Mexican import tariff reduces the probability of informality in a given industry by 0.392 percentage points. Combining the trade data with information from the Mexican input-output matrices available to date, an import tariff is also mapped to the non-tradable sectors. The corresponding estimates indicate that the reduction in this weighted tariff, even though positively correlated with, has not have a significant impact on the rate of informality, meaning perhaps that the beneficial effect of trade liberalization has not spread outside the tradable industries. Also, when the import tariffs are interacted with different measures of exposure to trade for the manufacturing sectors –which are constructed using data from the Mexican Annual Industrial Survey (EIA), it is found that for a given reduction in the Mexican import tariff, informality decreases less in industries with higher levels of import penetration; while for a given reduction in the U.S. import tariff, the rate of informality decreases more in those industries that are relatively more export oriented. Finally, analyzing the effect of trade liberalization on the industry employment shares and the
composition of informality within industries, it is found that reductions in the U.S. import tariffs are related to an increase in the proportion of workers in a given industry, that reductions in the Mexican import tariff generate a decrease in the fraction of informal self-employed, and that the elimination of the U.S. import tariff seems to have a reallocation effect within the informal labour force, from informal salaried to either self-employment or unpaid work.
Regarding the predictions for the wage distribution, this study confirms the conclusions by many other previous studies, in the sense that the elimination of the Mexican import tariff has contributed to increase wages. Industries with larger tariff cuts experienced larger increases in real wages. Finally, the effect of trade liberalization on the wage gap between formal and informal workers is also analyzed here, and it is found that the elimination of the U.S. import tariffs on Mexican products has contributed to the widening of this wage differential in the tradable industries.
The rest of this paper is organized as follows: Section 2 presents the theoretical framework. Section 3 provides some background on the Mexican trade liberalization process. Section 4 gives a description of the main datasets used. Section 5 presents a preliminary analysis of the relationship between trade liberalization and the rate of informality. Section 6 develops the corresponding econometric analysis. Section 7 studies the parallel implications for wages. Section 8 concludes.
2. How Could Trade Liberalization Affect Informality?
In order to give an answer to this question, three things must be considered: first, it is necessary to model the decision process of firms facing the option of producing either in the formal or the informal sector. Second, it is also necessary to incorporate a framework that is able to explain how trade liberalization affects the performance of firms. And third, these two points have to be put together. Under these considerations, a dynamic industry model with firm heterogeneity like the one in Melitz, M. J. (2003) can be used to describe the way in which trade liberalization could affect the rate of informality. The original model shows how the exposure to trade induces only the more productive firms to export while simultaneously forcing the least productive firms to exit. Both the exit of the least productive firms and the additional export sales
gained by the more productive firms reallocate market shares towards the more productive firms and contribute to an aggregate productivity increase. Profits are also reallocated towards more productive firms. This model does not consider different sectors within an industry in which firms could produce, but as shown below, it is relatively easy to include this possibility.
2.1. The decision of becoming formal.
To begin, as in the original model, assume that the preferences U of the
representative consumer are given by a C.E.S. utility function over a continuum of
goods indexed by ω. As shown by Dixit, A. and J. Stiglitz (1977), in such a case
consumer behaviour can be modelled by considering the set of varieties consumed as
an aggregate good Q≡U with an aggregate price P. Optimal consumption and
expenditure decisions for individual varieties can then be defined as:
( )
( )
( )
( )
σ σ ω ω ω ω − − ⎥⎦ ⎤ ⎢⎣ ⎡ = ⎥⎦ ⎤ ⎢⎣ ⎡ = 1 P p R r P p Q q (1)where p
( )
ω is the price for variety ω,P is the aggregate price, R is the aggregateexpenditure, and σ refers to the constant elasticity of substitution between any two
goods. There is a continuum of firms in the industry, each one producing a different
variety. The only factor of production is labour, inelastically supplied at level L, an
index of the economy’s size. The cost function exhibits constant marginal cost with a
fixed overhead cost. Labour used is thus a linear function of output q:
firms accross different 0 sector a in firms all common to and 0 , > > + = ϕ ϕ f q f l (2)
where f represents the fixed overhead cost, and ϕ is a productivity parameter. Each
firm in the domestic market faces a residual demand curve with constant elasticity σ
and thus chooses the same profit maximizing mark-up equal to σ
(
σ −1)
=1 ρ.Under these assumptions, the profits of a particular firm can be expressed as the difference between its revenue and the cost of labour:
( )
⎟⎟ ⎠ ⎞ ⎜⎜ ⎝ ⎛ + − = ϕ ϕ π pq w f q (3)where w is the real wage, common to all firms in a particular industry. Substituting
p from (1), maximizing (3) with respect to q, and using the resulting expression for
the profit-maximizing level of output back in this same equation leads to:
( )
wf w k ⎟ − ⎠ ⎞ ⎜ ⎝ ⎛ = −ρ ρ ϕ ϕ π 1 (4) where( )
⎟⎟ ⎠ ⎞ ⎜⎜ ⎝ ⎛ − = − ρ ρ ρ 1 ρ 1 1 0 P k and P QσP 10 = . Equation (4) is a general expression for
the maximum level of profits as a function of the productivity parameter, ϕ. In the
Melitz, M. J. (2003) model, there are two types of firms: exporters and non exporters. Non-exporters derive profits only from their sales in the domestic market, and these could be represented by a function like the one in (4). Exporters instead get their profits both form their sales in the domestic and the foreign markets. Selling in
foreign markets implies incurring an extra marginal cost τ of shipping product units
abroad, as well as a fixed cost fX of entering the foreign markets. Therefore, the total
profits of an exporting firm can be expressed as the sum of the typical profit function for a non-exporting firm and another function that represents the profits obtained from
exports: πX
( ) (
ϕ =kϕ τw)
ρ(1−ρ) −wfX. In the present context, apart from thesedifferences between traders and non traders, there might be differences in the profit functions of firms in the formal sector with respect to firms in the informal sector. Consider first the characteristics of the informal firms. Because of their informal status, firms in the informal sector cannot take advantage of any of the trade promoting programs conducted by governmental institutions such as the Secretariat of Finance, the Secretariat of Economy, or the National Bank for Foreign Trade
(BANCOMEXT)3, and it is more difficult for them to import machinery and
equipment than for formal firms, since importing would imply exposure to the
3
For a review of the main governmental programs and instruments for promoting Mexico’s exports, see MATTAR,J. (1998): "Export Promotion in Mexico," Integration and Trade 4/5. Institute for the
customs authority and, therefore, to the government. Thus, assume that informal firms cannot import nor export. Also, given that firms in the informal sector evade taxes,
every period they face a positive probability γ of being caught by the government. If
this happens, the government may force them to pay a fine equal to a fraction ε >0
of its profits. On the other hand, firms in the formal sector pay taxes and worker benefits over wages, so they do not need to hide from the authorities. They can also get involved in trade and thus have access to more intermediates and are in general more productive than firms in the informal sector. In the present framework, for a partition of firms between formal and informal sectors to exist in equilibrium, and in order to get the bigger and more productive firms being formal, the marginal costs of production in the formal sector are modelled as being lower than those in the informal sector, but the fixed overhead costs in the former are assumed to be higher, so that the combination of both ends being higher than the fixed overhead cost in the informal sector. Regarding the marginal costs, the above can be interpreted as saying that the fact that formal firms do not need to hide away from the authorities, that they have access to better intermediates, and that they are generally more productive, more than compensates for having to pay taxes and worker benefits. As for the higher fixed overhead costs, it represents the fact that opening a business in the formal sector implies complying with a number of regulations that the informal sector avoids (e.g. registration, bureaucracy, and corruption). Furthermore, as described above, whenever a formal firm gets involved in trade, it has to pay taxes on imported inputs and exports (per-unit costs), and there is also a fixed cost of entering a foreign market, that does not vary with the volume of exports (i.e. they have to find and inform prospective clients about their products, learn about the practices and rules in the new market, comply with foreign regulations and standards, and set up new distribution channels). As before, for a partition of the formal sector between traders and non-traders to exist in equilibrium, trade costs have to be relatively higher than formality costs.
Thus, to put the above discussion more formally, let 0<α <1 represent the taxes and
worker benefits paid by the formal firms over wages, let β represent the fraction by
which productivity is higher in the formal sector relative to the informal sector, and
let fI and fF represent the fixed overhead costs in the informal sector and the formal
sector, respectively. It is assumed that α <β and that fF > fI. Also, as in the Melitz,
(i.e. tariffs), and let fX represent the fixed costs of entering the trading sub-sector.
Given that access to trade increases the variety and quality of intermediate goods
available for the formal firms, one could think of β as being affected by the degree of
exposure to trade. In particular, βτ <0. For a partition between traders and
non-traders within the formal sector to exist, it is assumed that the trade costs relative to the overhead production cost in the formal sector are above a threshold level, or that
F
X f
f >
−1 σ
τ . The per-unit trade costs are modelled in the standard iceberg
formulation, whereby τ >1 units of a good must be shipped in order for 1 unit to
arrive at destination.
At the margin, the decision of a firm of whether to become informal or formal will be based on the comparison of the profits that it could make in the informal sector and the profits that it could make in the non-trading formal sector only. Using equation (4) together with the above assumptions leads to the following profit functions for these two types of firms:
( )
( )
( )
(
(
)
)
(
)
⎪ ⎪ ⎩ ⎪ ⎪ ⎨ ⎧ + − ⎥ ⎦ ⎤ ⎢ ⎣ ⎡ + + = − ⎥⎦ ⎤ ⎢⎣ ⎡ = = − − formal trading -non if 1 1 1 informal if 1 1 F F I I wf w k wf w k α α ϕ β ϕ π ϕ ϕ π ϕ π ρ ρ ρ ρ (5)A firm will choose to become formal whenever its expected profits in this sector are
higher than the expected profits in the informal sector; this is πFe
( )
ϕ ≥πIe( )
ϕ .Recalling that firms in the informal sector face a positive probability of being caught by the government and of paying a fraction of their profits as a fine, this condition
defines a cut-off productivity level for firms entering into the formal sector, ϕF*:
( ρ)
[
(
α)
(
γε)
]
ρρ ϕ − − ⎭ ⎬ ⎫ ⎩ ⎨ ⎧ + − − = 1 1 1 * 1 1 kB f f w F I F (6) where(
γε)
α β ρ ρ − − ⎟ ⎠ ⎞ ⎜ ⎝ ⎛ + + = − 1 1 1 1B . Any firm with a productivity parameter above ϕ*F
of firms in the formal and the informal sectors. Similarly, a firm drawing productivity
ϕ produces in the industry if at least the expected revenue from operating in the
informal sector covers the expected fixed overhead costs of production, i.e.
( )
ϕ ≥0πe
I . This defines an overall zero-profit productivity cut-off for the industry,
*
ϕ . Finally, a firm operating in the formal sector will choose to engage in trade
whenever its productivity parameter is such that the extra profits from trade are
nonnegative, πX
( )
ϕ ≥0. This also defines a cut-off productivity level for the tradingsub-sector, ϕ*X.
2.2. The effects of trade liberalization.
In the Melitz, M. J. (2003) model, trade liberalization comes through a reduction in
the per-unit trade costs. A decrease in τ would increase the cut-off productivity level
for the industry ϕ*, and at the same time it would decrease the cut-off productivity
level for the trading sub-sector, ϕ*X. This forces the least productive firms to exit and
at the same time it generates entry of new firms into the trading sub-sector. There is also a reallocation of market shares and profits from the least productive to the most productive firms, which contributes to an aggregate productivity gain. Finally, the expanded exposure to trade offers new profit opportunities only to the more
productive firms who can cover the entry cost fX , and it also induces more entry of
new firms to the industry, as prospective firms respond to the higher potential returns associated with a good productivity draw. These two effects together increase the labour demand and therefore tend to bid up the real wages in the industry.
To see the implications of this mechanism for the formal/informal decision, note that
the cut-off productivity level for formality depends on P0 through k, and P0 in turn
depends on the aggregate productivity level in the industry. ϕ*F is also a function of
real wages, w, and the productivity differential between the formal and informal
firms (through B), β. In the present framework, these are the three channels through
which trade liberalization could affect the decision of a firm of whether to become formal or to stay in the informal sector.
First, if there is no effect on β, then the only channel in which trade liberalization
increases the cut-off productivity ϕ* and the aggregate productivity level in the
industry. As shown in appendix A, P0 would not change, and given that trade
liberalization increases the labour demand of the new trading firms and the new prospective entrants to the industry, then the real wages in the industry will also tend
to increase. As can be seen in equation (6), ϕ*F is an increasing function of wages,
hence:
Proposition 1. If trade liberalization reduces τ , then: 1) real wages in the industry
will increase; 2) ϕ*F will increase, inducing less firms to enter the formal sector; 3)
*
ϕ will increase, forcing the least productive informal firms to exit the industry; 4) *
X
ϕ will decrease, inducing more formal firms to enter the trading sub-sector and increasing their employment share; and 5) there will be an ambiguous effect in the employment share of the informal sector. (proof: see appendix B)
The effect of trade liberalization on wages has been extensively studied by different researchers. For example, Hanson, G. H. (2003) examines the impact of trade liberalization on the wage structure of Mexico during the 1990s. He finds that the policy reforms resulted in an increase of wage dispersion due to an increase in the demand of skill, a reduction of the rents in industries that prior to the reform paid their workers higher wages, and a larger premium for workers in states sharing a border with the United States. Hanson, G. H. and A. Harrison (1999) study the effect of trade liberalization on Mexican wages for the pre-NAFTA period. Using data on Mexican manufacturing plants from 1984 to 1990 and from the Mexican industrial census for 1965-1988, they find that the reduction in tariff protection in 1985 disproportionately affected low-skilled workers. Cragg, M. and M. Epelbaum (1996) also analyze the Mexican case for the 1987-1993 period, and find that the wages of urban workers with completed primary education fell relative to the wages of those with higher levels of schooling. Finally, Attanasio, O., P. K. Goldberg and N. Pavcnik (2003) investigate the effects of the 1980s and 1990s tariff reductions on the wage distribution of Colombia. They identify the increasing returns to college education, the changes in industry wages that hurt sectors with initially lower wages and a higher fraction of unskilled workers, and shifts of the labour force towards the informal sector as the main channels through which trade liberalization affected the wage
distribution in that country. Thus, although the effect of trade liberalization on wages has been widely studied before, section 7 of this paper will present new evidence on this subject that confirms the important relationship between trade policy and labour income, and it will also contribute to the existing literature by analyzing the effect of trade liberalization on the wage gap between the formal and the informal sectors, which has not been studied before.
On the other hand, there might be an effect on the productivity differential, β. This
could be so because firms in the formal sector may benefit more from trade liberalization than firms in the informal sector, given that they can get involved in trade and therefore have access to better and more intermediates coming from abroad. Thus,
Proposition 2. If trade liberalization increases productivity in the formal sector, then:
1) points 1, 3, and 4 in proposition 1 will still hold; 2) there will be an ambiguous effect on ϕ*F; and 3) there will be an ambiguous effect in the employment share of the informal sector. (proof: see appendix C)
Intuitively, if the productivity differential between formal and informal firms increases, then the profits of the formal firms relative to those of the informal firms will also be larger than before. Formal firms will tend to get bigger and at the same time informal firms will tend to get smaller, which will bid up the real wages and could increase the employment share of the formal sector. To date, there is plenty of evidence on the fact that trade liberalization helps in increasing productivity. To mention some examples: Fernandes, A. M. (2003) explores Colombian trade policy from 1977 to 1991. Using a panel of manufacturing plants, she finds a strong positive impact of trade liberalization on productivity. Ferreira, P. C. and J. L. Rossi (2003) analyze the Brazilian trade liberalization process of 1988 to 1990. Using industry level data, they find large and widespread productivity improvements across industries after trade barriers were reduced. Pavcnik, N. (2002) investigates the effects of liberalized trade on plant productivity in Chile. Using plant-level data on Chilean manufacturers, she finds evidence of within plant productivity improvements that can be attributed to trade liberalization for the plants in the import-competing sector. Harrison, A. (1994) measures the relationship between productivity and trade reform using a panel of firms from Ivory Coast. She finds a positive association between
more open trade policies and higher productivity growth. The pre-NAFTA Mexican case has also been analyzed before. Tibout, J. and M. Westbrook (1995) examine the effects of trade liberalization on productivity for the period 1984 through 1990. Using plant-level data provided to them by the Mexican Secretariat of Commerce and Industrial Development (nowadays the Secretariat of Economy), they find that average costs in most industries fell with trade liberalization. For importables, the authors find that the cost reductions were due partly to improvements in relative productivity, whereas for exportables they seem to be due to favourable changes in relative prices (imported intermediate goods becoming cheaper).
Overall, the model presented in this section opens the possibility for the effect of trade liberalization on informality to be negative; that is, more trade liberalization leading to a lower rate of informality. In the context of the Mexican experience under NAFTA, the previous propositions could translate in the following hypotheses regarding the bilateral elimination of the import tariffs:
a. A lower Mexican import tariff allows firms in the formal sector to obtain cheaper
inputs, machinery and equipment from the United States, which leads to an increase in their productivity. This effect would contribute to the reallocation of profits and labour from the less efficient informal firms to more efficient formal ones, increasing the employment share of the formal sector.
b. A reduction in the Mexican import tariff cuts down the costs for U.S. firms of
operating in Mexico, in the sense that it now becomes cheaper to open a plant in Mexico and import intermediate inputs and materials from the U.S. These new, more productive entrants will increase labour demand in the formal sector and this could as well reduce informality.
c. A lower U.S. import tariff benefits the Mexican producers by allowing them to
access the U.S. market in a cheaper and easier way. This would generate new profit opportunities, particularly for the more productive firms in the formal sector that are able to export, leading to an increase in their labour demand and raising real wages.
At the end, after liberalization, one could then observe lower informality rates and higher wages in more productive industries, and perhaps higher informality rates in less productive ones.
3. Trade Policy Background
The beginning of the Mexican trade liberalization process can be traced back to 1986, when the country became a member of the General Agreement on Tariffs and Trade (GATT) and stopped its import-substitution industrialization strategy. According to Kate, A. t., C. Macario and G. Niels (2000), and Revenga, A. (1995), the main consequences of these changes in trade policy were: (a) a reduction in the coverage of import license requirements from 100% of the domestic production in 1982 to 25.4% by December 1987, and to 16.5% in 1993; (b) a reduction in the maximum import tariff from 100% in 1985 to 20% in 1988; (c) a reduction of the average import tariff in the manufacturing sector from 23.5% in 1985 to 11% in 1988; and (d) a reduction in the coverage of reference prices in the manufacturing sector from 18.7% in 1985 to 0% in 1988.
In 1993 the country expanded its trade liberalization process by signing the North American Free Trade Agreement (NAFTA) with the United States and Canada, which
took effect on the 1st of January 1994, and that aims at the total elimination of import
tariffs by 2008. The agreement sets up a trade liberalization calendar that classifies products and by-products in 5 different groups, according to the date and way in
which the corresponding import tariffs were going to be eliminated4:
- Group A: products and/or by-products for which tariffs were completely
eliminated on the 1st of January 1994.
- Group B: products and/or by-products for which tariffs were gradually eliminated
in 5 equal annual stages, starting on the 1st of January, 1994, and finishing by the
1st of January, 1998.
- Group C: products and/or by-products for which tariffs were gradually eliminated
in 10 equal annual stages, starting on the 1st of January, 1994, and finishing by the
1st of January, 2003.
- Group C+: products and/or by-products for which tariffs were gradually
eliminated in 15 equal annual stages, starting on the 1st of January, 1994, and
finishing by the 1st of January, 2008.
4
The text of the North American Free Trade Agreement and the calendar for Mexico’s tariff elimination process can be found at the Mexican Secretariat of Economy’s website: http://www.economia-snci.gob.mx/sic_php/ls23al.php?s=502&p=1&l=1
- Group D: products and/or by-products for which there were no tariffs before and after NAFTA.
Apart from tariff elimination, NAFTA also contemplates the partial elimination of many barriers to trade in services and to cross-border investment.
After 1994, Mexico signed other trade agreements with several countries, such as Colombia and Venezuela (1995); Costa Rica (1995); Bolivia (1995); Nicaragua (1998); Chile (1999); the European Union (2000); Israel (2000); El Salvador, Guatemala and Honduras (2001); Iceland, Norway, Liechtenstein and Switzerland (2001); Uruguay (2004); and Japan (2005). Nevertheless, NAFTA remains the most important event for the Mexican trade policy in the last 20 years, as the United States
is by far the largest trading partner of the country5.
4. Trade and Labour Data
The present study focuses on trade liberalization under NAFTA, and specifically on the import tariff elimination part of the agreement. It uses data on both Mexican and U.S. tariffs. The Mexican data covers the 1988-2002 period and was collected directly from the Law of General Import and Export Tariffs (TIGIE), published by the Mexican government in the Official Journal of the Federation (Diario Oficial de la Federación). During this period the TIGIE was totally modified in February 1988, December 1995 and January 2002. It was also subject to several partial modifications between these years: 84 between 1988 and 1995, and 46 between 1995 and 2002. Among these changes are those regarding NAFTA and its liberalization calendar, starting on January 1994. The data includes ad-valorem tariffs only. Regarding the U.S. tariffs, the data comes from the NBER U.S. Tariff Database, constructed by
Robert C. Feenstra, John Romalis and Peter K. Schott6, and which is based on the
Harmonized Tariff Schedule of the United States (HTS). It includes ad-valorem,
5
According to data published by the Mexican National Institute of Statistics, Geography and Computing (INEGI), FOB imports from the U.S. represented on average 69% of total Mexican FOB imports between 1990 and 2005. See http://dgcnesyp.inegi.gob.mx/cgi-win/bdieintsi.exe/Consultar.
6
See: FEENSTRA,R.C., J.ROMALIS, and P.K.SCHOTT (2002): "U.S. Imports, Exports and Tariff Data,
1989-2001," NBER Working Paper Series. The database is freely available at
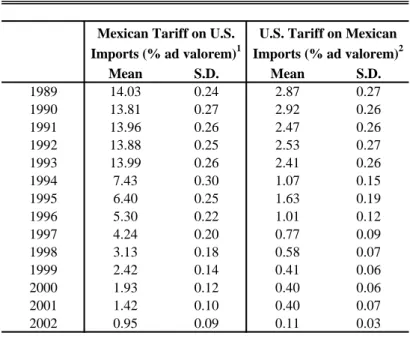
Table 1: Production-Weighted Average Import Tariffs 1989-2002 Mexican Tariff on U.S.
Imports (% ad valorem)1
U.S. Tariff on Mexican Imports (% ad valorem)2 Mean S.D. Mean S.D. 1989 14.03 0.24 2.87 0.27 1990 13.81 0.27 2.92 0.26 1991 13.96 0.26 2.47 0.26 1992 13.88 0.25 2.53 0.27 1993 13.99 0.26 2.41 0.26 1994 7.43 0.30 1.07 0.15 1995 6.40 0.25 1.63 0.19 1996 5.30 0.22 1.01 0.12 1997 4.24 0.20 0.77 0.09 1998 3.13 0.18 0.58 0.07 1999 2.42 0.14 0.41 0.06 2000 1.93 0.12 0.40 0.06 2001 1.42 0.10 0.40 0.07 2002 0.95 0.09 0.11 0.03
Calculations by the author. Weights equal to the share of Mexican sector production on national GDP.1Source: Diario Oficial de la Federacion (Mexico).2Source: NBER U.S. Tariff Database.
specific and estimated ad-valorem equivalent (AVE) tariffs based on the MFN rate of the HTS. The file also indicates products that are eligible for tariff preferences under free trade agreements such as with Canada and Mexico, and indicates products eligible for any preferential programs such as the Generalized System of Preferences (GSP). This database covers the period 1989-2001, and was complemented with the year 2002 for the present study, using the original documents of the U.S. tariff
schedule published by the United States International Trade Commission7. Both the
Mexican and the U.S. tariff schedules are based on the International Harmonized System, the global system of nomenclature that is used to describe most world trade in goods. The annual production-weighted average tariffs and their standard deviations are reported in table 1. The trade data is linked to individual level data from the Mexican National Survey of Urban Employment (ENEU), carried out by the National Institute of Statistics, Geography and Computing (INEGI) since 1983. It provides information about the state of the Mexican labour market, the main socio-demographic characteristics of the household members aged 12 and above, and housing in the principal urban areas of the country. Among other things, the ENEU provides information about employment status, duration of unemployment, job
7
characteristics (position, size of workplace, social security coverage, industry affiliation, etc), hours worked, quality of job, and job search. The social security coverage data is used to generate an indicator for the informal workers. A person is classified as working in the informal sector if he or she runs a firm of 6 or less
employees and does not have any kind of social or health insurance (informal
self-employed), if he or she works for a firm of any size and does not have any kind of
social or health insurance (informal salaried), and if he or she works without
receiving any kind of payment (unpaid workers). This definition is similar to the one
suggested by Maloney, W. F. (1999). The main socio-demographic characteristics covered by the survey are age, gender, kinship, marital status, schooling, place of birth, number of children, and migratory status. Regarding housing, the ENEU obtains information about type of dwelling, ownership, size, services, and construction materials.
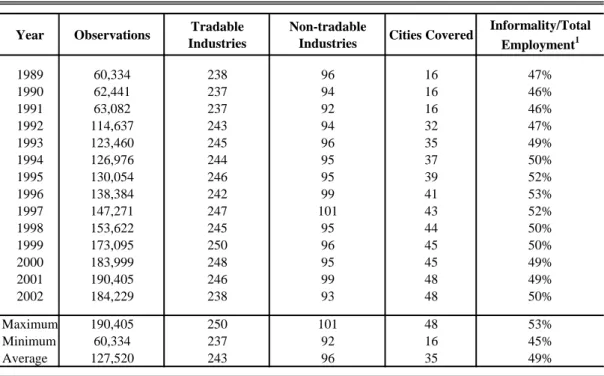
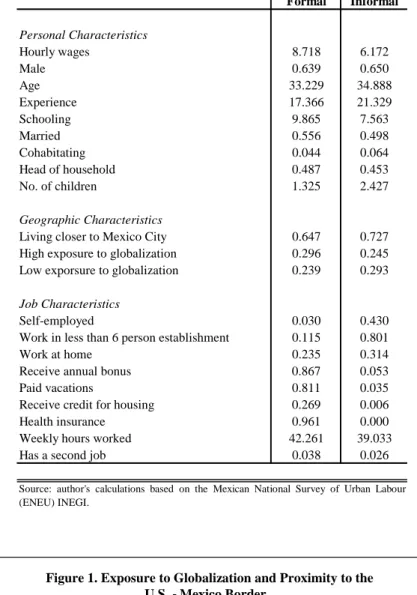
The survey is carried out on a quarterly basis. The sample is divided in five independent panels (waves), and each one of them stays in the sample for five consecutive quarters. From 1983 to 1984 it covered only the three main cities in Mexico (Mexico City, Guadalajara and Monterrey). From 1985 to 1991 its coverage was expanded to 16 cities, including also the main cities at the US-Mexico border (Ciudad Juarez, Matamoros, Nuevo Laredo and Tijuana). In 1992 other 18 cities were included in the survey, and in the subsequent years another 14 cities were added. By the fourth quarter of 2000 there were 48 cities covered by the ENEU (and approximately 51.2% of the total population of the country was living in these cities by that time). This study uses mainly the April-June interviews for each year between 1989 and 2002. Only employed people are included in the sample. Matching the ENEU industry codes with the tariff codes yields an average of 243 tradable industries and 96 non-tradable industries per year. Table 2 reports some of the main characteristics of the sample for each one of the years covered here, and table 3 summarizes worker characteristics in the formal and the informal sectors for the 1994 April-June interview. From the latter it can be seen that hourly wages, years of schooling and the fraction of married workers tend to be higher in the formal sector. The likelihood of being informal also appears to be lower for the heads of the household. Regarding the geographic characteristics, the table suggests that informality rates are higher in places closer to Mexico City than to the Mexico-U.S.
Table 2: Labour Data. Sample Characteristics by Year Year Observations Tradable
Industries
Non-tradable
Industries Cities Covered
Informality/Total Employment1 1989 60,334 238 96 16 47% 1990 62,441 237 94 16 46% 1991 63,082 237 92 16 46% 1992 114,637 243 94 32 47% 1993 123,460 245 96 35 49% 1994 126,976 244 95 37 50% 1995 130,054 246 95 39 52% 1996 138,384 242 99 41 53% 1997 147,271 247 101 43 52% 1998 153,622 245 95 44 50% 1999 173,095 250 96 45 50% 2000 183,999 248 95 45 49% 2001 190,405 246 99 48 49% 2002 184,229 238 93 48 50% Maximum 190,405 250 101 48 53% Minimum 60,334 237 92 16 45% Average 127,520 243 96 35 49%
Source: Mexican National Survey of Urban Employment (ENEU), INEGI. Calculations based on samples restricted to employed people.1Estimated as the fraction of employed people that are (a) patrons in a firm with less than 6 employees and that do not have social or health insurance, (b) employees in a firm of any size and that do not have social or health insurance, and (c) employees that do not receive payment.
border8, and lower in places with high exposure to globalization, as measured by
Hanson, G. H. (2004)9. At first glance this might appear to be redundant, as one may
think that cities closer to the Mexico-U.S. border are those located in states with high exposure to globalization. However, figure 1 shows that the mapping between these two characteristics is not perfect. Finally, regarding the job characteristics, the table indicates that the rate of self-employment is much higher in the informal sector than in the formal one. The fraction of people working in establishments of less than 6 persons is also higher, as well as the fraction of people working at home. By the definition of informality used here, no one in the informal sector receives any kind of social or health insurance.
8
The fraction of people living closer to Mexico City than to the U.S.-Mexico border is estimated with a variable that takes the value 0 if the road distance (in kilometres) from a particular city to the closest major U.S.-Mexico border crossing is shorter than the road distance between that city and Mexico City. It takes the value 1 otherwise. The distance data comes from the Secretariat of Transport and Communications. The four major border crossings are Tijuana-San Diego, Nogales, Ciudad Juarez-El Paso, and Nuevo Laredo-Laredo.
9
He measures regional exposure to globalization through the share of maquiladora value added,
foreign direct investment, and imports in state GDP, each one averaged over the period 1993-1999. Hanson sorts states according to their average rank across the three measures and selects as high-exposure states those whose average rank is in the top third, while low-high-exposure states are those whose average rank is in the bottom third. The high-exposure states are Baja California, Chihuahua, Nuevo Leon, Sonora, Jalisco, Tamaulipas and Aguascalientes. The low-exposure states are Zacatecas, Quintana Roo, Nayarit, Colima, Guerrero, Veracruz, Chiapas, Campeche, Hidalgo and Oaxaca.
Table 3: Formal and Informal Workers 1994 Formal Informal Personal Characteristics Hourly wages 8.718 6.172 Male 0.639 0.650 Age 33.229 34.888 Experience 17.366 21.329 Schooling 9.865 7.563 Married 0.556 0.498 Cohabitating 0.044 0.064 Head of household 0.487 0.453 No. of children 1.325 2.427 Geographic Characteristics
Living closer to Mexico City 0.647 0.727 High exposure to globalization 0.296 0.245 Low exporsure to globalization 0.239 0.293
Job Characteristics
Self-employed 0.030 0.430 Work in less than 6 person establishment 0.115 0.801 Work at home 0.235 0.314 Receive annual bonus 0.867 0.053 Paid vacations 0.811 0.035 Receive credit for housing 0.269 0.006 Health insurance 0.961 0.000 Weekly hours worked 42.261 39.033 Has a second job 0.038 0.026
Source: author's calculations based on the Mexican National Survey of Urban Labour (ENEU) INEGI.
States with high exposure to globalization1 States with low exposure to globalization1
Cities closer to the U.S.- Mexico border than to Mexico City2 Mexico City
1
Exposure to globalization as measured by Hanson, G.H. (2004 )
2
Proximity is measured by road distance (kilometers)
Figure 1. Exposure to Globalization and Proximity to the U.S. - Mexico Border
5. Trade Liberalization and Informality: Preliminary Analysis
The analysis of the relationship between trade liberalization and informality in this paper begins by looking at the behaviour of the average import tariffs and informality rate across time. As shown in table 2, the city coverage of the ENEU survey doubled in 1992. The 16 original cities passed from representing 100% of the observations
before 1992 to approximately 40% afterwards10. This is a drastic modification that
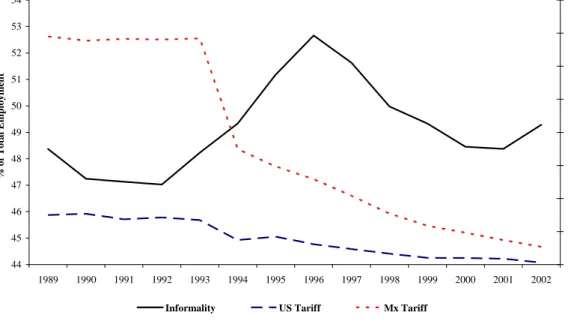
could affect the estimation of the yearly average rate of informality. In order to control for this possible bias, the rate of informality is obtained from a regression of the indicator for informality defined above on a set of city and time dummies, using all the years available in the sample. The estimated year coefficients are then the estimates of the annual average informality rate after controlling for the cities included in the survey. These coefficients are finally rescaled so that their mean is equal to the mean of the informality rate obtained when using the raw data. The informality rate and import tariffs series are plotted in Figure 2. The average Mexican import tariff on U.S. products remained basically constant at around 14% ad valorem between 1989 and 1993. It then dropped to 7% in the first year of NAFTA (1994), and continued to decrease gradually to approximately 1% in 2002. The U.S. import tariff
Figure 2: Average Import Tariffs and Informality
44 45 46 47 48 49 50 51 52 53 54 1989 1990 1991 1992 1993 1994 1995 1996 1997 1998 1999 2000 2001 2002 % of Tot a l Em ploym en t 0 2 4 6 8 10 12 14 16 % Ad Va lo rem
Informality US Tariff Mx Tariff
10
The 16 original cities are Mexico City, Guadalajara, Monterrey, Puebla, León, San Luis Potosí, Tampico, Torreón, Chihuahua, Orizaba, Veracruz, Mérida, Ciudad Juárez, Tijuana, Nuevo Laredo, and Matamoros. These cities represent approximately 35% of the total population of the country.
on Mexican products also remained relatively constant between 1989 and 1993, at around 3%. This low level of pre-NAFTA tariffs reflects the fact that, according to the United States International Trade Commission, Mexico was already being benefited with the Generalized System of Preferences by qualifying as a Beneficiary
Developing Country11. This average tariff then decreased to 1% during the first year
of NAFTA, increased temporarily to 2% in 1995 as a response to the Mexican peso crisis, and continued to decrease gradually to approximately 0.1% in 2002. Regarding the share of informality, the figure shows a positive trend starting in 1992 and reaching its peak just after the crisis in 1996, making the average rate to increase from 48% to 53% of total employment. It then decreased gradually to 49% in 2002. From figure 2 is difficult to see a clear relationship between trade liberalization and informality. On one hand, comparing the level of the latter in the first and the last years of the period suggests that this rate moved to a higher permanent level, and this would imply a negative relationship between tariff reduction and the rate of
informality12. But according to the 1992-1996 positive trend, the transition to this new
permanent level of informality began 3 years before the implementation of NAFTA, indicating that the change may be due to factors other than the reduction in the import tariffs. On the other hand, there is a negative trend in informality between 1996 and 2001, which coincides with the gradual reduction in both the Mexican and U.S. import tariffs, and this would suggest a positive relationship between the level of the tariffs and the rate of informality. But it is very likely that most of this negative trend is simply reflecting the recovery of the Mexican economy from the 1995 financial crisis.
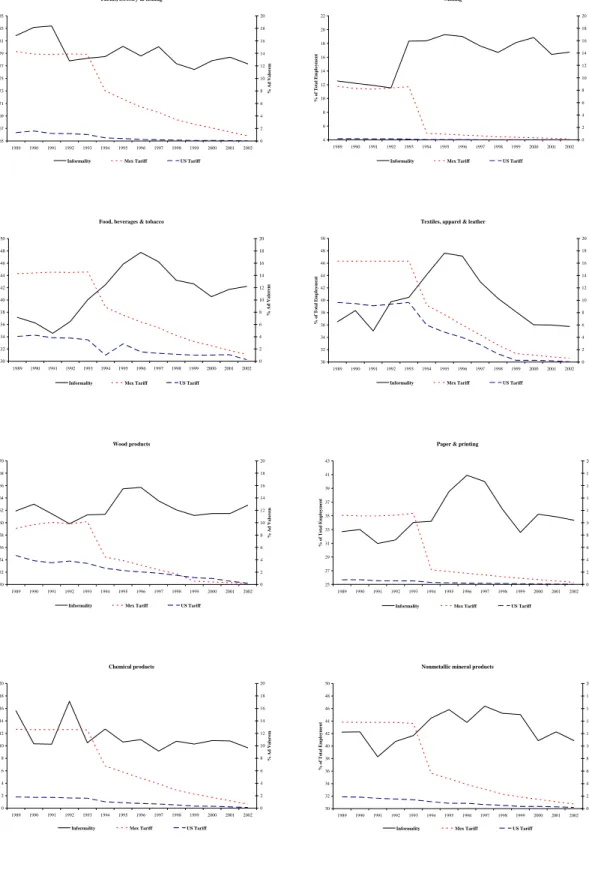
To analyze these series at a more disaggregated level, figure 3 decomposes figure 2 by economic sectors. Once again, an unambiguous relationship between the average tariffs and the rate of informality does not seem to be present. Perhaps the strongest
evidence of a positive relationship comes from the Primary metals and the Farms,
forestry & fishing sectors. The change to a new steady state level of informality is
clearer for the Mining and the Food, beverages & tobacco sectors. As in figure 2, the
11
For more detail, see the general notes on the Official Harmonized Tariff Schedule of the United States Annotated, from the HTSA Basic Publication in any year between 1989 and 1994. These documents can be found in the website mentioned in footnote 7.
12
The correlation coefficients for the series depicted in figure 2 are -0.546 between the Mexican import tariff and the rate of informality, and -0.484 between the latter and the U.S. import tariff.
Figure 3: Average Import Tariffs and Informality Rates by Sector
Farms, forestry & fishing
65 67 69 71 73 75 77 79 81 83 85 1989 1990 1991 1992 1993 1994 1995 1996 1997 1998 1999 2000 2001 2002 % of T o ta l E m p loy ment 0 2 4 6 8 10 12 14 16 18 20 % Ad Va lo re m
Informality Mex Tariff US Tariff
Mining 4 6 8 10 12 14 16 18 20 22 1989 1990 1991 1992 1993 1994 1995 1996 1997 1998 1999 2000 2001 2002 % of T o ta l E m pl oymen t 0 2 4 6 8 10 12 14 16 18 20 % Ad Va lo r em
Informality Mex Tariff US Tariff
Food, beverages & tobacco
30 32 34 36 38 40 42 44 46 48 50 1989 1990 1991 1992 1993 1994 1995 1996 1997 1998 1999 2000 2001 2002 % of To tal Employ ment 0 2 4 6 8 10 12 14 16 18 20 % Ad Valor em
Informality Mex Tariff US Tariff
Textiles, apparel & leather
30 32 34 36 38 40 42 44 46 48 50 1989 1990 1991 1992 1993 1994 1995 1996 1997 1998 1999 2000 2001 2002 % of T o ta l E m pl oymen t 0 2 4 6 8 10 12 14 16 18 20 % Ad Va lo re m
Informality Mex Tariff US Tariff
Wood products 50 52 54 56 58 60 62 64 66 68 70 1989 1990 1991 1992 1993 1994 1995 1996 1997 1998 1999 2000 2001 2002 % of T o ta l E m pl oymen t 0 2 4 6 8 10 12 14 16 18 20 % Ad Va lo re m
Informality Mex Tariff US Tariff
Paper & printing
25 27 29 31 33 35 37 39 41 43 1989 1990 1991 1992 1993 1994 1995 1996 1997 1998 1999 2000 2001 2002 % of T o ta l E m pl oymen t 0 2 4 6 8 10 12 14 16 18 20 % Ad Va lo re m
Informality Mex Tariff US Tariff
Chemical products 0 2 4 6 8 10 12 14 16 18 20 1989 1990 1991 1992 1993 1994 1995 1996 1997 1998 1999 2000 2001 2002 % of T o ta l E m p loymen t 0 2 4 6 8 10 12 14 16 18 20 % Ad Va lo re m
Informality Mex Tariff US Tariff
Nonmetallic mineral products
30 32 34 36 38 40 42 44 46 48 50 1989 1990 1991 1992 1993 1994 1995 1996 1997 1998 1999 2000 2001 2002 % of T o ta l E m pl oy m en t 0 2 4 6 8 10 12 14 16 18 20 % Ad Va lo re m
Figure 3 (continued) Primary metals 0 2 4 6 8 10 12 14 16 18 20 1989 1990 1991 1992 1993 1994 1995 1996 1997 1998 1999 2000 2001 2002 % o f To ta l E m p lo y m ent 0 2 4 6 8 10 12 14 16 18 20 % Ad Va lo re m
Informality Mex Tariff US Tariff
Machinery & equipment
5 7 9 11 13 15 17 19 21 23 25 1989 1990 1991 1992 1993 1994 1995 1996 1997 1998 1999 2000 2001 2002 % o f To ta l E m p loy m ent 0 2 4 6 8 10 12 14 16 18 20 % Ad Va lo re m
Informality Mex Tariff US Tariff
Other Manufacturing 35 37 39 41 43 45 47 49 51 53 55 1989 1990 1991 1992 1993 1994 1995 1996 1997 1998 1999 2000 2001 2002 % of Tot a l Em ploym ent 0 2 4 6 8 10 12 14 16 18 20 22 24 26 28
Informality Mex Tariff US Tariff
Non-Tradables 32 33 34 35 36 37 38 39 40 41 42 1989 1990 1991 1992 1993 1994 1995 1996 1997 1998 1999 2000 2001 2002 % of Tot a l Em pl oym e n t Non-Tradables
transition appears to begin before the implementation of NAFTA and to peak during the financial crisis. For the rest of the sectors, the behaviour of the rate of informality is either erratic or does not seem to be affected by the import tariff elimination process. The last panel in figure 3 summarizes the trends of informality in the non tradable sectors. The rate of informality increases with the Mexican crisis in 1995 and it does not decrease to its pre-1995 levels afterwards, indicating perhaps that any beneficial effect steaming from trade liberalization has not permeated significantly to these sectors.
Table 4 summarizes the changes of the import tariffs and the informality rate for the tradable sectors over the 1989-2002 period. It shows the percentage point changes from the 1989-91 to the 2000-02 averages. Six of the sectors experienced a reduction in their informality rates. The largest increase in the informality rate is of 5.6
percentage points in the Mining and Food, beverages & tobacco sectors, while the
largest decrease is of 5.2 percentage points in the Farms, forestry & fishing sector. It
can also be seen that the Textiles, apparel & leather and the Mining sector are the
1989-91 to 2000-02a Sector Informality Mex US
Farms, forestry & fishing -5.2 -12.6 -1.3
Mining 5.6 -8.1 -0.2
Food, beverage & tobacco 5.6 -12.6 -3.3 Textiles, apparel & leather 0.1 -15.5 -9.2
Wood products -0.7 -9.3 -3.4
Paper & printing 2.0 -10.6 -0.7
Chemical products -1.4 -11.4 -1.5
Nonmetallic mineral products 1.8 -12.7 -1.5
Primary metals -3.3 -11.5 -1.4
Machinery & equipment -1.6 -12.0 -0.8
Other manufacturing -1.6 -13.7 -0.6
Maximum 5.6 -8.1 -0.2
Minimum -5.2 -15.5 -9.2
Average 0.1 -11.8 -2.2
Table 4: Change in Import Tariffs and Informality by Sector (Percentage Points)
Source: author's calculations based on the Mexican National Survey of Urban Labour (ENEU) INEGI, Diario Oficial de la Federacion (Mexico), and the NBER U.S. Tariff Database.aChanges calculated as the difference between the 2000-02 and the 1989-91 averages.
the U.S. schedules13. The reduction in the Mexican import tariff is on average 9.6
percentage points larger than the change in the U.S. import tariff.
At an even higher level of disaggregation, tables 5 and 6 list the 50 most and the 50 less liberalized industries respectively, in terms of reduction in import tariff percentage points. For each of these industries, the tables show the 4-digit code used by INEGI in the ENEU, a brief description of the industry, the economic sector to which they belong, and the percentage point change between the 1989-91 and the 2000-02 average informality rate and import tariffs. The industries included in table 5 (table 6) are those that, when sorting all the industries in the sample according to the
13
The Mining sector was nonetheless the one with the lowest levels of pre-NAFTA tariffs. See figure
change of the Mexican and the U.S. import tariffs separately, appear in the top 100 (bottom 100) in both cases.
The main things to notice from the ranking in table 5 are the following: first, it is
dominated by the textiles, apparel & leather economic sector, with 25 industries in
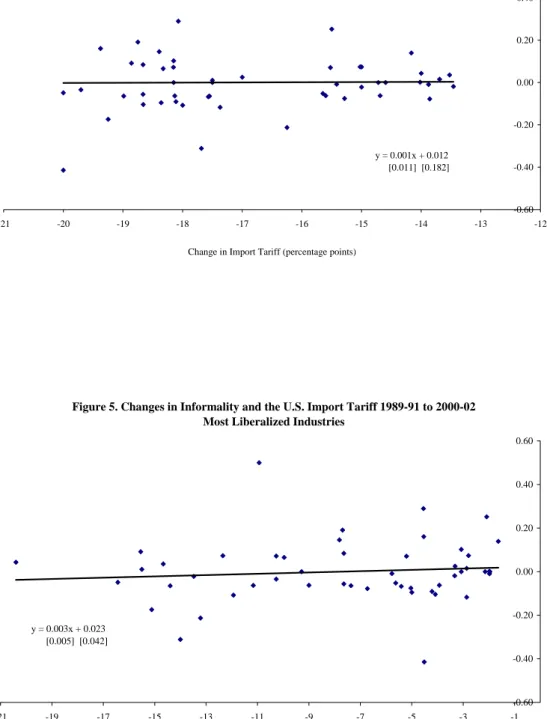
the list; second, 25 industries experienced a decrease in their rates of informality during this period; third, the largest reductions in import tariffs are of approximately 20 percentage points; and fourth, the change in the Mexican import tariff is on average 9.2 percentage points larger than the change in the U.S. import tariff. The missing data in the “Informality” column corresponds to industries that did not appear in the sample for some of the years considered here. The tariff and informality changes are plotted against each other in figures 4 and 5. The simple regression lines fitted in these figures suggest a slightly positive relationship between the reductions in imports tariff and the changes in informality.
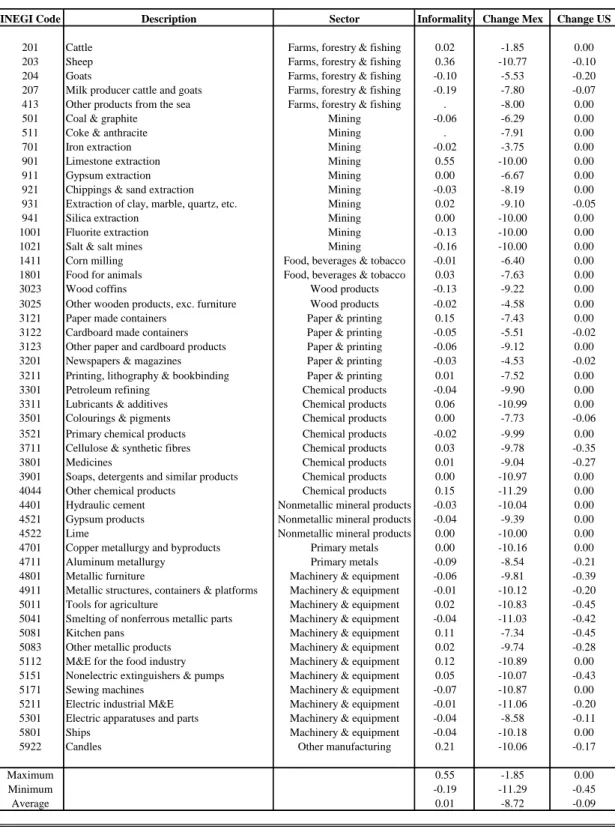
Regarding table 6, it can be seen that the Machinery & equipment and the Mining
sectors dominate the “least liberalized” ranking, with 12 and 10 industries respectively. 28 industries had their informality rates reduced, and the largest reductions in import tariffs are of approximately 11 percentage points. Notice that for many of these industries, the change in the U.S. import tariff is equal to zero because they were already fully liberalized in 1989-91, due to the Generalized System of Preferences. The decrease in the Mexican import tariff is on average 8.6 percentage points larger than the change in the U.S. import tariff. Figures 6 and 7 plot these import tariffs changes against the informality changes. The fitted regression lines indicate that, unlike the most liberalized industries, changes in the import tariffs are now negatively correlated with changes in informality.
Finally, table 7 offers a look at the evolution of informality in the non-tradable
sectors14. It shows the percentage point changes from the 1989-91 to the 2000-02
average rates. The Hotels, restaurants & trade sector is the only one that experienced
a reduction in informality, of about 0.5 percentage points. The largest increase is of 8
percentage points for the Financial services & real estate sector. The average change
in informality in the non-tradable sectors (bottom row in the table) is an increase of approximately 3 percentage points.
14
Petroleum & coal extraction is classified as non-tradable because of two reasons: first, it mainly
refers to petroleum extraction activities and not to the marketing of its outputs (such as oil or gas)
which are mostly included in the Chemical products sectors; and second, petroleum extraction in
Table 5: 50 Most Liberalized Industries
INEGI Code Description Sector Informality Change Mex Change US
105 Fruits Food, beverages & tobacco -0.10 -18.66 -4.08 205 Horses, mules and donkeys Farms, forestry & fishing 0.25 -15.50 -2.08 206 Poultry Farms, forestry & fishing -0.08 -15.28 -5.03 208 Lambs Farms, forestry & fishing . -14.60 -1.96 1112 Cream, butter, cheese Food, beverages & tobacco -0.08 -13.86 -6.72 1201 Dehydrated fruits and vegetables Food, beverages & tobacco -0.09 -18.11 -4.21 1202 Prepared and packed fruits and vegetables Food, beverages & tobacco -0.05 -15.65 -5.62 1602 Piloncillo, Panela or Mascabado Food, beverages & tobacco 0.00 -14.72 -2.15 1611 Ethyl alcohol Food, beverages & tobacco . -18.15 -3.07 1901 Regional candies and jelly Food, beverages & tobacco 0.08 -18.66 -7.64 1903 Candies and chocolates Food, beverages & tobacco -0.06 -18.66 -7.64 1942 Ice cream Food, beverages & tobacco 0.04 -13.52 -14.67 2001 Agave liquors Food, beverages & tobacco -0.41 -20.00 -4.51 2011 Non-fermented alcoholic beverages Food, beverages & tobacco 0.10 -18.15 -3.07 2012 Wines Food, beverages & tobacco 0.16 -19.38 -4.53 2201 Softdrinks and purified water Food, beverages & tobacco 0.03 -17.00 -3.32 2421 Threads Textiles, apparel & leather -0.06 -14.69 -9.00 2432 Cashmeres, cloths and similar products Textiles, apparel & leather 0.04 -14.00 -20.40 2601 Impregnated textiles Textiles, apparel & leather 0.29 -18.07 -4.55 2611 Padding and similar articles Textiles, apparel & leather -0.07 -17.57 -5.41 2612 Carpets and similar articles Textiles, apparel & leather -0.06 -15.60 -3.93 2613 Felts Textiles, apparel & leather 0.50 -20.00 -10.94 2614 Quilted textiles Textiles, apparel & leather -0.21 -16.25 -13.22 2621 Lace and similar articles Textiles, apparel & leather 0.07 -18.15 -10.27 2631 Cotton and bandages Textiles, apparel & leather -0.02 -15.00 -13.48 2641 Tapestry Textiles, apparel & leather -0.10 -18.36 -5.00 2642 Buttons, sequins, and similar articles Textiles, apparel & leather 0.09 -18.86 -15.54 2643 Sheets and tablecloths Textiles, apparel & leather -0.06 -18.99 -7.36 2644 Other textiles Textiles, apparel & leather 0.15 -18.39 -7.82 2701 Socks and tights Textiles, apparel & leather -0.05 -20.00 -16.43 2702 Sweaters and vests Textiles, apparel & leather -0.03 -19.70 -10.27 2703 Knitted articles Textiles, apparel & leather -0.17 -19.25 -15.12 2711 Male cloths, except shirts and uniforms Textiles, apparel & leather -0.06 -18.13 -11.17 2717 Underwear Textiles, apparel & leather . -17.50 -9.29 2721 Hats and caps Textiles, apparel & leather 0.07 -18.33 -9.96 2722 Palm-made hats Textiles, apparel & leather -0.11 -18.00 -11.94 2723 Gloves, handkerchiefs, ties and scarfs Textiles, apparel & leather -0.31 -17.68 -14.00 2801 Tanned leather Textiles, apparel & leather -0.06 -17.55 -14.40 2811 Leather products, exc shoes and clothes Textiles, apparel & leather 0.02 -13.69 -2.86 2812 Non-plastic shoes Textiles, apparel & leather 0.01 -17.50 -15.50 2821 Sandals and similar articles Textiles, apparel & leather 0.19 -18.75 -7.69 2901 Sawmill production Wood products 0.07 -15.02 -2.79 3001 Wooden furniture Wood products -0.01 -15.42 -5.77 3002 Box Spring mattresses Wood products 0.07 -15.00 -12.35 4201 Plastic tubes and contours Chemical products -0.02 -13.46 -3.33 4511 Bricks and tiles Nonmetallic mineral products 0.07 -15.52 -5.20 4512 Refractory products Nonmetallic mineral products 0.14 -14.16 -1.63 5601 Automobiles, trucks and tractors Machinery & equipment -0.01 -13.88 -1.97 5701 Metallic bodyworks and parts Machinery & equipment 0.00 -14.02 -1.98 5902 Watches and clocks Other manufacturing -0.12 -17.37 -2.87
Maximum 0.50 -13.46 -1.63
Minimum -0.41 -20.00 -20.40
Average 0.00 -16.88 -7.68
The change is calculated as the difference between the 2000-2002 and the 1989-1991 averages. The missing observations in the "Informality" column are due to the fact that such industries did not appear in the ENEU labour survey for some of the years considered here.
Figure 4. Changes in Informality and the Mexican Import Tariff 1989-91 to 2000-02 Most Liberalized Industries
y = 0.001x + 0.012 [0.011] [0.182] -0.60 -0.40 -0.20 0.00 0.20 0.40 0.60 -21 -20 -19 -18 -17 -16 -15 -14 -13 -12
Change in Import Tariff (percentage points)
Cha nge i n Inf o rmal it y (p erc e n ta ge poi nt s)
Figure 5. Changes in Informality and the U.S. Import Tariff 1989-91 to 2000-02 Most Liberalized Industries
y = 0.003x + 0.023 [0.005] [0.042] -0.60 -0.40 -0.20 0.00 0.20 0.40 0.60 -21 -19 -17 -15 -13 -11 -9 -7 -5 -3 -1
Change in Import Tariff (percentage points)
C h an g e in In fo rm al ity ( p er ce nt ag e po in ts )
Table 6: 50 Less Liberalized Industries
INEGI Code Description Sector Informality Change Mex Change US
201 Cattle Farms, forestry & fishing 0.02 -1.85 0.00 203 Sheep Farms, forestry & fishing 0.36 -10.77 -0.10 204 Goats Farms, forestry & fishing -0.10 -5.53 -0.20 207 Milk producer cattle and goats Farms, forestry & fishing -0.19 -7.80 -0.07 413 Other products from the sea Farms, forestry & fishing . -8.00 0.00
501 Coal & graphite Mining -0.06 -6.29 0.00
511 Coke & anthracite Mining . -7.91 0.00
701 Iron extraction Mining -0.02 -3.75 0.00
901 Limestone extraction Mining 0.55 -10.00 0.00
911 Gypsum extraction Mining 0.00 -6.67 0.00
921 Chippings & sand extraction Mining -0.03 -8.19 0.00 931 Extraction of clay, marble, quartz, etc. Mining 0.02 -9.10 -0.05
941 Silica extraction Mining 0.00 -10.00 0.00
1001 Fluorite extraction Mining -0.13 -10.00 0.00
1021 Salt & salt mines Mining -0.16 -10.00 0.00 1411 Corn milling Food, beverages & tobacco -0.01 -6.40 0.00 1801 Food for animals Food, beverages & tobacco 0.03 -7.63 0.00
3023 Wood coffins Wood products -0.13 -9.22 0.00
3025 Other wooden products, exc. furniture Wood products -0.02 -4.58 0.00 3121 Paper made containers Paper & printing 0.15 -7.43 0.00 3122 Cardboard made containers Paper & printing -0.05 -5.51 -0.02 3123 Other paper and cardboard products Paper & printing -0.06 -9.12 0.00 3201 Newspapers & magazines Paper & printing -0.03 -4.53 -0.02 3211 Printing, lithography & bookbinding Paper & printing 0.01 -7.52 0.00 3301 Petroleum refining Chemical products -0.04 -9.90 0.00 3311 Lubricants & additives Chemical products 0.06 -10.99 0.00 3501 Colourings & pigments Chemical products 0.00 -7.73 -0.06 3521 Primary chemical products Chemical products -0.02 -9.99 0.00 3711 Cellulose & synthetic fibres Chemical products 0.03 -9.78 -0.35
3801 Medicines Chemical products 0.01 -9.04 -0.27
3901 Soaps, detergents and similar products Chemical products 0.00 -10.97 0.00 4044 Other chemical products Chemical products 0.15 -11.29 0.00 4401 Hydraulic cement Nonmetallic mineral products -0.03 -10.04 0.00 4521 Gypsum products Nonmetallic mineral products -0.04 -9.39 0.00 4522 Lime Nonmetallic mineral products 0.00 -10.00 0.00 4701 Copper metallurgy and byproducts Primary metals 0.00 -10.16 0.00 4711 Aluminum metallurgy Primary metals -0.09 -8.54 -0.21 4801 Metallic furniture Machinery & equipment -0.06 -9.81 -0.39 4911 Metallic structures, containers & platforms Machinery & equipment -0.01 -10.12 -0.20 5011 Tools for agriculture Machinery & equipment 0.02 -10.83 -0.45 5041 Smelting of nonferrous metallic parts Machinery & equipment -0.04 -11.03 -0.42 5081 Kitchen pans Machinery & equipment 0.11 -7.34 -0.45 5083 Other metallic products Machinery & equipment 0.02 -9.74 -0.28 5112 M&E for the food industry Machinery & equipment 0.12 -10.89 0.00 5151 Nonelectric extinguishers & pumps Machinery & equipment 0.05 -10.07 -0.43 5171 Sewing machines Machinery & equipment -0.07 -10.87 0.00 5211 Electric industrial M&E Machinery & equipment -0.01 -11.06 -0.20 5301 Electric apparatuses and parts Machinery & equipment -0.04 -8.58 -0.11 5801 Ships Machinery & equipment -0.04 -10.18 0.00 5922 Candles Other manufacturing 0.21 -10.06 -0.17
Maximum 0.55 -1.85 0.00
Minimum -0.19 -11.29 -0.45
Average 0.01 -8.72 -0.09
The change is calculated as the difference between the 2000-2002 and the 1989-1991 averages. The missing observations in the "Informality" column are due to the fact that such industries did not appear in the ENEU labour survey for some of the years considered here.
Figure 6. Changes in Informality and the Mexican Import Tariff 1989-91 to 2000-02 Less Liberalized Industries
y = -0.0103x - 0.080 [0.008] [0.073] -0.30 -0.20 -0.10 0.00 0.10 0.20 0.30 0.40 0.50 0.60 -12.00 -10.00 -8.00 -6.00 -4.00 -2.00 0.00
Change in Import Tariff (percentage points)
Ch ange in I n fo rm ality ( p er ce n ta ge p o in ts )
Figure 7. Changes in Informality and the U.S. Import Tariff 1989-91 to 2000-02 Less Liberalized Industries
y = -0.028x + 0.007 [0.123] [0.021] -0.30 -0.20 -0.10 0.00 0.10 0.20 0.30 0.40 0.50 0.60 -0.50 -0.45 -0.40 -0.35 -0.30 -0.25 -0.20 -0.15 -0.10 -0.05 0.00 Change in Import Tariff (percentage points)
C h a n g e in In form a lit y (pe rc e n ta g e po in ts)
Sector 1989-91 to 2000-02a
Petroleoum & coal extraction 5.4
Construction 2.1
Electricity, gas & water 1.8
Hotels, restaurants & trade -0.5
Transport & storage 2.3
Financial services & real estate 8.0 Personal, professional and social services 1.7
Maximum 8.0
Minimum -0.5
Average 3.0
Table 7: Changes in Rates of Informality for the Non-tradable Sectors (Percentage Points)
Source: author's calculations based on the Mexican National Survey of Urban Labour (ENEU) INEGI, Diario Oficial de la Federacion (Mexico), and the NBER U.S. Tariff Database. a Changes calculated as the difference between the 2000-02 and the 198