and
Your health
Heat in the Heartland
60 Years of Warming in the Midwest
Union of Concerned Scientists.
Todd Sanford is a climate scientist with the Climate & Energy Program of the Union of Concerned Scientists. Jalonne L. White-Newsome is the Kendall Science Fellow in Climate Change & Public Health at the Union of Concerned Scientists.
Laurence S. Kalkstein is a research professor in the Department of Geography and Regional Studies at the University of Miami.
Jennifer K. Vanos is a consultant for Applied Climatologists, Inc.
Kirsten Weir is a freelance science writer.
A c k n O w l e d g m e n T S
This report was made possible through the generous support of the Barr Foundation, The Energy Foundation, the Fresh Sound Foundation, The Grantham Foundation for the Protection of the Environment, the Scherman Foundation, The Viola Fund, and members of the Union of Concerned Scientists.
The authors would like to express their gratitude to the many people at UCS who provided thoughtful review of the report, including Steven Frenkel, Angela Anderson, Kathleen Rest, Rachel Cleetus, Brenda Ekwurzel, Peter Frumhoff, Heidi Moline, Lisa Nurnberger, and Nancy Cole.
External reviewers including Claudia Tebaldi (Climate Central), Marie S. O’Neill (University of Michigan School of Public Health), Richard B. Rood (University of Michigan), Rupa Basu (CA Office of Environmental Health Hazard Assessment), George Luber, Gino Marinucci, and Paul J. Schramm also pro- vided invaluable feedback on an earlier version of this report. Lexi Shultz made substantial contributions to its develop- ment, and the authors would like to thank her for her efforts. We are greatly appreciative of Nancy Cole, Dena Adler, Bryan Wadsworth, Sandra Hackman, and David Gerratt for their tireless dedication to the production of the report.
Organization affiliations are for identification purposes only. The opinions expressed in this report are the sole responsibility of the authors.
© July 2012
Union of Concerned Scientists All rights reserved
Photos: (top to bottom) © iStockphoto.com/Mari; © JupiterImages; © iStockphoto.com/Ridofranz; © iStockphoto.com/Lisa F. Young; © iStockphoto.com/bowdenimages
Cover photos: (top, L to R) © iStockphoto.com/Sandra L. Nicol; © iStockphoto.com/agentry; © iStockphoto.com/LSOphoto;
(bottom, L to R) © iStockphoto.com/EdStock; © iStockphoto.com/gchutka; © Gary Braasch
c O n T e n T S
2 Executive Summary
5 Introduction
9 How We Analyzed Summer
Weather Trends in the Midwest
10 Accounting for Urban Heat Island Effects
11 Evaluating Daytime and Nighttime Trends
12 Findings: The Midwest
Is Heating Up
12 Changes in Summer Weather Patterns
14 Changes in Overnight Temperature, Humidity, and Heat Index
16 What the Future Could Bring
17 The Impact of Dangerous
Summer Weather on Health
18 Quantifying the Health Effects of Extreme Heat
23 Climate Change and Hot Weather
25 Building Resilient Communities
25 How Communities Can Protect Health during Extreme Heat 27 How Midwest Cities Are
Taking Action
30 Where Do We Go from Here?
31 References
36 Endnotes
Figures
7 Figure 1: The Heat Index 8 Figure 2: Source Regions and
Movements of Air Masses
11 Figure 3: Sample Heat Index Forecast for July 21, 2011
13 Figure 4: Frequency of Moist Tropical+ Air Masses in St. Louis from 1946 to 2011
16 Figure 5: A Future with More Days above 90°F
21 Figure 6: Heat Disorders 23 Figure 7: Scorching Summers
Become the Norm
24 Figure 8: Southern Weather Comes to Illinois
Table
20 Projected Deaths Each Year from Extreme Summertime Heat
Boxes
6 Weather 101 8 Types of Air Masses 11 Spotlight on 2011
13 A Closer Look at Our Trend Analysis 18 City-by-City Results
22 How Heat Affects Health
26 Tools and Programs for Adapting to Climate Change
Heat in the Heartland
60 Years of Warming in the Midwest
Executive Summary
Sweltering summer heat is not only uncomfortable but can also be lethal. Heat is actually the biggest weather-related killer in the United States, claiming, on average, more lives each year than floods, light-ning, tornadoes, and hurricanes combined. High temperatures can lead to dehydration, heat exhaus-tion, and heatstroke, especially among vulnerable populations. These include the elderly, children, and people with preexisting medical conditions such as cardiovascular and respiratory disease, or other chronic diseases such as diabetes.
T
h e s u m m e r o f 2011 wa s a scorcher. all but eight states reported above-average summer temperatures, and four states broke records for extreme heat. such sticky, steamy, uncomfortable weather is poised to be-come even more common as our climate warms. But hot, humid days are not just uncomfortable. extreme heat kills. from 1999 to 2003, a total of 3,442 deathsresulting from exposure to extreme heat were reported (CDC 2006a). and these figures are likely to be lower than the real toll. medical examiners vary in the way they characterize heat-related deaths, sometimes mis-classifying them as stemming from other causes (Basu and samet 2002).
high temperatures can lead to dehydration, heat exhaustion, and deadly heatstroke. Very hot weather can also aggravate existing medical conditions, such as diabetes, respiratory disease, kidney disease, and heart disease (Basu 2009; mastrangelo et al. 2007; semenza et al. 1999). urban residents, the elderly, children, agricultural workers, and people with impaired health and limited mobility are particularly susceptible to heat-related illness and death (Basu 2009; o’Neill and ebi 2009; CDC 2008). air pollutants such as ozone and particulate matter may also work in concert with heat, exacerbating its health effects (Basu 2009). Dangerous heat is not just a future concern.1 some
71 percent of respondents to a march 2012 poll of voters in Green Bay, wI, and Grand rapids, mI, be-lieved that weather patterns in their area have changed in recent years (mellman Group 2012).
Through original research, we found that hot sum-mer weather and heat waves have indeed become more common, on average, in the nation’s heartland over the last six decades. In other words, many baby boomers living in the midwest have already faced these changes during their lifetimes.
we focused on the midwest because it has many large population centers and is projected to see an in-crease in heat waves as the climate warms (o’Neill and ebi 2009; meehl and Tebaldi 2004). with its highly variable climate, the midwest is also one of the most sensitive regions when it comes to human responses to excessive heat.
Heat waves have become more common over the
last six decades, on average, in the five large midwestern
cities we studied. Scientists project that this trend
will worsen over the next century.
© T
hinkst
We drew on weather data from the 1940s and 1950s to the present to determine how changes in summer heat have already affected the more than 65 million people who live in the Midwest. We targeted five large cities—Chicago, Cincinnati, Detroit, Minneapolis, and St. Louis—to gain a deeper understanding of the local effects of extreme heat, which can inform efforts to minimize health risks.
Cincinnati
Chicago
Minneapolis
Detroit
St. Louis
To better understand weather trends across this region, we analyzed weather in five major urban areas and five nearby smaller cities: Chicago and Peoria, IL; Cincinnati and Toledo, oh; Detroit, mI; Lexington, KY; minneapolis and rochester, mN; and st. Louis and Columbia, mo. we examined changes in sum-mertime weather patterns using information dating back to the 1940s and 1950s, when complete digital weather records became available in those cities. we focused on weather systems called air masses: vast bodies of air that define the weather around us. we explored whether the number of days with danger-ously hot summer air masses, which are linked to human health risks, as well as cool, dry summer air masses has changed over the last 60 years.
we also examined how average daytime and night-time temperatures and humidity levels within these weather systems have changed over time. we did so because high temperature, lack of cooling relief at night, and high humidity all contribute to heat-related illness (Poumadere et al. 2005; wexler 2002).
we aimed not only to understand how summer weather has changed in the midwest, but also to shed light on the importance of city-level efforts to mini-mize the health risks of future climate change. Key findings of our research include:
• Dangerously hot summer days are becoming more common across the midwest. This trend poses growing risks for public health and well- being.
• The characteristics of this dangerous weather are also changing. hot air masses have become hotter and more humid during nighttime hours, for example. In some cities, nighttime summer temperatures within some types of air masses rose as much as 4° to 5°f over six decades. • The number of hot, humid days has increased,
on average, across the midwest since the 1940s and 1950s, while hot, dry days have become hotter.
• Heat waves lasting three days or longer have also become more common over the last six decades.
Photos: (Chicago) © iStockphoto.com/Veni; (Detroit) © iStockphoto.com/DenisTangneyJr; (Minneapolis) © iStockphoto.com/Davel5957; (St. Louis) © iStockphoto.com/Kubrak78; (Cincinnati) © iStockphoto.com/Davel5957 Map: NOAA (© 2012 Google; © 2012 Cnes/Spot Image; © 2012 TerraMetrics)
Dangerously hot summer days are becoming more common, and summer nights hotter and more humid, across the Midwest, on average. These trends pose growing risks to public health and well-being. (Above left: Minneapolis. Above right: Chicago.)
Today st. Louis has about four more dangerous three-day heat waves each year than it did in the 1940s, for example.
• Relief from heat is harder to find. All the cities we studied now have fewer cool, dry days in the summer.
• While urban heat island effects play a role in higher air temperatures in large midwestern cities, smaller cities recorded similar increases in the number of hot summer days. This suggests that higher sum-mer temperatures are not due solely to such effects.
implications of our findings
These findings suggest several implications for public health. The weather types that have become more com-mon in the midwest—very hot, humid air masses, and hot, dry air masses—are associated with heat-related illness and death (National weather service 2005; sheridan and Kalkstein 2004; ebi et al. 2004). Very hot, humid air masses increase the risk of hyperther-mia—elevated body temperature—while hot, dry air masses raise the risk of dehydration (Vanos et al. 2010; epstein and moran 2006; mairiaux, malchaire, and Candas 1987).
heat waves, which are also becoming more com-mon, further affect human health (sheridan and Kalk-stein 2010). rising overnight temperatures are also problematic, because a lack of nighttime relief increases the risk of heat-related complications (Poumadere et al. 2005).
we cannot ignore the potential consequences of climate change, including the risk of deadly heat waves. we must invest in preventive measures to protect public health and save lives during extreme heat events. as this report shows, the cities we studied are already taking steps to minimize the health effects of danger-ous hot weather. however, many other cities are still woefully unprepared.
we must also take aggressive action to reduce heat-trapping emissions from the burning of fossil fuels. If we do not, temperatures will likely continue to rise (National research Council 2011), and we will have to cope with the effects of extreme heat on our daily lives, our health, and our economy for decades to come. we need strategies to both build climate-resilient communities and reduce the global warming emissions that are driving climate change. our health and well-being—and those of our children—depend on it.
Without aggressive action to reduce global warming emissions, the world our children live in will most likely be much hotter.
© iStockphoto.com/jimkruger © Sam Spade
© iStockphoto.com/Mari © iStockphoto.com/STEFANOLUNARDI © iSt ock phot o.c om/Chr ist opherB er nar d
Introduction
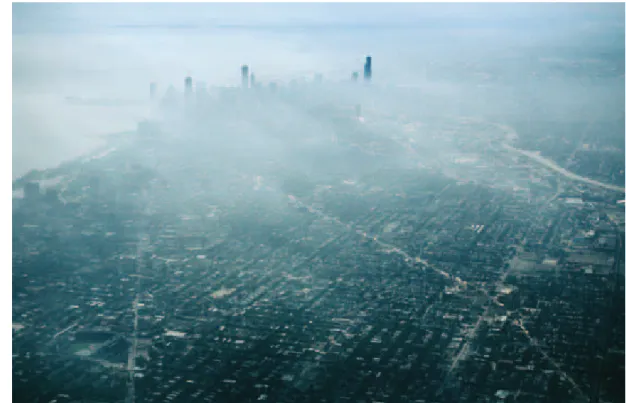
In summer 2010, large portions of western Russia, including Moscow, endured an intense heat wave that—along with wildfires that blanketed the city with toxic smog—killed tens of thousands of people nationwide. Continued emissions of heat-trapping gases are projected to make heat waves more likely in the future. Above, people wear face masks to protect their lungs while visiting Moscow’s Red Square.
T
h e s u m m e r o f 2011 wa s a scorcher. It was the hottest summer since the infamous Dust Bowl era of the 1930s, with 42 states reporting above-normal tem-peratures, and four states breaking records for extreme heat (National Climatic Data Center 2011).such weather isn’t just uncomfortable. extreme heat kills. from 1999 to 2003, 3,442 deaths resulting from exposure to extreme heat were reported (CDC 2006a). heat waves in the recent past have struck the mid-west hard. for example, heat waves in st. Louis and Kansas City, mo, in July 1980 caused a 57 percent and 64 percent increase in deaths, respectively (Jones et al. 1982). a heat wave in milwaukee that year con-tributed to 91 deaths (weisskopt et al. 2002). one of the most infamous u.s. heat waves occurred in July 1995, when record-setting temperatures gripped Chicago. more than 700 deaths in the city were even-tually attributed to that extreme heat event (Palecki et al. 2001). hospitals faced 1,072 more admissions than average—mostly for dehydration, heatstroke, and heat exhaustion (semenza et al. 1999).2
such a tragedy occurred again on an even larger scale in the summer of 2003, when a heat wave and result-ing wildfires in western europe killed as many as 70,000 people (robine et al. 2008). another extreme heat event in 2010 led to an estimated 55,000 deaths across russia (Barriopedro et al. 2011).
such tragedies could become more common as the planet warms, especially if heat-trapping emissions from sources such as vehicles, power plants, and defor-estation continue to climb. Climate models project that some regions will see more intense, more frequent, and longer-lasting extreme heat events in the second half of this century (o’Neill and ebi 2009; meehl and Tebaldi 2004).
To uncover trends that may already be occurring, we investigated whether the number of dangerously hot summer days—as well as cool, dry summer days— has changed over time in five large midwestern cities and five smaller cities over the past six decades. we focused on the midwest because it has numerous major population centers, and is projected to face more
heat waves as the climate warms (o’Neill and ebi 2009; meehl and Tebaldi 2004).
This report presents the results of our original re-search. we did not design our study to determine whether the trends we found stem from human-caused climate change. however, the results from these 10 cit-ies can inform efforts to cope with the health risks of future climate change. Toward that end, we also exam-ined what the five large midwestern cities are already doing to prepare for dangerous summer heat events.
Heat waves in the recent past
have struck the Midwest hard. Such
weather isn’t just uncomfortable—
extreme heat kills.
© John R
ich
What is Weather?
Weather is the short-term state of the lower atmo-sphere, or troposphere—the air mass that surrounds us. Weather includes day-to-day temperature, precipi-tation, wind, and cloud cover. Climate, in contrast, refers to average atmospheric conditions over decades or longer (NASA 2005).
What is a heat Wave?
The National Weather Service usually defines heat waves as periods of abnormally and uncomfortably hot and unusually humid weather (National Weather Service 2009a).
The weather service issues heat advisories and ex-cessive heat warnings when predicting unusual periods of hot weather.
However, there is no universal definition for heat wave: it typically reflects not only weather patterns but also a population’s ability to cope with a temperature spike. What people might call a heat wave in New Eng-land, for instance, probably would not qualify as such in sizzling southern Arizona.
What is the heat index?
The heat index describes how hot it really feels, given relative humidity as well as air temperature. If the air temperature is 96°F and the relative humidity is 65 per-cent, the heat index is an oppressive 121°F (Figure 1) (National Weather Service 2012a).
Relative humidity is the amount of water vapor in the air at a certain temperature, compared with how much the air could hold at that temperature (National Weather Service 2009b). When humidity is very high, perspiration does not evaporate, and the human body gets little, if any, relief from the heat (Hajat, O’Connor, and Kosatsky 2010).
Weather 101
What is dew Point Temperature?
Dew point is a measure of atmospheric moisture: a higher dew point indicates that more moisture is present in the air. The dew point temperature is the level to which air must cool to become saturated with moisture, at which point it condenses on surfaces (National Weather Service 2009). Dew point tempera-ture is familiar to anyone who has seen temperatempera-tures fall overnight to the point where dew forms on leaves and car windows.
What is an air Mass?
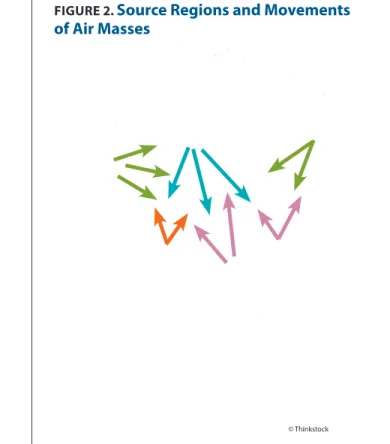
An air mass is a large volume of air—usually hundreds to thousands of miles across—with similar tempera-ture and humidity levels throughout. Air masses tend to take on the characteristics of the areas where they form. However, their properties can change as they move across areas with different surface condi-tions (Figure 2, p. 8) (National Weather Service 2010; Ritter 2010).
For example, a moist tropical air mass is hotter and more humid in the southeastern United States, nearer its source region, than it is in the northeastern United States (see box, p. 8). A moist tropical air mass is simi-larly warmer at all locations in July than it is in January (Sheridan 2002). This report focuses on air masses typ-ically associated with Midwest summer heat waves.
The heat index describes how hot it really feels,
given relative humidity and temperature. When humidity
is very high, perspiration does not evaporate and
the body gets little relief from the heat.
© Jupit
erI
The heat index describes how hot it feels, given relative humidity as well as air temperature. When humidity is very high, perspiration does not evaporate, and the human body gets little, if any, relief from the heat. Hot air masses have become hotter and more humid during nighttime hours over the last six decades in the Midwest—a recipe for a rising heat index.
figUrE 1. The heat index
Air t emper atur e (°F) Relative humidity (%) °F 40 45 50 55 60 65 70 75 80 85 90 95 100 110 136 108 130 137 106 124 130 137 104 119 124 131 137 102 114 119 124 130 137 100 109 114 118 124 129 136 98 105 109 113 117 123 126 131 96 101 104 108 112 116 121 126 132 94 97 100 102 106 108 114 119 124 129 136 92 94 96 99 101 105 108 112 116 121 126 131 90 91 93 95 97 100 103 105 109 113 117 122 127 132 88 88 89 91 93 95 98 100 103 106 110 113 117 121 86 85 87 88 89 91 93 95 97 100 102 105 108 112 84 83 84 85 86 88 89 90 92 94 96 98 100 103 82 81 82 83 84 84 85 86 88 89 90 91 93 95 80 80 80 81 81 82 82 83 84 84 85 86 86 87 The infamous Chicago heat wave of July 1995, which blanketed the city in swelter-ing smog, led to more than 700 deaths and 1,072 hospital admissions. Scientists project that such lethal heat waves will become more common unless we take strong immediate steps to reduce our global warming emissions. © G ar y Br aasch
dry Polar
This type of air mass, with cold and dry air, usually maintains the lowest temperatures and humidity along with clear skies. Dry polar air masses usually advance into the Midwest from northern regions such as Canada, on a north, northwest, or northeast wind.
dry Moderate
This type of air mass usually has milder temperatures than dry polar yet is still dry (low humidity). Dry moderate air can occur when another type of air mass traverses dry land.
Types of Air Masses
dry Tropical
This type of air mass is associated with the hottest yet very dry conditions, with very clear skies. It is common in large continental areas lacking water bodies. Dry tropical air masses can advance into the Midwest from desert regions in the U.S. Southwest and Mexico, or beneath high-pressure weather systems. Of all the types of air masses cited here, dry tropical days occur least frequently in the Midwest.
Moist Polar
Typical conditions are cloudy, humid, and cool, some-times with light precipitation. Moist polar air is present when an air mass has recently moved in from a cool ocean or large lake. In the Midwest, dry polar air flowing over the Great Lakes can pick up moisture and turn into a moist polar air mass.
Moist Moderate
This type of air mass is considerably warmer and more humid than moist polar. Conditions tend to be cloudy and overcast, with light precipitation. It can occur when warm air meets cool air just north of a warm front, creating moderate conditions.
Moist Tropical
This is the warmest and most humid type of air mass, and thus creates the most discomfort. In the Midwest, it is commonly transported from the tropical Atlantic and the Gulf of Mexico, or occurs after a warm front passes.
Moist Tropical+
The most oppressive subset of moist tropical air, this air mass is most often associated with heat-related mortality. It is present when both morning and after-noon temperatures are above the mean on a moist tropical day.
An air mass is a vast body of air overhead that defines the weather around us. It can extend for hundreds or thousands of miles, and has similar temperature and humidity properties throughout. The arrows indicate common movements of air masses from their source regions. The moist tropical (MT) and dry tropical (DT) air masses are most associated with increased health risks.
MP
dP
MP
dT
MT
MT
figUrE 2. Source regions and Movements
of air Masses
How We Analyzed Summer Weather
Trends in the Midwest
Much can change in 60 years, including weather. We analyzed some 60 years of data on summer weather in five large midwestern cities: Chicago, Cincinnati, Detroit, Minneapolis, and St. Louis. We found that the types of hot weather that undermine human health (dry tropical and moist tropical+) have become more common, on average. Meanwhile cool, dry summer days (dry polar), which often bring refreshing relief from summer heat, are becoming less common.
T
o uNDersTaND ChaNGes IN weather patterns and what might be driving those changes, we focused on weather sys-tems known as air masses (see “weather 101”). By evaluating air masses instead of simply temperatures, we were able to provide a more detailed picture of the changes in weather patterns that have actually been experienced by midwesterners over the last 60 years.we analyzed some 60 years of data on air masses in five large midwestern cities: Chicago, Cincinnati, Detroit, minneapolis, and st. Louis. we chose those cities to represent both the northern and southern midwest, and to reflect proximity to the Great Lakes as well as more continental locations.
we also analyzed information on air masses in five small cities within 150 miles of the larger cities, to determine whether urban heat island effects were play-ing a significant role in any temperature trends. These smaller cities included Peoria, IL (paired with Chicago), Lexington, KY (Cincinnati), Toledo, oh (Detroit), rochester, mN (minneapolis), and Columbia, mo (st. Louis).3 Because air masses cover hundreds or even
thousands of square miles, each smaller locale has weather similar to that of its larger counterpart.4
we obtained this information from the National Climatic Data Center, whose complete digital records begin at different years for different cities: 1948 for Chicago, 1948 for Cincinnati, 1959 for Detroit, 1945 for minneapolis, and 1946 for st. Louis. we analyzed these records through 2011. Incorporating all the vari-ables, we used a well-known weather model, the spatial synoptic classification or ssC, to classify each day’s weather into one of six types of air masses (Greene et al. 2011; sheridan and Dolney 2003; sheridan 2002).6
we then focused our analysis on three types of air masses: very hot and humid (an extreme subset of moist tropical known as moist tropical+), hot and dry (dry tropical), and cool and dry (dry polar). The dry tropi-cal and moist tropitropi-cal+ air masses are most important for human health, as they are linked to a greater risk
Dry tropical (hot and dry)
and moist tropical+ (very hot
and humid) air masses
are linked to a greater risk
of heat-related deaths.
with our focus on extreme heat, we limited our study period to June, July, and august. we analyzed data on afternoon and nighttime air and dew point temperatures, air pressure, cloud cover, and wind velocity obtained and recorded at one airport weather station per city.5 Temperatures were used as a proxy for
short-term daytime and nighttime exposure.
© En vir onmen tal P rot ec tion A genc y/John H. W hit e
Urban centers tend to be hotter than surrounding areas. Heat absorption by paved surfaces, a lack of cooling vegetation, and intense heat-emitting activities, such as transportation and industrial processes, combine to produce the urban heat island effect.
To determine whether heat trends simply reflected urban heat island effects, we collected data on five small cities at least 10 miles from the five larger cities. Although there were some differences between large and small cities, several common patterns emerged, suggesting a contribution from regional climate change, not simply urban heat island effects.
of heat-related deaths (National weather service 2005; ebi et al. 2004; sheridan and Kalkstein 2004). The frequency of a given type of air mass—the num-ber of days that it is present—varies in each city from year to year. examining the 60-year record allowed us to assess trends over time.
we also wanted to determine if stretches of danger-ously hot days have become more or less common. research has shown that a run of several days of oppressive heat affects human health (Kalkstein et al. 2011). studies have also linked at least three consecu-tive days of elevated temperature and humidity to greater mortality (Basu and samet 2002).
To evaluate the most dangerous heat waves, we investigated whether three-day-or-longer runs of very
hot, humid (moist tropical+) and hot, dry (dry tropical) air masses have become more common.7
(we did not analyze three-day-or-longer heat waves for the smaller cities because of time and resource constraints.)
finally, we investigated whether each type of air mass has become warmer or more humid, as repre-sented by dew point temperature, in each city, to gain a sense of trends in relative humidity. specifically, we looked at the 3:00 a.m. and 3:00 p.m. air temperature and dew point temperature (representing nighttime and daytime values) for each type of air mass during each summer day on record.
accounting for Urban heat island Effects
In rural areas, trees and other vegetation provide shade and help cool the air as plants release water vapor. In urban areas, cooling vegetation is often in short sup-ply. Tall buildings, roads, and other paved surfaces in cities also absorb and retain more heat than do the flat open spaces and plant life of more rural locales, and cities release that trapped heat more slowly throughout the night (environmental Protection agency 2012a). a city’s buzzing human activities—such as trans-portation, industrial processes, and the operation of numerous home appliances—emit heat (environmen-tal Protection agency 2012b). urban architecture can also influence wind flow and energy absorption. The difference in nighttime temperatures between a large city and its surroundings can therefore be as much as 21.6°f (oke 1988).
we paired each larger city with a nearby smaller city to help distinguish between urban heat island effects and other causes of trends in temperature and humidity.
© R asidel Slik a © T hinkst ock
we reasoned that if a large city showed a warming trend that was not apparent in the smaller city, that trend was likely largely due to urban heat island effects. If both the large and the small city recorded a similar warming trend, it was likely not due primarily to those effects.8
Evaluating daytime and Nighttime Trends
many studies that investigate how humans respond to weather use data from just one time during the day (anderson and Bell 2009; Davis et al. 2003b). however, urban heat island effects are strongest at night (mcCarthy et al. 2010; oke 1988). and high overnight temperatures are associated with heat-related illness and death (o’Neill and ebi 2009; Poumadere et al. 2005).
we therefore looked at air temperature and dew point temperature at 3:00 a.m. and 3:00 p.m. for each type of air mass. other u.s. scientists have also used that
i
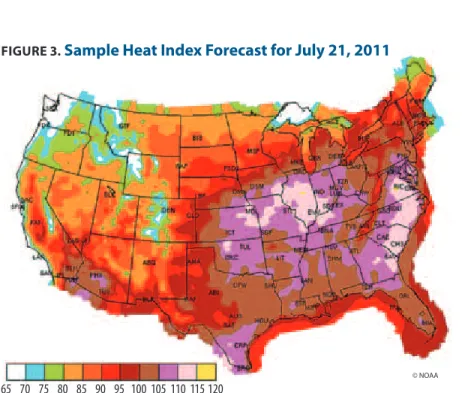
n the summer of 2011, the United States was hit hard with the kind of stifling heat wave that a changing climate can bring (Figure 3).• Forty-two states reported above-average summer temperatures, and four states broke records for high temperatures (National Climatic Data Center 2011). • Heat and drought across the
Southwest and the southern plains caused 95 deaths and some $12 billion in losses to crops and livestock (National Climatic Data Center 2012). • During a heat wave in July, the
National Weather Service issued heat advisories and warnings affecting some 140 million Americans and nearly 1 million square miles, from the central United States to the East Coast (National Climatic Data Center 2011).
Spotlight on 2011
The summer of 2011 brought record-breaking heat to much of the country. On this day in July, the heat index forecast topped 105°F for much of the Midwest. In the cities we investigated, potentially dangerous hot summer days have become more common over the past six decades, on average.
figUrE 3. Sample heat index forecast for July 21, 2011
approach to evaluate links between these temperatures and mortality (Davis et al. 2003a; Curriero et al. 2002). scientists have also used that approach to study links between heat and health in Korea, Italy, Canada, and China (Baccini et al. 2011; Lee et al. 2010; Tan et al. 2004; sheridan and Kalkstein 2004). for example, one study used temperature measurements at 5:00 a.m. and 5:00 p.m. to analyze the relationship between extreme heat and ambulance response calls in Toronto (Dolney and sheridan 2006).
We included temperature
data collected at 3:00 a.m.
because high overnight
temperatures are associated with
heat-related illness and death.
65 70 75 80 85 90 95 100 105 110 115 120
Findings: The Midwest Is Heating Up
o
ur INVesTIGaTIoN uNCoVereDmeasurable increases in dangerously hot weather in the midwest. People living in the region have experienced these weather changes during their lifetimes.
specifically, we found that the air masses associated with harmful health effects—dry tropical and moist tropical+—have become more common in the mid-west over the last six decades, on average. hot summer air masses lasting three days or longer have also become more common, on average. meanwhile cool, dry sum-mer days (dry polar) have become less common. The characteristics of these types of weather have also changed. with some exceptions, hot summer air masses have become both hotter and more humid, particularly at night. overnight temperatures under both types of hot air masses—especially hot, dry air— have risen in many cities. for example, when a dry tropical air mass is present in st. Louis, temperatures at 3:00 a.m. are 4.4°f higher today than 66 years ago. Dew point temperatures and sometimes relative humidity have also increased significantly in most of the cities. The overnight heat index has also shown evi-dence of increase.
we found some differences between large and small cities, but several common patterns emerged (see below). This strongly suggests that the changes we uncovered stem from regional climate change, not simply urban heat island effects.
Changes in Summer Weather Patterns Very Hot, Humid Days Are Occurring More Often
findings for Large Cities
Very hot, humid air masses (moist tropical+) appear to be much more common today than in the 1940s. Cin-cinnati, Detroit, and st. Louis saw significant increases in the number of moist tropical+ days each summer, even though these extreme air masses remain uncom-mon. for example, st. Louis now has twice as many very hot, humid days (moist tropical+) as it did in the late 1940s, on average.
findings for Small Cities
The number of days each summer of very hot, humid (moist tropical+) weather systems rose in all five small cities. These increases were statistically significant in three cities: Lexington, Peoria, and Toledo. In Lexing-ton, for example, the number of moist tropical+ days more than doubled, from about two during a typical summer at the beginning of the study period to about five each summer in the most recent decade.
Very Hot, Dry Days Are Also Becoming More Common
findings for Large Cities
Changes in the number of days with hot, dry (dry tropical) air masses were somewhat less consistent across the five large cities. Dry tropical days became more common in Chicago, Detroit, and minneapolis, but this increase was statistically significant only in Detroit. In st. Louis, the frequency of dry tropical days changed little, while Cincinnati experienced a slight drop.
findings for Small Cities
The number of days with hot, dry weather systems (dry tropical) showed some increases in the small cities, but the trend was not uniform or statistically significant. In fact, the frequency of dry tropical air masses in roch-ester actually declined at a significant rate. however, overall trends suggest a shift from drier to more humid air masses in the smaller cities—similar to what we found in the large cities.
Heat Waves Are Occurring More Often
Three-day-or-longer stretches of hot air masses are also occurring much more often. st. Louis, for example, recorded an average of three three-day-or-longer runs of moist tropical+ and dry tropical air masses annu- ally in the 1940s. That number has since more than doubled, to an average of seven such heat waves each year today.
o
ur analysis allows us to see changes in each variable over time, giving us a trend line, or slope. In our study, the y-axis represents either the number of days each summer that an air mass occurs, or the temperature within that type of air mass. The x-axis represents time, in years. The slope of the line can tell us how much the number of days or temperature is changing over time. By multiplying the slope by the total number of years, we end up with a value that signifies the change for the entire period.A common statistical measure known as the p-value indicates whether a trend is statistically significant. A p-value of less than 0.05 is usually considered statistically significant. Such a p-value indicates that there is less than a 5 percent likelihood that a trend is due to chance—and therefore that there is a 95 percent likelihood that the trend reflects the factor we are investigating (Ambaum 2010). Trends with p-values from 0.05 to 0.1 are not considered statistically significant. However, such p-values indicate that there is less than a 10 percent chance that a reported trend is random, so we consider such trends important.
Figure 4 depicts an example from our findings: the number of days each summer that a moist tropical+ air mass was present over St. Louis from 1946 to 2011. The strong positive slope indicates an overall increase in the number of such days—about 10 over the study period. With a p-value of 0.000 (less than 0.05), this increase is statistically significant.9 The full results for all 10 cities can be found in
the online technical appendix.
A Closer Look at Our Trend Analysis
p=0.000
figUrE 4. frequency of Moist Tropical+ air Masses in St. Louis from 1946 to 2011
0 5 10 15 20 25 30 Air mass fr equenc y (da ys per summer) 1946 1956 1966 1976 1986 1996 2006 Year
St. Louis experienced an average of three annual
three-day-or-longer runs of dangerously hot air masses
in the 1940s. That number has more than doubled,
to an average of seven such heat waves today.
© iSt ock phot o.c om/K ubr ak78
Our investigation uncovered
measurable increases in dangerously
hot weather in the Midwest.
People living in the region have
experienced these weather changes
during their lifetimes.
The Number of Cool Summer Days Is Declining
findings for Large Cities
The incidence of cool, dry summer (dry polar) air mass-es fell over time in all five large citimass-es. and in every city except Cincinnati, that decrease was statistically significant. In Chicago, for instance, the number of dry polar days each year dropped by one day every decade, for a 40 percent overall drop in the number of such days annually from 1948 to today. and the yearly frequency of dry polar days in Detroit dropped more than two each decade, so the city now averages 10.5 fewer cool, dry days each summer than in 1959. with
Cool, dry summer air masses have become less frequent in both small and large cities in the Midwest. In Toledo, home of the Mud Hens, a Detroit Tigers farm team, the number of days with such weather declined from about 12 per typical summer in the 1940s and 1950s to about three in 2010. These cooler days used to be a welcome and refreshing respite from summer heat.
fewer cool summer days on the calendar, residents experience less relief from hot weather.
findings for Small Cities
Cool, dry summer (dry polar) air masses became less common in all the small cities except rochester. In Toledo, the number of dry polar days declined from about 12 per typical summer in the 1940s and 1950s to about three in 2010.
Changes in overnight Temperature, humidity, and heat index
Overnight Temperatures Are Rising
findings for Large Cities
overnight (3:00 a.m.) temperatures showed much stron-ger trends than afternoon (3:00 p.m.) temperatures. In most large cities, afternoon temperatures associated with a given type of air mass did not rise much over time, and some cooled slightly. overnight tempera-tures, in contrast, increased notably.
In Detroit and st. Louis, dry polar, dry tropical, and moist tropical+ air masses all warmed, and these in-creases were statistically significant. In four of the five cities, the already very hot and humid moist tropical+
© C
or
ey S
air mass became significantly warmer. The only excep-tion occurred in Cincinnati, where, for reasons that are unclear, temperatures of all these air masses changed little, in both the afternoon and overnight.
some cities saw marked trends in overnight tem-peratures. for example, in Detroit, average overnight temperatures on hot, dry (dry tropical) days warmed 4.3°f over a 52-year period. and Detroit was not an isolated example. In st. Louis, average overnight dry tropical temperatures rose about 4.4°f.
overnight increases for moist tropical+ air were somewhat smaller but still notable, given that this type of weather already has the warmest overnight tempera-tures. each city except Cincinnati showed statistically significant increases in moist tropical+ overnight tem-peratures: 1.7°f in Chicago, 2.1°f in Detroit, 1.6°f in minneapolis, and 2.1°f in st. Louis.
what’s more, differences between daytime and nighttime temperatures appear to be narrowing in most cities. This trend may be important in understanding the impact of high heat on human health, both now and in the future, as a lack of nighttime heat relief has been linked to increases in heat-related illness (o’Neill and ebi 2009; Poumadere et al. 2005).
findings for Small Cities
as in the larger cities, nighttime air masses in the small cities have generally become hotter over time. overall, very hot and humid (moist tropical+), hot and dry (dry tropical), and cool and dry (dry polar) air masses in the small cities warmed notably in the nighttime, but not in the afternoon.
In Columbia, overnight temperatures rose for the cooler dry polar and the hotter dry tropical air masses. In Lexington, Peoria, and Toledo, overnight tempera-tures increased for all three air masses. some of these increases were sizable. In Columbia, where the air- port is in an agricultural region well outside the city, average overnight temperatures during dry tropical weather rose 3.7°f over 66 years.
Nighttime Dew Point Temperatures Are Rising
findings for Large Cities
overnight dew point temperatures for hot air masses tended to increase over time. for example, Detroit and minneapolis both saw an increase in overnight dew point temperatures for moist tropical+ air masses. In st. Louis, overnight dew point temperatures for dry tropical weather rose by more than 7°f. That change contributed to a notable rise in overnight relative humidity during such weather, from 63 to 71 percent on average.
as with temperature trends, afternoon dew point temperatures did not change significantly over time. The exceptions were an increase in the dew point temperature for dry tropical weather in st. Louis, and a decrease in the dew point temperature for dry tropical weather in Detroit.
If the moisture content of dry tropical air masses increases, some may cross the threshold into the moist tropical category. This can occur if warmer air, which can hold more water vapor, becomes more common.10
If dry tropical air masses are becoming moister, as rising dew point temperatures suggest, then moist tropical+ days should become more common, at the expense of dry tropical days. That may explain why the frequency of moist tropical+ air masses is rising more rapidly than that of other types of air masses, and why dry tropical air masses are becoming slightly less common.
findings for Small Cities
as in large cities, the moisture content of nighttime air masses in small cities has generally increased since the 1940s and 1950s. In Toledo, overnight dew point tem-peratures of dry tropical air masses rose about 5°f over a roughly 55-year period, while overnight air tempera-tures rose by about 3.8°f. These changes correspond to an increase in overnight relative humidity of 3.5 per-cent in these typically dry air masses.
Very hot, humid weather increases the risk of hyperthermia— elevated body temperature—which can result in disability or death. When humidity is very high, body sweat does not evaporate, and people obtain little or no relief from the heat. In St. Louis, for example (shown above at the city’s Gateway bus and train station), overnight relative humidity under dry tropical air masses rose from 63 percent to 71 percent from 1946 to today, reducing nighttime relief from extreme heat.
© R
ebec
The Heat Index Also Rises
Temperature and relative humidity both affect the heat index, a measure of how hot the air actually feels. To investigate this measure, we evaluated changes in the overnight heat indices of Chicago and st. Louis on very hot, humid (moist tropical+) and hot, dry (dry tropical) days.
In Chicago, the average heat index rose 2.6°f on moist tropical+ days, and 0.1°f on dry tropical days. In st. Louis, the average heat index rose 3.8°f on moist tropical+ days, and 4.4°f on dry tropical days. These sizable increases could affect people’s health. In st. Louis, the mean overnight heat index averages near 80°f for both types of hot air masses, affording little heat relief. scientists have linked both high night-time temperatures and high relative humidity to in-creases in heat-related illness and death (o’Neill and ebi 2009; Poumadere et al. 2005).
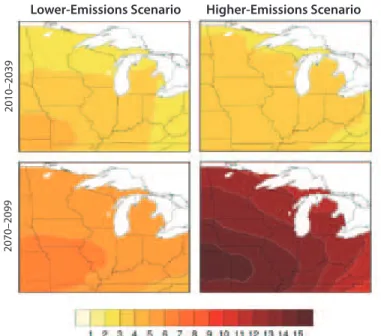
What the future Could Bring
If global warming emissions continue at their current pace, the midwest could face even hotter summers.11
an earlier uCs report projected how many days with temperatures above 90°f and 100°f the cities in our study could face under this scenario (uCs 2009a). for example, Chicago could see more than 70 days with temperatures above 90°f each year toward the end of
this century, on average (figure 5). under a lower-emissions scenario, and therefore more modest global and regional warming, the number of such days would drop by half.
scientists also expect the number of dangerously hot days over 100°f in Chicago to increase dramatically under the higher-emissions scenario, producing a month of such days. They also project average summer temperatures to rise more than 3°f over the next sev-eral decades, and by an extraordinary 13°f toward the end of the century. under a lower-emissions scenario, that increase would drop by half.
all the cities in our study can expect to see the num-ber of hot days each year rise over the coming century. for example, st. Louis will face more than 100 days each year above 90°f by the end of the century under a higher-emissions scenario, according to the uCs report. This number drops to slightly more than 60 days under a lower-emissions scenario—highlighting the importance of the choices we make.
other measures of dangerous heat suggest a simi- lar future for the midwest. for example, heat waves similar to that in europe in 2003, which claimed thousands of lives, could occur every other year in the midwest by the end of century under a higher-emissions scenario (usGCrP 2009).12
A previous UCS analysis considered two possible futures: one with fewer heat-trapping emissions, and one with more. Under a high-emissions scenario, midwestern cities such as Chicago will face many more summer days above 90°F. The number of such days is also projected to rise across the region under a lower-emissions scenario, but less markedly (Union of Concerned Scientists 2009a).
figUrE 5. a future with More days above 90°f
80 70 60 50 40 30 20 10 0 2010–2039 2040–2069 2070–2099 1961–1990 Da ys per y ear o ver 90˚F Days over 100˚F 1961–1990 2070–2099 <2 8 30 Chicago
Lower-Emissions Scenario Higher-Emissions Scenario
The Impact of Dangerous Summer
Weather on Health
Heat poses more risk for the elderly and the immobile, especially if they already have diabetes, respiratory disease, kidney disease, or heart disease. Many elderly people try to endure heat waves in unsafe conditions without fully understanding their dangers. As the U.S. population ages, heat-related illnesses and deaths are expected to become more prevalent. Extreme heat also poses a particular danger to athletes and outdoor workers, who may disregard warnings about heat-related illness.
h
IGh TemPeraTures aND hu-midity levels pose serious threats to public health. Very hot, humid weather increases the risk of hyperthermia—elevated body temperature—and hot, dry weather raises the risk of dehydration (Vanos et al. 2010; epstein and moran 2006; mairiaux, malchaire, and Candas 1987). The impact of heat on people’s well-being depends on their exposure to high temperatures or prolonged periods of intense heat, their underlying health, and their eco-nomic and social vulnerability, as well as how much their region has invested in measures to help residents cope with heat.some groups are especially vulnerable to the dangers of hot weather. heat is a particular hazard for people who are physically active, including both indoor work-ers with minimal access to cooling systems and outdoor workers (hanna et al. 2011). People who play outdoor sports are also at risk when the temperature climbs.
heat stress is much more likely to occur in motivated and elite athletes who disregard heat warnings to train and compete (Vanos et al. 2012).
The elderly are also at greater risk of heat-related health complications (Basu, Dominici, and samet 2005; Diaz et al. 2002). older individuals are at higher risk partly because extreme heat can aggravate existing medical conditions such as diabetes, respiratory disease, kidney disease, and heart disease (mastrangelo et al. 2007; semenza et al. 1999).
The share of u.s. residents over age 65 is climbing, from roughly 13 percent today to a predicted 20 per-cent by 2030. as the population ages, we can expect more heat-related illnesses and even deaths (o’Neill and ebi 2009). one study of mortality from heat waves in st. Louis from the 1930s through the 1960s found that people aged 40 to 80 had the greatest risk of dying in a 1936 heat wave. During a 1966 heat wave,
© iStockphoto.com/agentry © iStockphoto.com/Ridofranz
City-by-City
Results
Chicago, iL 1948–2011 (63 years) detroit, Mi 1959–2011 (52 years) Minneapolis, MN 1945–2011 (66 years) St. Louis, Mo 1946–2011 (65 years) Cincinnati, oh 1948–2011 (63 years) da i Ly S U M M E r W E aT h E r T r E N d S Very hot, humid days and hot, dry days are both dangerous to human health, while cool, dry daysbring relief from the summer heat and humidity.
Very Hot, Humid Days Hot, Dry Days Cool, Dry Days N i g h T T i M E S U M M E r W E aT h E r T r E N d S High nighttime temperatures and high relative humidity
bring no relief from the heat, putting people at risk for heat-related illness and death.
Temperature and Humidity Changes in Very Hot, Humid Nights Temperature Dew Point
In this chart we identified statistically significant values at *p<0.05 and ^p<0.10. Note that for some cities, proper statistical tests could not be performed on dry tropical air masses because the frequencies were too low.
increased 62% 2.5 Days increased 79% 1.5 Days decreased* 44% 7+ Days increased^ 172% 3.5 Days increased^ 338% 3 Days decreased* 70% 10.5 Days increased 55% 1.5 Days increased 45% 3 Days decreased^ 32% 4.5 Days increased* 200% 10 Days decreased* 43% 4 Days increased^ 208% 2 Days decreased 45% 2 Days decreased 26% 2 Days increased^ 1.7°f increased0.8°f increased* 2.1°f increased*2.5°f increased^ 1.6°f increased*2.2°f increased* 2.1°f increased0.6°f increased 0.2°f decreased0.7°f n + 45–99% n +100–199% n + ≥ 200% n decrease n + < 1°f n + 1°–2.9°f n + > 3°f n – 45–99% in Cool days No Change n – < 1°f n – 1°–2.9°f
Photos: (Chicago) © iStockphoto.com/Veni; (Detroit) © iStockphoto.com/DenisTangneyJr; (Minneapolis) © iStockphoto.com/Davel5957; (St. Louis) © iStockphoto.com/Kubrak78; (Cincinnati) © iStockphoto.com/Davel5957
N i g h T T i M E S U M M E r W E aT h E r T r E N d S High nighttime temperatures and high relative humidity
bring no relief from the heat, putting people at risk for heat-related illness and death.
Temperature and Humidity Changes in Hot, Dry Nights
T h r E E - day h E aT WaV E T r E N d S Three consecutive days of high heat and humidity can increase heat-related illness and death.
Average Increase in Heat Waves Harmful to Human Health Temperature Dew Point
increased 2.6°f increased2.8°f increased* 4.3°f increased1°f decreased 0.8°f decreased1.4°f increased* 4.4°f increased*7.7°f increased 0.6°f decreased1.1°f increased 1 per year increased 2 per year increased 1 per year increased* 4 per year n + < 1°f n + 1°–2.9°f n + > 3°f W h aT T h E f U T U r E M i g h T Lo o K L i K E
Assuming current carbon emissions trends continue (equivalent to the higher-emissions scenario), the Midwest will
likely face scorching summer days with temperatures that soar above 90°F—and even 100°F—late in this century. If carbon emissions are significantly curtailed (lower-emissions
scenario), far fewer summer days will be extremely hot.
The data for this section were compiled from other sources. This report’s original research does not include projections of potential future climate changes.
n ≥ 1
n – < 1°f n – 1°–2.9°f
Source: UCS 2009a-e.
n Current n Lower-Emissions Scenario n higher-Emissions Scenario
80 70 60 50 40 30 20 10 0 1961–1990 2010–2039 2040–2069 2070–2099 Da ys per y ear o
ver 90˚F Days over 100˚F
1961–1990 2070–2099 <2 8 30 Chicago Da ys per y ear o ver 90˚F 70 60 50 40 30 20 10 0 2010–2039 2040–2069 2070–2099 1961–1990 Days over 100˚F 1961–1990 2070–2099 <1 5 23 Detroit 80 70 60 50 40 30 20 10 0 1961–1990 2010–2039 2040–2069 2070–2099 Da ys per y ear o
ver 90˚F Days over 100˚F 1961–1990 2070–2099 <2 7 28 Minneapolis-St. Paul 2010–2039 2040–2069 2070–2099 1961–1990 Da ys per y ear o ver 90˚F Days over 100˚F 1961–1990 2070–2099 <3 11 43 St. Louis 120 100 80 60 40 20 0 90 80 70 60 50 40 30 20 10 0 1961–1990 2010–2039 2040–2069 2070–2099 Days over 100˚F 1961–1990 2070–2099 < 2 8 29 Cincinnati Da ys per y ear o ver 90˚F No Change
however, the majority of heat-related deaths occurred among people aged 60 to 90, likely reflecting the in-crease in life expectancy over the decades (Basu and samet 2002; Bridger, ellis, and Taylor 1976). urban residents are particularly vulnerable to the effects of heat, thanks to urban heat island effects, and low-income urban residents may be even more susceptible to stress from hot-weather events. People of lower socioeconomic status and members of minor-ity groups are more likely to live in neighborhoods with high population density, little open space, and sparse
vegetation (Basu and samet 2002; Buechley, Van Bruggen, and Truppi 1972). Those conditions combine to make urban neighborhoods even warmer than their surroundings (harlan et al. 2006). People of lower socioeconomic status are also less likely to own air con-ditioners, or may not use them because of the cost of electricity, increasing their risk of heat-related death (Curriero et al. 2002).
according to the united Nations, some 85 percent of americans will live in urban areas by 2020, and the urban population will climb to 90 percent by 2050 (united Nations 2011). This trend toward city living will only add to the health effects of heat waves (shah-mohamadi et al. 2011; hobbs and Damon 1996). still, city dwellers are not the only people at risk from dangerously hot weather. heat waves are projected to become more common in both towns and cities across the nation—particularly in the Northeast and midwest (o’Neill and ebi 2009).
Quantifying the health Effects of Extreme heat
In the public health community, epidemiologists study the cause of disease (in this case, heat-related illness and death) by designing studies that can assess the relationship between an exposure metric (e.g., ambi-ent temperature, heat wave) and a specific outcome (e.g., heat-related hospitalizations, emergency room visits, deaths). as discussed later, heat can be associated with elevated mortality from a variety of causes, so health studies often evaluate “all-cause” or “cause- specific” (e.g., cardiovascular) mortality in addition to causes specific to heat exposure.
The hundreds of studies examining heat-related health concerns do not use a standard metric for expo-sure to high temperature, nor do analysts regard one metric as better than another (Barnett, Tong, and Low-income urban residents and members of minority groups are more likely
to live in neighborhoods with high population density, little open space, and sparse vegetation—conditions that can make neighborhoods even warmer. These problems are compounded when residents cannot afford air condition-ing, increasing their risk of heat-related illness and death.
2020–2029 2045–2055 2090–2099 Chicago 143 185 300 Cincinnati 19 23 31 detroit 255 291 701 Minneapolis 119 112 142 St. Louis 67 109 189
Source: Greene et al. 2011.
Higher summer temperatures and heat waves are projected to increase as our climate warms. One recent study projected a notable rise in heat-related deaths across the Midwest over the course of the twenty-first century under a higher-emissions scenario (A1FI), as indicated above.
Projected deaths Each year from Extreme Summertime heat
© Er
in Neker
vis
Clements 2010). however, researchers often use air temperature and relative humidity level, or dew point temperature, as an indicator of heat stress (Basu and samet 2002).
Heat-Related Mortality
evaluating heat-related mortality is challenging. The ad hoc Committee of the National association of medical examiners recommends attributing a death to heatstroke or hyperthermia if body temperature was at least 105°f at the time of death, or the deceased per-son showed changes in mental status and had elevated levels of liver and muscle enzymes (Donoghue et al. 1997). however, despite this recommendation, examiners often report cardiovascular, respiratory, and cerebro-vascular diseases as the underlying cause of death even when heat was an important contributing factor (Basu and samet 2002). as much as a three-day lag between heat events and deaths may also occur, further com-plicating classification of death (martin et al. 2011; anderson and Bell 2009; Basu and samet 2002). If our current rate of heat-trapping emissions con-tinues, the Centers for Disease Control (CDC) predicts that annual heat-related deaths will reach 3,000 to 5,000 by 2050 (CDC 2009). (Note: The CDC bases
these projections on the A1FI scenario for heat-trapping emissions of the Intergovernmental Panel on Climate Change.)
People in the northernmost cities, who are not as ac-climated to dramatic increases in air temperature, are more vulnerable to extreme heat (Curriero 2002). People living in areas that regularly see high summer-time temperatures, and those who live closer to the equator, are usually better able to withstand high heat (hajat and Kosatky 2010).
Heat-Related Illnesses
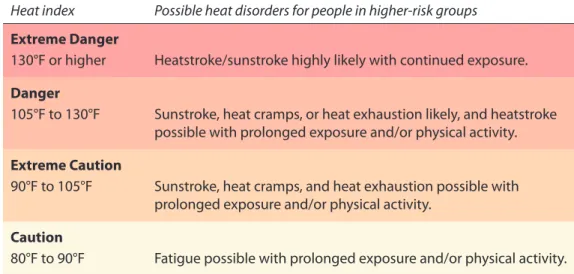
heat-related illnesses occur along a spectrum, from relatively minor heat rash to potentially deadly heat- stroke (figure 6). People suffer heat-related illness when the body’s normal temperature control system is un-able to effectively regulate its internal temperature (Bouchama and Knochel 2002).
heat cramps, heat exhaustion, and heatstroke are the conditions most likely to send people to the emer-gency room when temperatures rise. heat cramps occur when heavy sweating and water intake upset the body’s salt balance, causing cramping of the muscles in the legs, arms, and abdomen. heat exhaustion causes profuse sweating, nausea, and confusion, although it is milder than heatstroke, and is typically associated with a core body temperature of 98.6°f to 104°f. although these symptoms can be alarming, heat exhaustion is not necessarily life threatening unless it progresses (Glazer 2005).
heat exhaustion can sometimes progress to heat-stroke. more commonly, heatstroke comes on suddenly,
Heat index Possible heat disorders for people in higher-risk groups
Extreme danger
130°F or higher Heatstroke/sunstroke highly likely with continued exposure. danger
105°F to 130°F Sunstroke, heat cramps, or heat exhaustion likely, and heatstroke possible with prolonged exposure and/or physical activity. Extreme Caution
90°F to 105°F Sunstroke, heat cramps, and heat exhaustion possible with prolonged exposure and/or physical activity.
Caution
80°F to 90°F Fatigue possible with prolonged exposure and/or physical activity.
Source: National Weather Service, online at http://www.nws.noaa.gov/om/brochures/heat_wave.shtml.
figUrE 6. heat disorders
The heat index describes how hot it really feels, given relative humidity as well as air temperature. As the heat index rises, so does the risk of heat-related illness and death.
The share of U.S. residents over
age 65 is climbing, from roughly
13 percent today to a predicted
20 percent by 2030. As the
population ages, we can expect
more heat-related illnesses
and even deaths.
When the air temperature climbs above body temperature and humidity is high, the body’s cooling mechanisms become less effective. The resulting symptoms include those shown here.
Head
Symptoms of heat exhaustion can include headache, dizziness, irritability, fatigue, and loss of coordination. Hallmarks of heatstroke—a medical emergency—include marked changes in mental status, such as confusion, delirium, irritability, loss of conscious-ness, and seizures.
Mouth
Increased thirst, dry mouth, and other symptoms such as weakness and nausea often signal dehydration— a loss of water or salts because of heavy sweating or inadequate fluid intake. If left untreated, dehydration can lead to serious health effects.
Heart
Your heart has to work harder to keep your body from overheating when outside temperatures rise. Tachycardia (rapid heartbeat) can occur with heat exhaus-tion, and cardiac arrhythmias (abnormal or irregular heart rhythms) can occur with heat- stroke. Patients with a history of cardiovascular disease and high blood pressure are at greater risk of hospitalization during heat waves.
Lungs
Asthma, chronic obstructive pulmonary disease, and other respiratory diseases can worsen when temperatures spike. People with pneumonia and influenza are also at greater risk of hospital-ization during a heat wave.
Kidneys
Heatstroke can lead to kidney failure.
Liver
Heatstroke can injure the liver.
Arms and Legs Heat cramps can cause painful muscle spasms and cramping in the arms, shoulders, and legs.
Skin
Heat rash—also called prickly heat, or miliaria— occurs when sweat ducts become blocked. It is most common in babies, and in hot, humid environments. Flushed, pale, or clammy skin and profuse sweating can be signs of heat exhaustion.
Source: Becker and Steward 2011; Glazer 2005; Lugo-Amador, Rothenhaus, and Mouyer 2004; Semenza et al. 1999.
How Heat Affects Health
Illustr
ation: Amanda
W
ait & Annie Bissett/Nonpr
ofit
desig
n.c
without the warning signs of heat exhaustion. But no matter how it starts, heatstroke is an emergency. after prolonged exposure to extreme heat, the body can completely stop sweating. unable to cool itself through perspiration, the body’s core temperature can climb above 105°f. Blood pressure drops and pulse speeds up. without emergency treatment, this danger-ously elevated body temperature leads to enzyme mal-function, organ damage, and death (stonehill 1972). factors beyond the direct physical effects of high temperatures can increase the risk of heat-related illness. Nighttime temperatures are one such factor. when temperatures remain high into the night, people have no relief from hot daytime weather and are at greater risk for heat-related illness and death (o’Neill and ebi 2009; Poumadere et al. 2005).
ozone also increases the risk of heat-related health complications. ozone exacerbates lung diseases such as asthma, and can cause breathing difficulties even in healthy people (uCs 2011; Ito, De Leon, and Lippman 2005; Cody et al. 1992). ozone pollution is expected to rise along with temperatures over much of the united states (Jacob and winner 2009).
Climate Change and hot Weather
average u.s. temperatures have already increased by 2°f over the past 50 years as carbon dioxide and other heat-trapping emissions have accumulated in the atmosphere. and they are projected to rise another 7° to 11°f by the end of this century under a high-carbon-emissions scenario, and 4° to 6.5°f under a low-emissions scenario. These increases are likely to
affect weather, ecosystems, and public health markedly (Karl, melillo, and Peterson 2009).
each new decade since the 1970s has been hotter than the last, with 2000 to 2010 the hottest on record so far (arndt 2010; Nasa 2010). In the 1950s, record low temperatures were just as likely to occur as record highs. During the last 10 years, in contrast, the united states has experienced twice as many record highs as record lows. By 2050, scientists project that record highs will outnumber record lows by 20 to 1 (meehl et al. 2009).
measured and projected changes in temperature beyond these averages promise to affect public health more directly. Notably, average global nighttime tem-peratures have risen more rapidly than average daytime temperatures (Gershunov, Cayan, and Iacobellis 2009; alexander et al. 2006). That means dwellings cool more slowly during the night, and people get less relief from extreme heat.
heat waves, too, are becoming more common. over the past few decades, the number of extreme heat events has increased both in the united states and around the world (IPCC 2012; IPCC 2007). according to a u.s. government report, high-humidity heat waves have become both more frequent and more intense in the last 30 to 40 years (Karl, melillo, and Peterson 2009). In the years to come, an entirely new heat regime is likely to emerge in many parts of the world. In Chicago, for instance, events similar in magnitude to the deadly 1995 heat wave are projected to occur every other year, even if we reduce our carbon emis-sions (figures 7 and 8, p. 24). If we do not curb those
figUrE 7. Scorching
Summers Become the Norm
If our heat-trapping emissions continue to rise at current rates, summers in the Midwest are projected to become much hotter. Under a high-emissions (A1FI) scenario (right), average summer temperatures are projected to rise by more than 3ºF over the next several decades, and by an extraordinary 14ºF toward the end of this century. Under a lower-emissions (B1) scenario (left), that increase would be halved. (For more information, see www.ucsusa.org/mwclimate.)
2070–2099
2010–2039
°F above average summer temperature (1961–1990)
1961–1990 2010–2029 2040–2059 2080–2099 2040–2059 2080–2099 Higher-Emissions Scenario Historical Baseline Lower-Emissions Scenario Average for Both Higher- and Lower-Emissions Scenarios
emissions, such extreme events are likely to strike roughly three times each year (hayhoe et al. 2009). The midwest is not the only region at risk. In the Northeast, for example, if we continue on a path of high heat-trapping emissions, Boston is projected to face more than 60 days over 90°f each year by the end of the century, and more than 20 days over 100°f. and, if we continue with high carbon emissions, many southern states are expected to have twice as many days each year above 90°f by the end of this century as at the end of the twentieth century (Karl, melillo, and Peterson 2009).13
Climate change may already be affecting many aspects of weather, including temperature and precipi-tation, and causing increases in extreme weather-related events such as droughts and wildfires. some studies
have started to detect changes in heat extremes that are consistent with long-term climate change. Determin-ing the cause and effect of a specific instance of extreme weather remains an emerging area of research. Never-theless, scientists are pioneering ways to link specific heat waves—particularly those that break all-time records—to large-scale climate change.
scientists investigating the 2003 european heat wave, for instance, concluded with high confidence that climate change from human activities had doubled the risk of an extreme heat event of that magnitude (stott, stone, and allen 2004). similarly, after a heat wave around moscow in July 2010, researchers found that there was only a 20 percent chance that the heat wave would have occurred without climate change (rahmstorf and Coumou 2011).
figUrE 8. Southern Weather Comes to illinois
Source: UCS 2009a.
Scientists project that Illinois will face hotter temperatures and less summer rain under continued climate change. The red outlines show the kind of southern summers Illinois could see during this century under a higher-emissions (A1FI) scenario. Analysts expect the state to face hotter summers even under a lower-emissions (B1) scenario, as the yellow outlines illustrate.
Ozone pollution—which is expected to rise along
with temperatures over much of the United States—increases
the risk of heat-related health complications by exacerbating
lung diseases such as asthma and causing breathing
difficulties even in healthy people.
Building Resilient Communities
Building resilience in the face of extreme heat requires commitment and collaboration. For example, planners can reduce the urban heat island effect by expanding green spaces such as parks and rooftop gardens (Chicago, left). Officials can also develop heat-response plans that include educating and checking on residents and setting up cooling centers, such as at Detroit’s Farwell Recreation Center (center, during a 2010 heat wave). Residents can also take proactive steps, such as drinking plenty of water, spending at least a few hours a day in air conditioning, and avoiding strenuous activity.
a
LarGe BoDY of sCIeNTIfIC eVI-dence indicates that carbon emitted from human activities such as burning fossil fuels and cutting down forests is very likely rais-ing our planet’s temperature (IPCC 2007). as this study shows, hot summer days and heat waves have already become more common across the midwest. In that re-gion and beyond, communities must find ways to adapt to these dangerous weather conditions.while several major cities, including Chicago,have implemented climate action plans or emergency- response plans for extreme heat, the latter idea is still very new to most communities. a 2010 survey of 70 communities across the country found that just 30 had programs to prevent heat-related illness and death dur-ing heat waves (o’Neill et al. 2010).14 many of these
communities cited local leadership as driving these