Inferring Internet Denial-of-Service Activity
DAVID MOORE, COLLEEN SHANNON, DOUGLAS J. BROWN, GEOFFREY M. VOELKER, and STEFAN SAVAGE
University of California San Diego
In this article, we seek to address a simple question: “How prevalent are denial-of-service attacks in the Internet?” Our motivation is to quantitatively understand the nature of the current threat as well as to enable longer-term analyses of trends and recurring patterns of attacks. We present a new technique, called “backscatter analysis,” that provides a conservative estimate ofworldwide denial-of-service activity. We use this approach on 22 traces (each covering a week or more) gathered over three years from 2001 through 2004. Across this corpus we quantitatively assess the number, duration, and focus of attacks, and qualitatively characterize their behavior. In total, we observed over 68,000 attacks directed at over 34,000 distinct victim IP addresses—ranging from well-known e-commerce companies such as Amazon and Hotmail to small foreign ISPs and dial-up connections. We believe our technique is the first to provide quantitative estimates of Internet-wide denial-of-service activity and that this article describes the most comprehensive public measurements of such activity to date.
Categories and Subject Descriptors: C.2.3 [Computer-Communication Networks]: Network Operations—Network monitoring; C.2.0 [Computer-Communication Networks]: General— Security and protection; C.4 [Performance of Systems]—Measurement techniques
General Terms: Measurement, Security
Additional Key Words and Phrases: Backscatter, denial-of-service, network measurement, network security
1. INTRODUCTION
In February of 2000, a series of massive denial-of-service (DoS) attacks incapac-itated several high-visibility Internet e-commerce sites, including Yahoo, Ebay, and E*trade. Then, in January of 2001, Microsoft’s name server infrastructure was disabled by a similar assault, the root DNS servers were targeted in 2002,
An earlier version of this work appeared in the 2001 USENIX Security conference. This article extends the workload we analyze from three weeks to three years, further refines our methodology, and discusses trends over time. Support for this work was provided by NSF Trusted Computing Grant CCR-0311690, Cisco Systems University Research Program, DARPA FDN Contract N66001-1-8933, DARPA NGI Contract N66001-98-2-8922, NSF Grant NCR-9711092, NSF Grant ANI-0221172, NIST Grant 60NANB1D0118, AT&T, Asta Networks, and CAIDA members.
Authors’ address: Department of Computer Science and Engineering, University of California, San Diego, 9500 Gilman Drive, La Jolla, CA 92093-0404; email:{dmoore,cshannon}@caida.org;
{d2brown,voelker,savage}@cs.ucsd.edu.
Permission to make digital or hard copies of part or all of this work for personal or classroom use is granted without fee provided that copies are not made or distributed for profit or direct commercial advantage and that copies show this notice on the first page or initial screen of a display along with the full citation. Copyrights for components of this work owned by others than ACM must be honored. Abstracting with credit is permitted. To copy otherwise, to republish, to post on servers, to redistribute to lists, or to use any component of this work in other works requires prior specific permission and/or a fee. Permissions may be requested from Publications Dept., ACM, Inc., 1515 Broadway, New York, NY 10036 USA, fax:+1 (212) 869-0481, or permissions@acm.org.
C
and SCO’s corporate Web site was incapacitated in late 2003. Indeed, over the last six years, denial-of-service attacks against highly visible Internet sites or services have become commonplace. However, the vast majority of attacks are not publicized and include a wide range of global victims, from small com-mercial sites, to educational institutions, public chat servers and government organizations. Many of these attacks are undoubtedly motivated by mischief or spite, others are likely born out of religious, ethnic or political tensions, and still others have been clearly focused around commercial gains [Vijayan 2004; Poulsen 2004].
Unfortunately, while it is clear from these anecdotal reports that denial-of-service attacks continue to be a problem, there is little quantitative data about the prevalence of these attacks nor any representative characterization of their behavior. Worse, there are multiple obstacles hampering the collection of an au-thoritative denial-of-service traffic dataset. In particular, service providers and content providers consider such data sensitive and private. Moreover, even if it were allowed, monitoring traffic at enough sites to obtain a representative measure of Internet-wide attacks presents a significant logistical challenge. Consequently, the only contemporary public data we are aware of is an an-nual CSI/FBI survey study [Computer Security Institute and Federal Bureau of Investigation 2004].1
We believe that a strong quantitative foundation is necessary both for un-derstanding the nature of today’s threat and as a baseline for longer-term com-parison and analysis. Our article seeks to answer the simple question: “How prevalent are denial-of-service attacks in the Internet today?” As a means to this end, we describe a traffic monitoring technique called “backscatter analy-sis” for estimating theworldwideprevalence of denial-of-service attacks. Using backscatter analysis, we have established the presence of roughly 2,000–3,000 active denial-of-service attacks per week. Over a three-year period we have collected 22 distinct traces, revealing 68,700 attacks on over 34,700 distinct Internet hosts belonging to more than 5,300 distinct organizations. We are also able to estimate alower-boundon the intensity of such attacks—some of which are in excess of 100,000 packets-per-second (pps)—and characterize the nature of the sites victimized.
The remainder of this article is organized as follows: Section 2 describes the underlying mechanisms of denial-of-service attacks, Section 3 describes the backscatter technique, and limitations arising from its assumptions, and Sec-tion 4 explains our techniques for classifying attacks from monitored backscat-ter traffic. In Section 5 we describe our experimental platform and methodology, and present the results of our study. Finally, in Sections 6 and 7 we cover related work and summarize our findings.
2. BACKGROUND
Denial-of-service attacks consume the resources of a remote host or network that would otherwise be used to serve legitimate users. There are two principal
1The relevant result from this study is that 39 percent of surveyed security professionals reported experiencing denial-of-service attacks in 2004.
classes of attacks:logicattacks andresourceattacks. Attacks in the first class, such as the “Ping-of-Death,” exploit existing software flaws to cause remote servers to crash or substantially degrade in performance. Many of these at-tacks can be prevented by either upgrading faulty software or filtering par-ticular packet sequences, but they remain a serious and ongoing threat. The second class, resource attacks, overwhelm the victim’s CPU, memory, or net-work resources by sending large numbers of spurious requests. Because there is typically no simple way to distinguish the “good” requests from the “bad,” it can be extremely difficult to defend against resource attacks. For the purposes of this study we focus solely on this latter class of attacks.
2.1 Attack Types
There are two related consequences to a resource attack—the network load induced, and the impact on the victim’s CPU. To load the network, an at-tacker sends packets as rapidly as possible towards the victim—hoping to over-whelm the capacity of intervening network devices. Since many network de-vices are limited by packet processing before bandwidth, packets-per-second is frequently a better measure of network load during an attack.
An attacker often simultaneously attempts to load the victim’s CPU by requiring additional processing above and beyond that required to receive a packet. For example, the best known denial-of-service attack is the “SYN flood” [Computer Emergency Response Team 1996], which consists of a stream of TCP SYN packets directed to a listening TCP port at the victim. For each such SYN packet received, the host victim must search through existing connec-tions and if no match is found, allocate a new data structure for the connection. Moreover, the number of these data structures may be limited by the victim’s operating system. Consequently, without additional protection, even a small SYN flood can overwhelm a remote host. There are many similar attacks that exploit other code vulnerabilities including TCP ACK, NUL, RST and DATA floods, IP fragment floods, ICMP Echo Request floods, DNS Request floods, and so forth.
Finally, while most attacks target their victim directly, some sophisticated attackers will implicitly attack sites by focusing on dependent infrastructure such as upstream routers or back-end database servers.
2.2 Distributed Attacks
While a single host can cause significant damage by sending packets at its maximum rate, attackers can (and do) mount more powerful attacks by com-bining the resources of multiple hosts. Typically an attacker compromises a set of Internet hosts (using manual or automated methods) and installs a small attack daemon on each, producing a group of “zombie” or “bot” hosts. This dae-mon typically contains both the code for sourcing a variety of attacks and some basic communications infrastructure to allow for remote control. Using vari-ants of this basic architecture, an attacker can focus a coordinated attack from thousands of zombies onto a single site.
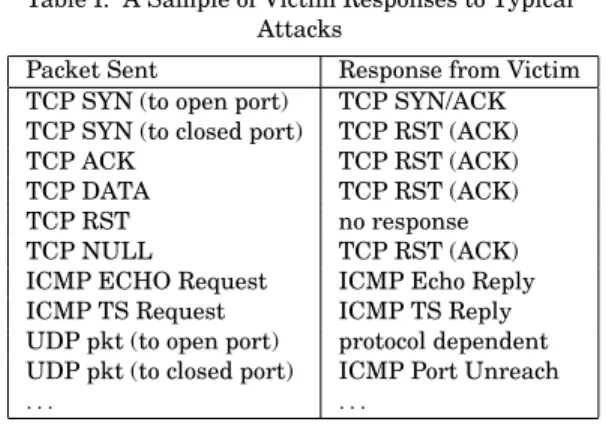
Table I. A Sample of Victim Responses to Typical Attacks
Packet Sent Response from Victim
TCP SYN (to open port) TCP SYN/ACK TCP SYN (to closed port) TCP RST (ACK)
TCP ACK TCP RST (ACK)
TCP DATA TCP RST (ACK)
TCP RST no response
TCP NULL TCP RST (ACK)
ICMP ECHO Request ICMP Echo Reply
ICMP TS Request ICMP TS Reply
UDP pkt (to open port) protocol dependent UDP pkt (to closed port) ICMP Port Unreach
. . . . . .
2.3 IP Spoofing
To conceal their location, thereby forestalling an effective response, many at-tackers forge, or “spoof,” the IP source address of each packet they send. Con-sequently, the packets appear to the victim to be arriving from one or more third parties. Spoofing can also be used to “reflect” an attack through an in-nocent third party. And finally, an attacker can mount an attack that uses the true source address of each compromised machine, thereby avoiding IP address spoofing. In this article we focus solely on attacks using random address spoof-ing and in Section 3.2 we discuss how the existence of these other attacks biases our results in a conservative direction.
3. BASIC METHODOLOGY
As noted in the previous section, attackers can spoof the source IP address field to conceal the location of the attacking host. The key observation behind our technique is that for direct denial-of-service attacks, programs spoofing their address typically select source addresses at random for each packet sent.2
When a spoofed packet arrives at the victim, the victim usually sends what it believes to be an appropriate response to the faked IP address (such as shown in Table I). Occasionally, an intermediate network device (such as a router, load balancer, or firewall) may issue its own reply to the attack via an ICMP message [Postel, Editor 1981]. Again, these ICMP messages are sent to the randomly spoofed source address. Internet infrastructure devices may also be the targets of denial-of-service attacks, either directly via attacks aimed at an interface IP address, or indirectly via a TTL expiry or similar attack.
Because the attacker’s source address is selected at random, the victim’s responses are also distributed across the entire Internet address space, an in-advertent effect called “backscatter.” This behavior is illustrated in Figure 1.
2This behavior was extremely common in the first generation of distributed attack tools, such as Shaft, TFN, TFN2k, Blitznet, Stacheldraht, mstream and Trinity, and remains in most modern tools that spoof their source address as well.
Fig. 1. An illustration of backscatter in action. Here the attacker sends a series of SYN packets towards the victim V, using a series of random spoofed source addresses named B, C, and D. Upon receiving these packets the victim responds by sending SYN/ACKs to each of spoofed hosts. 3.1 Backscatter Analysis
Assuming per-packet random source addresses, reliable delivery and one re-sponse generated for every packet in an attack, the probability of a given host on the Internet receiving at least one unsolicited response from the victim is 1−(1− 1
232) m
during an attack ofmpackets. If one monitorsndistinct IP ad-dresses, then the expected probability of observing at least one packet from the attack is: 1− 1− n 232 m
Similarly, the expected number of unsolicited responses seen during an at-tack ofmpackets at a single host is2m32. When monitoringndistinct IP addresses,
the expected number of responses seen is: E(X)=nm
232
Thus, by observing a large enough address range, we can effectively “ple” all such denial-of-service activity on the Internet. Contained in these sam-ples are the identity of the victim, information about the kind of attack, and a timestamp from which we can estimate attack duration. Moreover, given these assumptions, we can also use the average arrival rate of unsolicited responses directed at the monitored address range to estimate the actual rate of the attack being directed at the victim, as follows:
R≥ R2
32
n
where R is the measured average interarrival rate of backscatter from the victim, and Ris the extrapolated attack rate in packets-per-second.
We term such a measurement device anetwork telescope—an analogy to phys-ical observatories. As random photons are detected by a light-based telescope in proportion to the size of its aperture, so too do random backscatter packets
arrive at a network telescope in proportion to the size of its address space. At-tacks of shorter duration or lower intensity generate fewer backscatter packets and thus require larger network telescopes to resolve. We provide a complete analytic model covering the impact of network telescope size, confidence, and event duration in a previous report [Moore et al. 2004].
3.2 Analysis Limitations
There are three assumptions that underlie our analysis:
—Address uniformity: attackers spoof source addresses at random.
—Reliable delivery: attack traffic is delivered reliably to the victim and backscatter is delivered reliably to the monitor.
—Backscatter hypothesis: unsolicited packets observed by the monitor repre-sent backscatter.
We discuss potential biases that arise from these assumptions below.
Key among our assumptions is the random selection of source address. There are four reasons why this assumption may not be valid. First, many attacks today do not use address spoofing at all. There are multiple reasons for this.
First, ISPs increasingly employingress filtering[Ferguson and Senie 2000; Cisco Systems 1999] on their routers to drop packets with source IP addresses outside the range of a customer’s network. Thus, an attacker’s source address range may not include any of our monitored addresses and we will underesti-matethe total number of attacks. While it is unknown how pervasive such filter-ing is, we expect that it will only increase. Over time, this will cause backscatter-based analyses to increasingly undercount denial-of-service attacks.
“Reflector attacks” pose a second problem for source address uniformity. In this situation, an attacker “launders” the attack by sending a packet spoofed with the victim’s source address to a third party. The third party responds by sending a response back towards the victim. If the packets to the third party are addressed using a broadcast address (as with the popular smurf or fraggle attacks) then third parties may further amplify the attack. The key issue with reflector attacks is that the source address is specifically se-lected. Unless an IP address in the range we monitor is used as a reflector, we will be unable to observe the attack. We have detected no instances of a monitored host involved in this sort of attack. Our inability to detect “reflec-tor attacks” causes us to underestimatethe total number of denial-of-service attacks.
Finally, and perhaps most importantly, as attackers have improved their automated methods for compromising hosts, it is widely believed that the moti-vation for address spoofing has been reduced. To wit, if a victim is attacked by 100,000 distinct hosts, the knowledge of their true source IP addresses offers little operational benefit to the victim and minimal threat to the attacker (the costs of collecting forensic information across such a large set is prohibitive). Once again, attacks using their true source addresses will strictly cause us to underestimatethe total number of attacks.
Another limitation arises from our assumption that packets are delivered reliably and that every packet generates a response. During a large attack it is likely that packets from the attacker may be queued and dropped. Those packets thatdoarrive may be filtered or rate-limited by firewall or intrusion detection software [Cisco Systems 1997] and moreover some forms of attack traffic (e.g., TCP RST messages) do not typically elicit a response. Finally, the responses themselves may be queued and dropped along the path back to our monitored address range. In particular, our estimate of the attack rate is necessarily limited both by the capacity of the smallest bottleneck link between the victim and the monitor and by the ability of the victim to generate responses to the attack traffic. As with our random distribution assumption, these limitations will cause us to underestimate the number of attacks and the attack rate. For example, during the widely publicized attack on Web servers of the SCO Group, our approach inferred a rate peaking at 50kpps when monitors at the victim’s ISP recorded inbound attack packets in excess of 200kbps [Moore and Shannon 2003]. Moreover, this underestimation may also bias our characterization of victims (for example, if large e-commerce sites are more likely to have rate-limiting software than educational sites, then we may disproportionately underestimate the size of attacks on this class of victim).
The final limitation of our technique is that we assume unsolicited responses represent backscatter from an attack. Any server on the Internet is free to send unsolicited packets to our monitored addresses, and these packets may be misinterpreted as backscatter from an attack. It is possible to eliminate accidental errors by choosing a quiescent address range for monitoring, filtering those packet flows that are consistently destined to a single host in the range, and by high-pass filtering to only record sufficiently long and voluminous packet flows. However, a concerted effort by a third-party to bias our results would be difficult to detect and correct automatically. The most likely source of such bias arises from misinterpretation of random port scans as backscatter. While it is impossible to eliminate this possibility in totality, we will show that the vast majority of attacks we observe can be trivially differentiated from typical scanning activity.
In spite of its limitations, we believe our overall approach is sound and pro-vides at worst a conservative estimate of current denial-of-service activity.
4. ATTACK DETECTION AND CLASSIFICATION
An important aspect of analyzing denial-of-service attacks is identifying and classifying them from passive packet measurements. We use a three-step method to accomplish this. We first process the raw packet trace data to identify and extract backscatter packets. We then use a flow-based technique to com-bine related packets into attack flows based on the victim IP address. Finally, we further filter these attack flows to select those whose estimate intensity, duration, and rate are worth further analysis.
4.1 Extracting Backscatter Packets
Starting with raw traffic traces, we perform the following steps to extract backscatter packets:
— Remove packets involving legitimate hosts in the network telescope address space.
— Remove packets that do not correspond toresponsetraffic, as in Table I. Note that we remove UDP packets addressed to the telescope, but retain UDP packets addressed to the victim that appear inside ICMP responses.
— Remove traffic from hosts that use TCP RST packets for scanning. Most port scan activity is automatically removed since it does not consist of response traffic. However, a rare but important exception is RST scanning which is sometimes used to infer firewall policy rules. It is important to try to exclude such scans since they do not reflect denial-of-service activity and they can cause attack rates to be substantially overestimated. Under manual inspec-tion most of these scans are evident in clearly sequential scanning patterns. To automatically remove these packets we search for RSTs with clearly non-random targeting behaviors. More precisely, for a given source address we remove TCP RSTs (without acknowledgements) for which the ratio of IP ad-dresses scanned to distinct /16 networks probed is greater than 255 within a given 1-minute period.
— Perform aggressive potential duplicate packet suppression to ensure that packets duplicated either in the network or by the denial-of-service attack victim (for example, multiple SYN ACKs to a single SYN) do not artificially magnify the scope of an attack [Moore et al. 2004]. In this study, we remove any packet with the same flow tuple<source IP address, destination IP ad-dress, protocol, source port, destination port>as another packet seen in the last five minutes. For ICMP error messages, we extract the IP addresses, protocol and ports from the original packet within the ICMP messages. Note that a high-rate packet stream with constant IP addresses, protocol, and ports in the raw data would, at most, result in one packet per five minutes in the extracted backscatter dataset. This approach provides very aggressive suppression, removing packets that may not be true packet-level duplicates, thus leading to underestimation of packet counts and rates.
4.2 Flow-Based Classification
After extracting the backscatter packets, we then aggregate related packets into attacks. Although intuitive at a high level, the choice of a specific aggrega-tion methodology presents significant technical challenges for automating the process. For example, it is often unclear whether contemporaneous backscatter indicating both TCP- and ICMP-based attacks should be classified as a single attack or multiple attacks—as described below, we treat them as a single at-tack. More difficult still, is the problem of determining an attack’s start and end times. In the presence of significant variability, too lenient a threshold can bias subsequent analyses towards fewer attacks of longer duration and low average packet rates, while too strict an interpretation biases towards a large number of short attacks with highly variable rates. Without knowledge of the intent of the attacker or direct observation of the attack, it is impossible to create a synthetic classification system that will group all types of attacks appropriately for all metrics.
Fig. 2. The sensitivity of the number of attacks to the value of the flow timeout parameter.
4.2.1 Flow-Based Identification. We have chosen to use a flow-based method of attack identification as is commonly used to group Internet traf-fic [Claffy 1994; Cisco Systems 2004]. For the purpose of this study, we define a flowas a series of consecutive packets sharing the same victim IP address. We explored several approaches for defining flow lifetimes and settled on a fixed timeout approach: the first packet seen for a victim creates a new flow, and we associate any additional packets from that victim with that flow if the pack-ets arrive at the telescope within a fixed timeout relative to the most recent packet in this flow. With this methodology, the choice of parameters can signif-icantly influence the final results since a more conservative timeout will lead to fewer, longer attacks, and a shorter timeout will lead to a large number of short attacks. Next we study the sensitivity of the number of attacks to the value of the flow timeout parameter to make an informed choice for subsequent analyses.
4.2.2 Flow Timeout. The flow timeout parameter defines the maximum time interval between two backscatter packets from the same victim for those packets to belong to the same flow. For a continuous stream of backscatter packets from a victim, we need to partition it into discrete flows, and the flow timeout parameter determines when one flow ends and another begins. Note that a smaller flow timeout will partition a continuous backscatter stream into more flows than a larger flow timeout.
Figure 2 shows the sensitivity of attack counts to a range of values for the flow timeout parameter. The curve shows how the number of inferred attack flows changes as the flow timeout parameter varies between 60 seconds and two hours. For the analyses in the rest of the article, we use a conservative flow timeout of five minutes (300 seconds). Real attacks greater than 0.85 packets per second will satisfy this requirement in expectation, so attacks inadvertently discarded are also attacks that are unlikely to cause significant harm to victims (even dialup victims).
Table II. Default Values for the Parameters Used to Identify Denial-of-Service Attacks
Parameter Value in Paper
Flow timeout 5 minutes
Packet threshold >25 packets Attack duration >60 seconds
Packet rate >0.5 packets-per-second (pps)
Fig. 3. The sensitivity of the number of flows to the value of the packet threshold parameter. 4.3 Deriving Denial-of-Service Attacks
Once we partition a stream of packets to a victim into discrete flows, we use three additional parameters to classify those flows into attacks for further anal-ysis:packet threshold,attack durationandpacket rate. For each parameter, we show the sensitivity of the results to a range of values for the parameter, and motivate our choice of default values shown in Table II. The sensitivity analysis focuses on the first week of our data (February 1, 2001), although the results are similar for subsequent weeks. When varying one parameter, we use the default values of the other parameters attained from sensitivity analyses.
4.3.1 Packet Threshold. The first criterion we use to classify a flow as an attack is the packet threshold. The packet threshold parameter defines the minimum number of seen packets in a flow necessary to classify that flow as an attack. For a given set of candidate flows, larger packet thresholds result in fewer qualifying as attacks. Our goal is to filter out attacks with very few packets since, as flooding attacks, small attacks have a negligible impact on a host. Including them biases aggregate metrics towards smaller attacks and exaggerates their importance.
Figure 3 shows the sensitivity of flow counts to a range of values for the packet threshold parameter. The curve shows how the number of flows changes as the packet threshold parameter varies between 1 and 250 packets. From the graph, we see that the number of flows drops rapidly as a function of the packet threshold. For the analyses in this article, we conservatively chose a
Fig. 4. The sensitivity of the number of flows to the value of the attack duration parameter.
packet threshold of 25 packets to classify a packet flow as an attack. Although negligible to a well-connected Internet host, a packet threshold of 25 pack-ets corresponds to a 22-minute attack on a 56.6 Kb/s modem using 1500 byte packets.
4.3.2 Attack Duration. In addition to satisfying a packet threshold, we only classify a flow as an attack flow if it also satisfies a time duration threshold called theattack duration. The attack duration is simply the minimum amount of time between the first and last packet of the flow. For a given set of candidate flows, larger durations result in fewer qualifying as attacks. As with the packet threshold, our goal is to filter out short attacks, which have negligible impact on a host.
Figure 4 shows the sensitivity of flow counts to a range of values for the attack duration parameter. The curve shows how the number of flows depends on the value of the attack duration as it varies between one second and one hour. From the graph, we see that the number of flows is relatively insensitive to attack durations less than 100 seconds, but beyond that drops off quickly.
For the analyses in this article, we chose an attack duration of 60 seconds. It is a reasonable minimum threshold for a denial-of-service attack of interest, and, from the graph, we include most attacks in the study since most flows have a duration much longer than this threshold.
4.3.3 Packet Rate. As the final criterion, we only classify a flow as an attack if the flow meets a threshold for maximum rate of packet arrivals (backscatter response packets) during some period of the flow. We compute the maximum packet rate for a flow as the largest packet rate across any 1-minute bucket dur-ing the flow. A flow can only be classified as an attack if the observed maximum packet rate is greater than the packet ratethreshold. We use the maximum packet rate over a 1-minute period, as opposed to the average packet rate over the entire flow lifetime, because there can be high variability in the ability of victims to generate response packets over time. For a given set of candidate
Fig. 5. The sensitivity of the number of flows to the value of the maximum backscatter packet rate seen in 1-minute period.
flows, a larger packet rate threshold results in fewer flows qualifying as at-tacks. With the packet rate parameter, our goal, again, is to filter out attacks that have negligible impact on a host.
Figure 5 shows the sensitivity of flow counts to a range of values for the packet rate parameter as it varies between 0 packets-per-second (pps) and 2 pps. From the graph, we see that the number of flows drops rapidly for packet rates between 0 pps and 0.2 pps, after which point the decline is gradual.
For the analyses in this article, we chose a packet rate threshold of 0.5 pps. Note that selecting a 0.5 pps filter corresponds to a 41 Kb/s attack using minimum-sized TCP packets or 1.5 Mb/s using 1500 byte packets. By excluding flows with packet rates less than 0.5 pps, we do not classify small events with minimal impact as attacks.
4.4 Extracted Information
Using the parameter values in Table II, we extract attacks from raw packet traces. We then examine each attack and extract the following information: —IP protocol: whether the attacking packets were TCP, UDP, ICMP, and so on. —TCP flag settings: whether the flow consists of SYN/ACKs, RSTs, and so on. —ICMP payload: for ICMP packets that contain copies of the original packet (for example, TTL expired), we extract the enclosed addresses, protocols, ports, and so on.
—Port settings: for source and destination ports (for both UDP and TCP) we record whether the port range is fixed or not
—DNS information: the full DNS record of the source address (the victim). Using this information, we generate a database in which each record charac-terizes the properties of a single attack. We use this database as the foundation for the higher level attack analyses in the next section.
Fig. 6. Our experimental backscatter collection platform. We monitor all traffic to a /8 network by passively capturing data as it is forwarded through a shared hub. This monitoring point represents the only ingress into the network.
5. ANALYSIS OF DENIAL-OF-SERVICE ACTIVITY
In this section we analyze the denial-of-service activity observed in our three years of traces. We start by describing our measurement platform for recording the packet traces in our study. Then we analyze the attacks in these traces from three perspectives. First, we present a high-level summary of the attack workload and the overall frequency of attacks seen in our traces. Second, we characterize various aspects of the attacks themselves, including their duration, their estimated rate, the network protocols used, and the network service (port) targeted. Finally, we characterize the victims of attacks in terms of victim type, top-level domain, and popularity. Generally, our analyses are comprehensive and include all of the attacks in our traces. Where appropriate, we also highlight aspects of denial-of-service activity that have changed over the last three years.
5.1 Experimental Platform
For our experiments, we monitored the sole ingress link into a lightly utilized /8 network (comprising 224distinct IP addresses, or 1/256 of the total IPv4 Internet address space). Our monitoring infrastructure, shown in Figure 6, consisted of a PC configured to capture all Ethernet traffic attached to a shared hub at the router terminating this network. During this time, the upstream router did filter some traffic destined to the network (notably external SNMP queries), but such filtering does not significantly impact our results. We also have some evidence that small portions of our address prefix are occasionally “hijacked” by inadvertent route advertisements elsewhere in the Internet, but at worst this should cause us to slightly underestimate attack intensities.
5.2 Summary of Attack Activity
Over a period of three years, from February 1, 2001 through February 25, 2004, we used our backscatter collection platform, described in Section 5.1, to period-ically capture 22 traces of denial-of-service activity. Each trace roughly spans
Table III. Summary of Backscatter Database
Unique Victim Backscatter
Starting Date Duration Attacks Packets IPs Domains TLDs
2001-02-01 7.5 days 2,618 21,090,742 1,636 729 66 2001-02-11 6.2 days 2,242 30,222,201 1,510 659 63 2001-02-18 7.1 days 2,858 32,159,992 1,921 820 65 2001-02-25 8.9 days 3,346 49,449,404 2,050 677 62 2001-03-06 12.9 days 4,968 59,552,132 2,587 759 73 2001-03-19 8.2 days 2,635 23,588,586 1,618 506 60 2001-04-06 11.8 days 4,343 44,508,551 2,563 694 70 2001-04-22 5.4 days 1,944 14,386,681 1,197 398 55 2001-04-30 6.7 days 828 6,574,228 557 193 41 2001-05-07 14.1 days 4,990 60,647,948 2,933 774 80 2001-05-23 9.1 days 2,993 40,269,047 1,916 546 71 2001-06-01 8.5 days 3,026 47,508,181 1,930 575 60 2001-06-25 8.8 days 2,861 17,408,501 1,897 559 68 2001-07-04 15.8 days 5,666 52,882,496 3,102 747 79 2001-07-19 7.9 days 2,078 36,824,562 1,291 371 60 2001-08-01 7.0 days 974 16,420,358 670 248 47 2001-08-08 6.8 days 1,624 40,248,436 1,059 300 53 2002-05-09 17.5 days 4,820 69,933,861 2,855 681 82 2002-05-29 17.2 days 4,458 103,761,678 2,837 733 87 2002-12-11 7.3 days 2,340 31,139,696 1,016 296 46 2003-11-06 5.0 days 1,416 58,160,582 735 195 51 2004-02-25 10.0 days 5,692 210,181,843 3,088 531 63 Total 209.9 days 68,720 1,066,919,706 34,725 5,273 167
one week, and isolates the inbound portion of traffic to the /8 network. Using the methodology described in Section 4, we processed these traces to classify backscatter packets into individual attacks.
Table III summarizes the high-level characteristics of the traces and the attacks observed in them. Each trace was roughly 1–2 weeks in duration and observed 500–5700 attacks to 500–3100 victims. In total, we observed 68,700 attacks to 34,700 unique victim IP addresses in 5,300 distinct DNS domains. Across all traces, we captured more than 1,066 million backscatter packets (representing less than2561 of the backscatter traffic generated by victims during these periods).
Figure 7 shows a time series graph of the denial-of-service activity across all of our traces. The graphs show three interesting features of our denial-of-service backscatter workloads. First, in contrast to other Internet workloads such as Web [Wolman et al. 1999] and peer-to-peer file sharing [Saroiu et al. 2002], the number of active attacks does not exhibit the strong diurnal patterns of those other workloads. Second, the rate of attacks does not change significantly, even over extensive time periods. The average rate of attacks across three years of traces is 24.5/hour; the average rate in the first trace is 20.9/hour and the rate in the last trace is 74.4/hour.
Additionally we examined the time series of attacks grouped by victim /24 subnets to see if attacks were clustered on particular subnets. The number of attacks per hour to individual victim IP addresses is roughly equivalent to the number of attacks to victim /24 subnets. Counter-examples exist, however:
Fig. 7. Estimated number of victims per hour as a function of time (UTC).
Fig. 8. The measured intensity of an attack to one particular host during the week of February 18, 2001. The spikes occur at noon local time and last for an hour. The attack skipped February 20, 2001, which was a Tuesday.
for the last trace starting February 25, 2004, we see that many of the attacks targeted multiple hosts in the same subnet.
When examining individual attacks in more detail, we see that many attacks exhibit interesting behavior over time. For instance, Figure 8 shows the inten-sity of one particular attack over the course of one week, which exhibits daily periodic behavior. Like clockwork, at the same time every day the attack in-creases in intensity from a background rate of 10 measured packets per second (an estimated 2,500 pps) to 400–625 measured packets per second (an esti-mated 100,000–160,000 pps). The intense attack persists for an hour, and then subsides into the background. Interestingly, the attack does not flare up on one day of the week, Tuesday. Many attacks exhibit such daily periodic behavior, including consistently skipping a day, suggesting that the attacks are scripted.
5.3 Attack Classification
Next we characterize the attacks observed in our traces, focusing on the proto-cols used in the original attack packets as well as attack rates and durations.
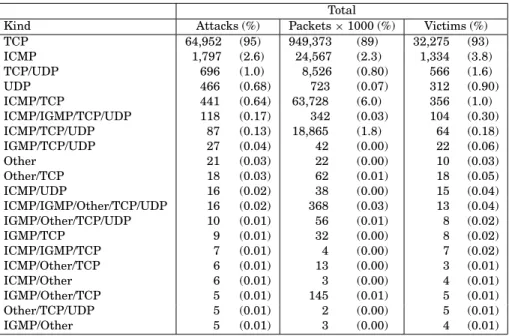
Table IV. Breakdown of Protocols Used in all Attacks Across all Traces. An Entry with Multiple Protocols Indicates an Attack Consisting of a Combination of Packets from Each of the Protocols Listed. “Other” Indicates that the Attack Contained Packets with One or More
Miscellaneous Protocols Other Than Those Named in the Table Total
Kind Attacks (%) Packets×1000 (%) Victims (%)
TCP 64,952 (95) 949,373 (89) 32,275 (93) ICMP 1,797 (2.6) 24,567 (2.3) 1,334 (3.8) TCP/UDP 696 (1.0) 8,526 (0.80) 566 (1.6) UDP 466 (0.68) 723 (0.07) 312 (0.90) ICMP/TCP 441 (0.64) 63,728 (6.0) 356 (1.0) ICMP/IGMP/TCP/UDP 118 (0.17) 342 (0.03) 104 (0.30) ICMP/TCP/UDP 87 (0.13) 18,865 (1.8) 64 (0.18) IGMP/TCP/UDP 27 (0.04) 42 (0.00) 22 (0.06) Other 21 (0.03) 22 (0.00) 10 (0.03) Other/TCP 18 (0.03) 62 (0.01) 18 (0.05) ICMP/UDP 16 (0.02) 38 (0.00) 15 (0.04) ICMP/IGMP/Other/TCP/UDP 16 (0.02) 368 (0.03) 13 (0.04) IGMP/Other/TCP/UDP 10 (0.01) 56 (0.01) 8 (0.02) IGMP/TCP 9 (0.01) 32 (0.00) 8 (0.02) ICMP/IGMP/TCP 7 (0.01) 4 (0.00) 7 (0.02) ICMP/Other/TCP 6 (0.01) 13 (0.00) 3 (0.01) ICMP/Other 6 (0.01) 3 (0.00) 4 (0.01) IGMP/Other/TCP 5 (0.01) 145 (0.01) 5 (0.01) Other/TCP/UDP 5 (0.01) 2 (0.00) 5 (0.01) IGMP/Other 5 (0.01) 3 (0.00) 4 (0.01)
5.3.1 Attack Protocols. Table IV shows the distribution ofattack protocols across all attacks in our traces. The attack protocol is the network protocol used by the attacker to produce the backscatter monitored at our network. The table shows the breakdown according to the number of attacks and the number of backscatter packets comprising those attacks. The vast majority of attacks (93%) and packets (88%) use TCP as their protocol of choice. A small fraction of attacks used ICMP (2.6%), although per-attack they produced more than twice the number of packets on average than the TCP attacks. Other protocols represent a small fraction of both attacks and backscatter packets, and the remaining attacks employed a combination of protocols in each attack.
Table V further breaks down the TCP attacks in terms of the service tar-geted by the attack, as determined by the victim port number specified in the attack packets. Overall, the attacks target a wide range of popular TCP ser-vices. However, most of the attacks target multiple ports, and most of these are well spread throughout the port address range. Individually, the most popular services targeted are HTTP (port 80), IRC (6667), port 0, and Authd (113).
5.3.2 Attack Rate. A key metric for characterizing the severity of attacks is the rate at which attack packets bombard a victim. Figure 9 shows two cumulative distributions of estimated attack rates in packets per second. The lower curve shows the cumulative distribution of the maximum estimated at-tack rate seen in 1-minute intervals, and the upper curve shows the cumulative distribution of estimated average attack rates. As described earlier, we calculate
Table V. Breakdown of TCP Attacks by Victim Port Number. Percentages Based Only Upon Attacks Using TCP. “Multiple” Indicates that an Attack
Targeted Multiple Ports Total
Kind Attacks (%) Packets×1000 (%) Victims (%)
Multiple 54,461 (82) 696,920 (69) 27,623 (83) HTTP (80) 3,634 (5.5) 154,625 (15) 1,555 (4.7) IRC (6667) 1,116 (1.7) 50,791 (5.0) 641 (1.9) 0 950 (1.4) 4,034 (0.40) 736 (2.2) Authd (113) 698 (1.1) 4,118 (0.41) 529 (1.6) Netbios (139) 587 (0.88) 28,887 (2.8) 427 (1.3) 1 542 (0.82) 14,651 (1.4) 267 (0.80) Telnet (23) 431 (0.65) 10,050 (0.99) 256 (0.77) FTP (21) 411 (0.62) 4,342 (0.43) 318 (0.96) SSH (22) 219 (0.33) 2,560 (0.25) 159 (0.48) DNS (53) 204 (0.31) 1,802 (0.18) 153 (0.46) 33000 132 (0.20) 23 (0.00) 107 (0.32) 7100 115 (0.17) 225 (0.02) 23 (0.07) SMTP (25) 105 (0.16) 1,236 (0.12) 50 (0.15) POP (110) 94 (0.14) 282 (0.03) 32 (0.10) 5000 86 (0.13) 531 (0.05) 41 (0.12) 1080 76 (0.11) 121 (0.01) 52 (0.16) 1025 66 (0.10) 139 (0.01) 46 (0.14) 135 53 (0.08) 67 (0.01) 40 (0.12) 7000 46 (0.07) 267 (0.03) 17 (0.05)
Fig. 9. Cumulative distributions of estimated attack rates in packets per second.
the attack rate by multiplying the average arrival rate of backscatter packets by 256 (assuming that an attack represents a random sampling across the en-tire address space, of which we monitor 2561 ). Note that the graph shows the attack rate (x-axis) using a logarithmic scale.
How threatening are the attacks that we see? Experiments with SYN attacks on commercial platforms show that an attack rate of only 500 SYN packets per second is enough to overwhelm a server [Darmohray and Oliver 2000]. In our trace, 65% of attacks had an estimated rate of 500 packets per second or higher.
Fig. 10. Cumulative and probability distributions of attack durations.
The same experiments show that even with a specialized firewall designed to resist SYN floods, a server can be disabled by a flood of 14,000 packets per second. In our data, 4% of attacks would still compromise these attack-resistant firewalls. These attack rates indicate that the majority of the attacks we have monitored are intense enough to overwhelm commodity solutions, and a small fraction are intense enough to overwhelm even optimized countermeasures.
5.3.3 Attack Duration. While attack event rates characterize the intensity of attacks, they do not give insight on the duration of attacks. For this metric, we measured the duration of attacks across all traces. Figures 10(a) and 10(b) show the results of these measurements.
Figure 10(a) shows the cumulative distribution of attack durations in units of time (note the x-axis is logarithmic). We find that most attacks are relatively short: 60% of attacks are less than 10 minutes in duration, 80% are less than 30 minutes, and 85% last less than an hour. However, the tail of the distribution is long: 2.4% of attacks are greater than five hours, 1.5% are greater than 10 hours, and a tiny percentage (0.53%) span multiple days.
Figure 10(b) shows the probability density of attack durations as defined using a histogram of 150 buckets in the time domain. The x-axis is in log-arithmic units of time, and the y-axis is the percentage of attacks that lasted a given amount of time. For example, 4.3% of attacks had a duration of one minute. As we saw in Figure 10(a), the bulk of the attacks are relatively short, lasting from 1–30 minutes. Peaks in the distribution occur around durations of five minutes (10.8% of attacks), 10 minutes (9.7%), and 1.5 hours (1.7%).
5.4 Victim Classification
In this section we characterize the victims of the attacks in our traces, focusing on victim host types inferred from DNS names, the top-level domains of victims, and the popularity of victims over time.
5.4.1 Victim Type. Table VI shows the distribution of attacks according to the DNS name associated with the victim’s IP address. We classify these using a hand-tuned set of regular expression matches (DNS names with “dialup”
Table VI. Breakdown of Victim Hostnames Total
Kind Attacks (%) Packets×1000 (%)
In-Addr Arpa 28,547 (42) 498,775 (47) Unclassified 25,216 (37) 404,111 (38) Broadband 5,520 (8.0) 31,006 (2.9) Dial-Up 4,864 (7.1) 39,479 (3.7) IRC Server 1,156 (1.7) 49,950 (4.7) Nameserver 1,141 (1.7) 17,685 (1.7) Web Server 996 (1.4) 11,968 (1.1) Router 885 (1.3) 11,148 (1.0) Mail Server 377 (0.55) 2,501 (0.23) Firewall 18 (0.03) 297 (0.03)
correspond to modem connections, “dsl” or “home.com” represent broadband, and so on). The majority of attacks are not classified by this scheme, either because they are not matched by our criteria (shown by “Unclassified”), or, more likely, because there was no valid reverse DNS mapping (shown by “In-Addr Arpa”).
To gain insight into the nature of these “unknown” addresses, we selected two weeks of data almost two years apart (the weeks beginning February 1, 2001 and December 11, 2002) and analyzed 100 random victim hostnames in more detail. By visiting websites on the same network as these hostnames, we then categorized these victim addresses into one of several specific categories. Through this more in-depth analysis of hostnames, we observed that roughly half of the victims in these samples are broadband users, while slightly less than 10% are dial-up. An additional 5–10% of the victims are located on educational networks, while a small number of victims appear to be Internet hosting centers. This experiment suggests that the majority of victims of the attacks we observed are home users and small businesses rather than larger corporations.
Several interesting observations support this notion. Some of these attacks against home machines, particularly those directed towards cable modem users, constitute relatively large, severe attacks with rates in the thousands of packets per second. One explanation is that minor denial-of-service attacks are being used to settle personal vendettas. In the same vein, we anecdotally observe a significant number of attacks against victims running “Internet Relay Chat” (IRC), victims supporting multi-player game use (e.g., battle.net), and victims with DNS names that are sexually suggestive or incorporate themes of drug use. We further note that many reverse DNS mappings have been clearly com-promised by attackers (e.g., DNS resolutions such as “is.on.the.net.illegal.ly” and “the.feds.cant.secure.their.shellz.ca”).
Second, there is a small but significant fraction of attacks directed against network infrastructure. Over 1.3% of attacks target routers (e.g., core2-corel-oc48.paol. above.net), while 1.7% target name servers (e.g., ns4.reliablehosting.com). And some of these attacks, particularly a few tar-geting routers, are comprised of a disproportionately large number of packets. This behavior is particularly disturbing since overwhelming a router could deny service toallend hosts that rely upon that router for connectivity.
Table VII. Breakdown of Victim Top-Level Domains (TLDs). The “arpa” TLD Represents Those Attacks for which a Reverse DNS Lookup Failed
on the Victim IP Address Total
Kind Attacks (%) Packets×1000 (%) Victims (%)
arpa 28,547 (42) 498,775 (47) 14,513 (42) net 9,291 (14) 150,339 (14) 5,113 (15) com 7,721 (11) 162,539 (15) 4,046 (12) ro 7,235 (11) 33,661 (3.2) 3,031 (8.7) br 2,822 (4.1) 22,286 (2.1) 1,228 (3.5) edu 1,219 (1.8) 13,258 (1.2) 659 (1.9) ca 1,167 (1.7) 5,307 (0.50) 636 (1.8) org 890 (1.3) 26,340 (2.5) 431 (1.2) it 638 (0.93) 5,843 (0.55) 424 (1.2) mx 610 (0.89) 1,793 (0.17) 375 (1.1) nl 566 (0.82) 1,857 (0.17) 306 (0.88) jp 520 (0.76) 14,467 (1.4) 154 (0.44) de 435 (0.63) 3,114 (0.29) 247 (0.71) no 429 (0.62) 4,422 (0.41) 220 (0.63) uk 409 (0.60) 3,510 (0.33) 221 (0.64) be 405 (0.59) 1,516 (0.14) 177 (0.51) pl 383 (0.56) 1,794 (0.17) 188 (0.54) au 378 (0.55) 7,710 (0.72) 244 (0.70) se 346 (0.50) 11,548 (1.1) 216 (0.62) fr 313 (0.46) 1,083 (0.10) 145 (0.42)
Finally, we were surprised at the diversity of different commercial targets. While we certainly find attacks on bellwether Internet sites such as aol.com, amazon.com, ebay.com, microsoft.com, and yahoo.com, we also see attacks against a large range of smaller and medium-sized businesses.
5.4.2 Top-Level Domains. Table VII shows the distribution of attacks to the 20 most frequently targeted top-level domains (TLDs) across all traces. Each row shows the number of attacks and backscatter packets to a given TLD. We determined a victim’s TLD by issuing a reverse DNS lookup on its IP address. The largest category is thearpaTLD, which represents those attacks for which a reverse DNS lookup failed. In terms of the “three-letter” domains, over 10% of the attacks targeted the comandnetTLDs, whereas an order of magnitude fewer attacks (1.3–1.7%) targeted the eduand orgdomains. This bias is not surprising considering that sites in thecomandnetTLDs include most commercial ISPs and their customers, and consequently present more attractive and newsworthy targets.
In terms of the “country-code” TLDs, we see a disproportionate concentra-tion of attacks to a small group of countries. Surprisingly, attackers targeted Romania (ro)—a country with a relatively limited networking infrastructure— nearly as frequently as netand com, and attackers targeted Brazil (br) more thaneduandorgcombined.
5.4.3 Victims of Repeated Attacks. Finally, we examine the extent to which victims are attacked repeatedly over long time periods. For this measure, we count the number of times a victim appears in separate traces. Figure 11(a)
Fig. 11. Attack spans for victims attacked during more than one trace. Table VIII. The Host Types of the 15
Most Frequently Attacked Victims Host Type Number of Victims
Nameservers 5
IRC servers 3
Broadband 4
Education 2
No Hostname 1
shows these results. The values on the x-axis correspond to the number of distinct traces a victim address appeared in, and the values on the y-axis show the number of victims that appeared in this many distinct traces.
Overall, most victims (89%) were attacked in only one trace (typically span-ning roughly one week), and most of the remaispan-ning victims (7.8%) appear in two traces. Victims can appear in multiple traces because of attacks that span trace boundaries, causing the victims to be represented in both sets of trace data. For example, in four traces in adjacent weeks, on average 81% of the victims in each trace were unique to that trace. In contrast, five traces that were an average of eight months apart contained 98% victims unique to each trace. Looking at all 22 traces, 74% of the victims in each trace were targeted only during the collection of that trace. Nonetheless, a small percentage of victims (3%) appear in more than three traces, suggesting that these victims were indeed repeatedly targeted over time.
Figure 11(b) shows the distribution of attack durations for victims attacked in more than one trace. While most victims were attacked for only two weeks, a few remained a target for a period of years. A small number of victim ad-dresses (15) appear in 10 or more traces, raising the possibility that these unfortunate victims are regularly targeted for denial-of-service attacks. Look-ing qualitatively at the hostnames of these victims (Table VIII), we observe that nameservers and IRC servers are the most common perpetual targets for denial-of-service attacks. The most frequently targeted hosts were located in six countries (Table IX), with six victims in North America, eight in Europe,
Table IX. The Countries in Which the 15 Most Frequently Attacked Victims are Located
Country Number of Victims
United States 6 Romania 4 Norway 2 Japan 1 France 1 Austria 1
and two in Asia. The most frequently attacked host was install.tu-graz.ac.at, a host at the Graz University of Technology in Austria. Attacks targeted this machine in 17 out of 22 traces in attacks spanning 22 months.
5.5 Validation
The backscatter hypothesis states that unsolicited packets represent responses to spoofed attack traffic. This theory, which is at the core of our approach, is difficult to validate beyond all doubt. However, we can increase our confi-dence significantly through careful examination of the data and via related experiments.
First, most of the attacks and nearly all of the packets are attributed to backscatter that does not itself provoke a response (for example, TCP RST, ICMP Host Unreachable). Consequently, these packets could not have been used for probing our monitored network, and network probing is not a good alternative explanation for this traffic.
Next, for a portion of our dataset, we computed the Anderson-Darling test statistic to determine if the distribution of destination addresses seen in each attack is consistent with a uniform distribution (as predicted by the backscatter hypothesis). We validated this finding for most attacks at the 0.05 significance level.
We were also able to duplicate a portion of our analysis using data provided by Vern Paxson taken from several university-related networks in Northern California. This dataset overlaps three of our traces from February 1, 2001 to February 25, 2001, but only detects TCP backscatter with the SYN and ACK flags set. The address space monitored was also much smaller, consisting of three /16 networks ( 3
65536’s of the total IP address space). For 98% of the victim
IP addresses recorded in this smaller dataset, we found a corresponding record at the same time in our larger dataset. We can think of no mechanism other than backscatter that can explain such a close level of correspondence.
Finally, Asta Networks provided us with data describing denial-of-service attacks directly detected at monitors covering a large backbone network. While their approach captures different sets of attacks (in part due to ingress filtering as discussed in Section 3, and in part due to limited peering in the monitored network), their data from February 2001 qualitatively confirms our own. In particular, we were able to match several attacks they directly observed with contemporaneous records in our backscatter database.
6. RELATED WORK
While denial-of-service has long been recognized as a problem [Gilgor 1983; Needham 1994], there has been limited research on the topic. Most of the existing work can be roughly categorized as being focused on tolerance, diagnosis and localization. The first category is composed of both approaches for mitigating the impact of specific attacks [Cisco Systems 1997; Karn and Simpson 1999] and general system mechanisms [Banga et al. 1999; Spatscheck and Peterson 1999] for controlling resource usage on the victim machine. Usually such solutions involve a quick triage on data packets so minimal work is spent on the attacker’s requests and the victim can tolerate more potent attacks before failing. These solutions, as embodied in operating systems, firewalls, switches and routers, represent the dominant current industrial solution for addressing denial-of-service attacks.
The second area of research, akin to traditional intrusion detection, is about techniques and algorithms for automatically detecting attacks as they oc-cur [Fullmer and Romig 2000; Romig and Ramachandran 1999]. These tech-niques generally involve monitoring links adjacent to the victim and analyzing patterns in the arriving and departing traffic to determine if an attack has occurred.
The final category of work focuses on identifying the source(s) of DoS attacks in the presence of IP spoofing. The best known and most widely deployed of these proposals is so-calledingressand egress filtering [Cisco Systems 1999; Ferguson and Senie 2000]. These techniques, which differ mainly in whether they are manually or automatically configured, cause routers to drop packets with source addresses that are not used by the customer connected to the re-ceiving interface. Given the practical difficulty of ensuring that all networks are filtered, other work has focused on developing tools and mechanisms for tracing flows of packets through the network, independent of their ostensibly claimed source address [Bellovin 2000; Burch and Cheswick 2000; Dean et al. 2001; Savage et al. 2000; Song and Perrig 2001; Stone 2000].
There is a dearth of research concerned with quantifying attacks within the Internet—denial-of-service or otherwise. Probably the best known prior work is Howard’s Ph.D. thesis—a longitudinal study of incident reports received by the Computer Emergency Response Team (CERT) from 1989 to 1995 [Howard 1998].
Since then, several projects have started to collect large-scale attack data— primarily driven by logs from firewalls and intrusion detection systems. Among the better known of these is Symantec’s DeepSight system and the SANS Inter-net Storm Center. Yegneswaran et al. [2003] provide an analysis of this latter data source, although it is largely focused on port scanning activity as opposed to denial-of-service attacks.
An alternative approach for detecting and characterizing denial-of-service attacks was recently presented by Hussain et al. [2003]. Their work uses the spectral behavior of attack dynamics to infer the number of distinct sources behind a given attack. This work holds promise at exploring the dynamics of individual attacks (as observed on a given network) but does not provide any
data about global prevalence of such attacks. To our knowledge, our research re-mains the only quantitative and empirical study of wide-area denial-of-service attacks to date.
7. CONCLUSIONS
In this article we have presented a new technique, “backscatter analysis,” for es-timating denial-of-service attack activity in the Internet. Using this technique, we observed widespread DoS attacks in the Internet which are distributed among many different domains and ISPs. The size and length of the attacks we observed were heavy-tailed, with a small number of large and long attacks, surrounded by thousands of small short attacks. Moreover, we have seen a surprising number of attacks directed at a few foreign countries, at home ma-chines, and towards particular Internet services. Finally, during three years we witnessed over 68,000 attacks—with little sign of abatement—and it has become clear that such attacks are a common threat for those depending on the Internet.
ACKNOWLEDGMENTS
We would like to thank a number of people for their contributions to this project. We are particularly grateful to Brian Kantor, Jim Madden and Pat Wilson of UCSD who provided access to key network resources and helped us understand the local network topology. kc claffy at CAIDA provided support and valuable feedback throughout the project. David Wetherall and Gretta Bartels (then of Asta Networks) donated their time, data and insight. Vern Paxson of ICIR also provided valuable data and feedback at several stages of our work. Finally, we thank the anonymous reviewers for their comments and suggestions.
REFERENCES
BANGA, G., DRUSCHEL, P.,ANDMOGUL, J. 1999. Resource Containers: A New Facility for Resource Management in Server Systems. InProceedings of the 1999 USENIX/ACM Symposium on Op-erating System Design and Implementation. 45–58.
BELLOVIN, S. M. 2000. ICMP Traceback Messages. Internet Draft: draft-bellovin-itrace-00.txt. BURCH, H.ANDCHESWICK, B. 2000. Tracing Anonymous Packets to Their Approximate Source. In
Proceedings of the 2000 USENIX LISA Conference. New Orleans, LA, 319–327.
CISCOSYSTEMS. 1997. Configuring TCP Intercept (Prevent Denial-of-Service Attacks). Cisco IOS Documentation.
CISCOSYSTEMS. 1999. Unicast Reverse Path Forwarding. Cisco IOS Documentation.
CISCOSYSTEMS. 2004. Cisco NetFlow. Cisco IOS Documentation.http://www.cisco.com/warp/
public/732/Tech/netflow.
CLAFFY, K. C. 1994. Internet Traffic Characterization. Ph.D. thesis, UC San Diego.
COMPUTEREMERGENCYRESPONSETEAM. 1996. CERT Advisory CA-1996-21 TCP SYN Flooding At-tacks.http://www.cert.org/advisories/CA-1996-21.html.
COMPUTERSECURITYINSTITUTE ANDFEDERALBUREAU OFINVESTIGATION. 2004. 2004 CSI/FBI Com-puter Crime and Security Survey. ComCom-puter Security Institute report.
DARMOHRAY, T.ANDOLIVER, R. 2000. Hot Spares For DoS Attacks.;login: 25,7 (July).
DEAN, D., FRANKLIN, M.,ANDSTUBBLEFIELD, A. 2001. An Algebraic Approach to IP Traceback. In
Proceedings of the 2001 Network and Distributed System Security Symposium. San Diego, CA. FERGUSON, P.ANDSENIE, D. 2000. Network Ingress Filtering: Defeating Denial of Service Attacks
FULLMER, M.ANDROMIG, S. 2000. The OSU Flow-tools Package and Cisco Netflow logs. In
Pro-ceedings of the 2000 USENIX LISA Conference. New Orleans, LA.
GILGOR, V. 1983. A Note on the Denial-of-Service Problem. InProceedings of the 1983 IEEE
Symposium on Security and Privacy. Oakland, CA.
HOWARD, J. D. 1998. An Analysis of Security Incidents on the Internet. Ph.D. thesis, Carnegie Mellon University.
HUSSAIN, A., HEIDEMANN, J.,ANDPAPADOPOULOS, C. 2003. A Framework for Classifying Denial-of-Service Attacks. Karlsruhe, Germany, 99–110.
KARN, P.ANDSIMPSON, W. 1999. Photuris: Session-Key Management Protocol. RFC 2522. MOORE, D.ANDSHANNON, C. 2003. Network Telescopes: Technical report.http://www.caida.org/
analysis/security/sco-dos/.
MOORE, D., SHANNON, C., VOELKER, G. M.,ANDSAVAGE, S. 2004. Network Telescopes: Tech. Rep. CS2004-0795, UC San Diego. July.
NEEDHAM, R. 1994. Denial of Service: An Example.Commun. ACM 37,11 (Nov.), 42–47. POSTEL, EDITOR, J. 1981. Internet Control Message Protocol. RFC 792.
POULSEN, K. 2004. FBI busts alleged DDoS Mafia.http://www.securityfocus.com/news/9411. ROMIG, S.ANDRAMACHANDRAN, S. 1999. Cisco Flow Logs and Intrusion Detection at the Ohio State
university.login; magazine, 23–26.
SAROIU, S., GUMMADI, K. P., DUNN, R. J., GRIBBLE, S. D.,ANDLEVY, H. M. 2002. An Analysis of internet content delivery systems. InProceedings of the 2002 USENIX/ACM Symposium on Operating System Design and Implementation.
SAVAGE, S., WETHERALL, D., KARLIN, A.,ANDANDERSON, T. 2000. Practical Network Support for IP Traceback. InProceedings of the 2000 ACM SIGCOMM Conference. Stockholm, Sweden, 295–306. SONG, D.ANDPERRIG, A. 2001. Advanced and Authenticated Marking Schemes for IP Traceback.
InProceedings of the 2001 IEEE INFOCOM Conference. Anchorage, AK.
SPATSCHECK, O.ANDPETERSON, L. 1999. Defending Against Denial of Service Attacks in Scout. In Proceedings of the 1999 USENIX/ACM Symposium on Operating System Design and Implemen-tation. 59–72.
STONE, R. 2000. CenterTrack: An IP Overlay Network for Tracking DoS Floods. InProceedings of the 2000 USENIX Security Symposium. Denver, CO, 199–212.
VIJAYAN, J. 2004. E-Biz sites hit with targetedattacks, extortion threats. http://www.
computerworld.com/securitytopics/security/story/0,10801,9614 %9,00.html?SKC=security-96149.
WOLMAN, A., VOELKER, G. M., SHARMA, N., CARDWELL, N., BROWN, M., LANDRAY, T., PINNEL, D., KARLIN, A.,ANDLEVY, H. 1999. Organization-based analysis of web-object sharing and Caching. In
Proceedings of the 2nd USENIX Symposium on Internet Technologies and Systems (USITS). Boulder, CO.
YEGNESWARAN, V., BARFORD, P.,ANDULLRICH, J. 2003. Internet Intrusions: Global Characteristics and Prevalence. San Diego, CA.