Munich Personal RePEc Archive
Cross-border mergers and acquisitions
and inter-urban gravity
Ito, Banri
Aoyama Gakuin University
16 November 2020
Online at
https://mpra.ub.uni-muenchen.de/103985/
Cross-border mergers and acquisitions and inter-urban gravity*
Banri ITO†
Aoyama Gakuin University
November 16, 2020
Abstract
Cross-border mergers and acquisitions (M&As) have grown rapidly in recent years and are a major part of foreign direct investment (FDI). However, M&A distribution is highly skewed, with most of the activity concentrated in certain countries and even in certain cities. Only a handful of cities account for most M&As. Unlike many previous studies that have relied on a gravity model approach using the bilateral volume of FDI, this study examines the determinants of cross-border M&As by applying an FDI gravity model to inter-city investment flows in the world. The empirical results, which are based on panel data of M&A flows across 44 major cities in the world from 2010 to 2017, show that besides the basic attributes used in conventional gravity models, such as market size and distance between origin city and destination city, urban-specific attributes such as the agglomeration of the world’s top-ranked firms and the number of foreign residents have a statistically significant explanatory power for inward M&As.
Keywords: Gravity model, M&As, border effects, inter-city investment, agglomeration
JEL Classifications: F14, F21, F23, R12
_____________________________
* The author is grateful to the participants at the ETSG 2019 Conference in Bern and seminar participants at Aoyama Gakuin University and the University of Hawaii for their helpful comments and suggestions. This work was supported by research grants from the Institute of Economic Research, Aoyama Gakuin University, Japan Society for the Promotion of Science (JSPS) KAKENHI Grant Number 20K01634,and Nomura Foundation for Social Science.
† College of Economics, Aoyama Gakuin University, 4-4-25, Shibuya, Shibuya-ku, Tokyo 150-8566, Japan, E-mail: [email protected]
1. Introduction
Over the last decade, cross-border mergers and acquisitions (M&As) have seen a sharp increase
in activity. According to UNCTAD (2019), the value of net cross-border M&As has reached
62% of foreign direct investment (FDI) inflows. Most of them are concentrated in developed
countries, accounting for 84% of the global total. This study asserts that such flows are
concentrated only in a handful of cities. Table 1 shows the proportion of the top 1%, 5%, and
10% of the target cities to the total value of inward M&As in the country. From the table, it can
be seen that the value of M&As is concentrated in certain cities in a country. In China, France,
and Japan, the top 1% of cities account for more than half of the total, and the top 10% account
for approximately 90% of the total. Such significant bias toward particular cities can also be
seen in France, Germany, Japan, the United Kingdom, and the United States.
[Insert Table 1 here]
Conventionally, we rely on a gravity equation using bilateral transactions to explain
international trade and FDI. However, the concentration of M&As in specific cities raises doubt
about the validity of this traditional approach based on bilateral transactions. Firms may make
investment decisions by considering the attributes of the target city rather than the target country,
and the distance from the origin city to the target city rather than the distance between the
capitals. The factors that cause M&As to be concentrated in some cities have not yet been
3
previous studies using a gravity model for bilateral FDI,1 this study examines the determinants
of cross-border M&As by applying a gravity model to inter-city M&As across the world.
This paper contributes to the literature by empirically showing how the gravity model
for bilateral FDI fits inter-city M&As. The gravity model is estimated using data collected from
44 cities in the world for city-level attributes. To the best of my knowledge, this study is the
first attempt to estimate a gravity model for cross-border M&As at the city level. It examines
whether a gravity model for bilateral FDI also explains inter-city M&A volumes with plausible
signs of basic gravity variables such as market size and geographical distance. Further, this
study answers the question, which urban attributes attract M&As? One possible explanation for
why such trade is so much more concentrated in specific cities is the benefits from
agglomeration.2 The agglomeration of foreign-invested firms in destination cities likely
generates a Marshallian externality that arises from the pooling of specialized workers and the
sharing of intermediate input and knowledge (Fujita and Thisse, 1996). As Duranton and Puga
(2004) pointed out, the externality from agglomeration is one of the important factors for a
firm’s location choice. Thus, the agglomeration of foreign-invested firms is likely to be an
1 See Brainard (1997), Markusen and Maskus (2002), Portes and Rey 2005, Bénassy-Quéré et al. (2005), Bergstrand and Egger (2007), Kleinert and Toubal (2010), Blonigen and Piger (2014), Román et al. (2016), and Hoshi, Kiyota, 2019. Head and Mayer (2015) provide a literature review with regard to the Gravity Model of FDI. With respect to cross-border M&As, Hyun and Kim (2010) examine the determinants of bilateral M&As using gravity model.
2 For example, Head et al. (1995) provide evidence that vertical supplier-assembler relationship attracts subsequent FDI by using Japanese multinational enterprises. A meta-analysis of the effect of agglomeration economies on FDI location by Jones (2017) shows that agglomeration economies have a positive impact on FDI location.
attractive city attribute that triggers subsequent M&As. This study sheds light on the role of the
agglomeration of foreign-invested firms in target cities in M&As across major cities. Another
contribution of this study is to present evidence of border effects on M&As by dealing with
both intra-national and cross-border transactions. As noted by Jones et al. (2018), little is known
about border costs in terms of FDI compared to international trade. The present study examines
as to whether border effects still remain in the M&A flow across cities.
The remainder of this paper is organized as follows: Section 2 elaborates on the gravity
equation for inter-city M&As and the variables to be used in the estimation, Section 3 explains
the data used in the estimation of the gravity model, Section 4 presents the estimation results of
the gravity model, and Section 5 highlights conclusions drawn from the investigation.
2. Application of the gravity model to cross-border M&As
Head and Ries (2008) developed a gravity model to examine the determinants of FDI. They
theoretically derived the gravity model for FDI, based on an idea from an inspection game
between the headquarters of a multinational enterprise and a subsidiary. They specify the costs
and benefits of controlling a remote overseas subsidiary. The model assumes that managers at
the headquarters are required to monitor the managers at the overseas subsidiary to exert effort
and therefore, maximize the value of the subsidiary. Monitoring costs are assumed to increase
with the bilateral geographical distance between the headquarters and the subsidiary. In addition,
5
consideration, they derived a gravity model that includes origin and target
country-specific factors and bilateral distance. This existing framework is useful when considering an
extension to an intercity-level analysis of cross-border M&As. As panel data are used in the
estimation of this study, the gravity model for FDI is modified to include the time dimension.
A gravity model for explaining inter-city M&As from origin city i to target city j in year t 𝑀𝑀𝑀𝑀𝑖𝑖𝑖𝑖𝑖𝑖
is expressed as follows:
𝑀𝑀𝑀𝑀𝑖𝑖𝑖𝑖𝑖𝑖 = exp�O𝑖𝑖𝑖𝑖′𝛼𝛼+ T𝑖𝑖𝑖𝑖′𝛽𝛽+ D𝑖𝑖𝑖𝑖𝑖𝑖𝜃𝜃� 𝜀𝜀𝑖𝑖𝑖𝑖𝑖𝑖 (1)
where O𝑖𝑖𝑖𝑖′is the vector of time-variant origin city-year specific factors, T𝑖𝑖𝑖𝑖′ is the vector of
time-variant target city-year specific factors, D𝑖𝑖𝑖𝑖𝑖𝑖 is the vector of origin-target city pair characteristics, and 𝜀𝜀𝑖𝑖𝑖𝑖𝑖𝑖 is the disturbance term.
With respect to the time-varying origin- and target-city-year specific variables, this
study uses population size (𝑃𝑃𝑃𝑃𝑃𝑃𝑖𝑖𝑖𝑖,𝑃𝑃𝑃𝑃𝑃𝑃𝑖𝑖𝑖𝑖) and per capita GDP (𝑃𝑃𝑃𝑃𝑃𝑃𝑃𝑃𝑃𝑃𝑖𝑖𝑖𝑖,𝑃𝑃𝑃𝑃𝑃𝑃𝑃𝑃𝑃𝑃𝑖𝑖𝑖𝑖) following
Hoshi and Kiyota (2019). In addition to these size variables, some unique characteristics that
would influence M&A decisions are added to the model. For example, for tax avoidance, M&A
decisions may be sensitive to the level of the corporate tax rate in both the origin and the target
cities. If firms make investment decisions to avoid taxes, there would be more M&As in cities
foreign-invested firms that are considered to generate the Marshallian externality is also likely to affect
inward M&As. If the knowledge-based capital required for business activities in the host city
is embodied in existing foreign-invested firms or foreign workers, it is expected that externality
from the agglomeration of foreign-invested firms or workers will result in a decrease in costs
for firms located in the agglomerated city owing to shared resources and knowledge. Therefore,
such benefits from agglomeration may act as a further incentive for subsequent firms to invest.
In the estimation, the corporate tax rates in both the origin and the target cities (𝑇𝑇𝑇𝑇𝑇𝑇𝑖𝑖𝑖𝑖,𝑇𝑇𝑇𝑇𝑇𝑇𝑖𝑖𝑖𝑖), and proxy variables indicate the agglomeration of foreign-invested firms in a target city (𝑀𝑀𝑃𝑃𝑃𝑃𝑖𝑖𝑖𝑖).
At the national level, the institutional barrier is likely to impede inward M&As, so the level of
restriction on foreign direct investment in the host country (𝑅𝑅𝑅𝑅𝑅𝑅𝑖𝑖𝑖𝑖) is also added to the model. The D𝑖𝑖𝑖𝑖𝑖𝑖 vector consists of a pair of time-variant and time-invariant characteristics as
follows:
D𝑖𝑖𝑖𝑖𝑖𝑖 = �𝐷𝐷𝐷𝐷𝐷𝐷𝐷𝐷𝑖𝑖𝑖𝑖,𝐶𝐶𝐶𝐶𝑅𝑅𝐷𝐷𝑖𝑖𝑖𝑖,𝐶𝐶𝐶𝐶𝑀𝑀𝐶𝐶𝐶𝐶𝑅𝑅𝑖𝑖𝑖𝑖,𝐿𝐿𝑀𝑀𝐿𝐿𝐿𝐿𝑖𝑖𝑖𝑖,𝐶𝐶𝐿𝐿𝐿𝐿𝐶𝐶𝑖𝑖𝑖𝑖,𝑆𝑆𝐷𝐷𝐷𝐷𝐷𝐷𝑆𝑆𝑆𝑆𝑖𝑖𝑖𝑖𝑖𝑖,𝑅𝑅𝑇𝑇𝑀𝑀𝑖𝑖𝑖𝑖𝑖𝑖� (2)
where 𝐷𝐷𝐷𝐷𝐷𝐷𝐷𝐷𝑖𝑖𝑖𝑖 is the geographical distance between origin city i and target city j. As
recommended by Heid et al. (2017), the gravity model of this study covers both intra-national
and cross-border flows. Therefore, the dependent variable includes M&As targeting their own
cross-7
border dummy 𝐶𝐶𝐶𝐶𝑅𝑅𝐷𝐷𝑖𝑖𝑖𝑖 is added to control the difference between intra-national and cross-border M&As. 𝐶𝐶𝐶𝐶𝑀𝑀𝐶𝐶𝐶𝐶𝑅𝑅𝑖𝑖𝑖𝑖, 𝐿𝐿𝑀𝑀𝐿𝐿𝐿𝐿𝑖𝑖𝑖𝑖, and 𝐶𝐶𝐿𝐿𝐿𝐿𝐶𝐶𝑖𝑖𝑖𝑖 are dummy variables that take the value 1
when origin city i and target city j share a common currency, a common language, and a colonial
relationship, respectively. These two variables are likely to be appropriate proxies for factors
that facilitate monitoring, as addressed by Head and Ries (2008). As a time-variant pair specific
factor, it is expected that impediments to an M&A between the two cities are mitigated by the
strengthening of the friendship and cooperation between the two cities. To uncover this factor,
this study investigates the existence of sister cities and friendship cooperation agreements
across the 44 cities and constructs a dummy variable 𝑆𝑆𝐷𝐷𝐷𝐷𝐷𝐷𝑆𝑆𝑆𝑆𝑖𝑖𝑖𝑖𝑖𝑖that takes the value 1 when an
agreement is in force. To take into account regional trade agreements (RTAs) at the national
level, a dummy variable 𝑅𝑅𝑇𝑇𝑀𝑀𝑖𝑖𝑖𝑖𝑖𝑖 takes the value 1 if a city pair belongs to the same RTA. As a
result, the empirical specification is as follows:
𝑀𝑀𝑀𝑀𝑖𝑖𝑖𝑖𝑖𝑖 = exp�𝛼𝛼1𝑃𝑃𝑃𝑃𝑃𝑃𝑖𝑖𝑖𝑖+𝛼𝛼2𝑃𝑃𝑃𝑃𝑃𝑃𝑃𝑃𝑃𝑃𝑖𝑖𝑖𝑖+𝛼𝛼3𝑇𝑇𝑇𝑇𝑇𝑇𝑖𝑖𝑖𝑖+𝛽𝛽1𝑃𝑃𝑃𝑃𝑃𝑃𝑖𝑖𝑖𝑖+𝛽𝛽2𝑃𝑃𝑃𝑃𝑃𝑃𝑃𝑃𝑃𝑃𝑖𝑖𝑖𝑖+
𝛽𝛽3𝑇𝑇𝑇𝑇𝑇𝑇𝑖𝑖𝑖𝑖+𝛽𝛽4𝑀𝑀𝑃𝑃𝑃𝑃𝑖𝑖𝑖𝑖+𝛽𝛽5𝑅𝑅𝑅𝑅𝑅𝑅𝑖𝑖𝑖𝑖+𝜃𝜃1ln𝐷𝐷𝐷𝐷𝐷𝐷𝐷𝐷𝑖𝑖𝑖𝑖 +𝜃𝜃2𝐶𝐶𝐶𝐶𝑅𝑅𝐷𝐷𝑖𝑖𝑖𝑖 +𝜃𝜃3𝑆𝑆𝐷𝐷𝐷𝐷𝐷𝐷𝑆𝑆𝑆𝑆𝑖𝑖𝑖𝑖𝑖𝑖+𝜃𝜃4𝐶𝐶𝐶𝐶𝑀𝑀𝐶𝐶𝐶𝐶𝑅𝑅𝑖𝑖𝑖𝑖 +
𝜃𝜃5𝐿𝐿𝑀𝑀𝐿𝐿𝐿𝐿𝑖𝑖𝑖𝑖 +𝜃𝜃6𝐶𝐶𝐿𝐿𝐿𝐿𝐶𝐶𝑖𝑖𝑖𝑖 +𝜃𝜃7𝑅𝑅𝑇𝑇𝑀𝑀𝑖𝑖𝑖𝑖𝑖𝑖�𝜀𝜀𝑖𝑖𝑖𝑖𝑖𝑖 (3)
The gravity model is estimated by the pseudo-Poisson maximum likelihood (PPML)
estimator is that it accounts for heteroskedasticity and allows zero M&A observations. Since
there remains a concern about omitted variable bias, a model that includes the origin city-year
fixed effects and target city-year fixed effects instead of the explicit time-varying city
characteristics is also employed. This specification is expressed as follows:
𝑀𝑀𝑀𝑀𝑖𝑖𝑖𝑖𝑖𝑖 = exp�λ𝑖𝑖𝑖𝑖′+π𝑖𝑖𝑖𝑖′+𝜃𝜃1ln𝐷𝐷𝐷𝐷𝐷𝐷𝐷𝐷𝑖𝑖𝑖𝑖 +𝜃𝜃2𝐶𝐶𝐶𝐶𝑅𝑅𝐷𝐷𝑖𝑖𝑖𝑖 +𝜃𝜃3𝐶𝐶𝐶𝐶𝑀𝑀𝐶𝐶𝐶𝐶𝑅𝑅+𝜃𝜃4𝐿𝐿𝑀𝑀𝐿𝐿𝐿𝐿𝑖𝑖𝑖𝑖+
𝜃𝜃5𝐶𝐶𝐿𝐿𝐿𝐿𝐶𝐶𝑖𝑖𝑖𝑖 +𝜃𝜃6𝑆𝑆𝐷𝐷𝐷𝐷𝐷𝐷𝑆𝑆𝑆𝑆𝑖𝑖𝑖𝑖𝑖𝑖+𝜃𝜃7𝑅𝑅𝑇𝑇𝑀𝑀𝑖𝑖𝑖𝑖𝑖𝑖+𝛾𝛾1𝐶𝐶𝐶𝐶𝑅𝑅𝐷𝐷𝑖𝑖𝑖𝑖 ×𝑀𝑀𝑃𝑃𝑃𝑃𝑖𝑖𝑖𝑖� 𝜀𝜀𝑖𝑖𝑖𝑖𝑖𝑖 (4)
where λ𝑖𝑖𝑖𝑖′ denotes the set of time-varying origin city-year fixed effects, and π𝑖𝑖𝑖𝑖′ indicates the set of time-varying target city-year fixed effects. The interaction term of the cross-border
dummy and city characteristics enables us to examine the possible differences in the effects of
city attributes on M&As between intra-national and cross-border, even when the model includes
both the city-year and target city-year fixed effects. In this study, cross terms for variables of
interest are introduced, and the effects of urban attributes are examined.
3. Data
This study uses inter-city M&A volumes data of 44 cities across 32 countries/regions obtained
from Zephyr, the database of M&A transactions provided by Bureau van Dijk (BvD). M&A
volume data are available for the years 2010–2017, including own-city M&As as well as other
9
average volumes per M&A deals and extensive margins by the number of M&A deals expressed
as, 𝑀𝑀𝑀𝑀𝑖𝑖𝑖𝑖𝑖𝑖 =𝐿𝐿𝑖𝑖𝑖𝑖𝑖𝑖×𝑀𝑀𝑀𝑀𝑖𝑖𝑖𝑖𝑖𝑖
𝑁𝑁𝑖𝑖𝑖𝑖𝑖𝑖 where 𝐿𝐿𝑖𝑖𝑖𝑖𝑖𝑖 is the number of M&A deals from city i to j. The gravity models specified in Eqs. (3) and (4) are estimated for both the intensive margins and extensive
margins as well as the volume.
City selection depends on the availability of data on the attributes of the city such as
population size, per capita GDP, and proxies for the agglomeration of foreign-invested firms.
The characteristics at the city level were collected from the Global Power City Index (GPCI)
Yearbook published by the Institute of Urban Strategies, The Mori Memorial Foundation, for
the period 2010–2017. The GPCI Yearbook collects a variety of statistics from the 44 cities to
evaluate and rank them.3 In addition to the basic gravity variables such as population size
(𝑃𝑃𝑃𝑃𝑃𝑃𝑖𝑖𝑖𝑖,𝑃𝑃𝑃𝑃𝑃𝑃𝑖𝑖𝑖𝑖) and per capita GDP (𝑃𝑃𝑃𝑃𝑃𝑃𝑃𝑃𝑃𝑃𝑖𝑖𝑖𝑖,𝑃𝑃𝑃𝑃𝑃𝑃𝑃𝑃𝑃𝑃𝑖𝑖𝑖𝑖), proxy variables of agglomeration in the
form of the level of corporate tax rates (𝑇𝑇𝑇𝑇𝑇𝑇𝑖𝑖𝑖𝑖,𝑇𝑇𝑇𝑇𝑇𝑇𝑖𝑖𝑖𝑖 ), the number of the world’s top 300 companies (𝑀𝑀𝑃𝑃𝑃𝑃_𝑅𝑅𝐷𝐷𝑆𝑆𝐹𝐹𝐷𝐷𝑖𝑖𝑖𝑖 ) and the number of foreign residents (𝑀𝑀𝑃𝑃𝑃𝑃_𝑅𝑅𝑃𝑃𝑆𝑆𝑆𝑆𝐷𝐷𝑃𝑃𝐹𝐹𝑆𝑆𝑆𝑆𝐷𝐷𝑖𝑖𝑖𝑖 ) were
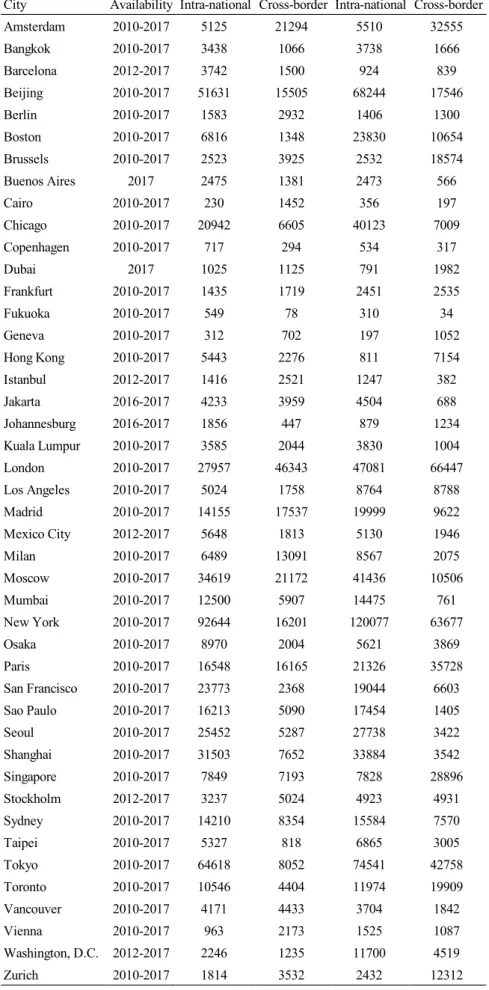
collected from the dataset. A list of the 44 cities is shown in Table 2, together with the average
volume of inward and outward M&A flows per year over the study period. The number of
sampled cities increased over time, from 35 in 2010–2011 to 40 in 2012–2015. Two more cities
were added in 2016 and 2017, respectively. Hence, the sample size of inter-city M&As for the
3 The three criteria for city selection (Institute of Urban Strategies, 2018)) are: 1. Top-ten cities in existing influential city rankings; 2. Major cities of countries found in the top ten of existing influential international competitiveness rankings; 3. Cities that do not meet the above criteria but were deemed appropriate for inclusion by the GPCI Executive Committee. However, some cities match one or more of the above criteria but are not evaluated in the GPCI as necessary data are not available.
8 years is (35×35×2) + (40×40×4) + (42×42) + (44×44) = 12,550 at the maximum. The annual
volume of M&As can be divided into intra-national and cross-border. In most of the sampled
cities, intra-national inward M&As are more dominant than cross-border inward M&As,
suggesting the existence of border effects. This observation is also consistent with the finding
of ‘home bias’ in an investigation by Mayer et al. (2010), which analyzes the determinants of
French firms’ choices of affiliate location.
[Insert Table 2 here]
The geographical distance between origin city i and target city j (𝐷𝐷𝐷𝐷𝐷𝐷𝐷𝐷𝑖𝑖𝑖𝑖) was obtained
from the world distance calculator website. The city-pair dummy variable indicating sister city
or friendship cooperation agreements (𝑆𝑆𝐷𝐷𝐷𝐷𝐷𝐷𝑆𝑆𝑆𝑆𝑖𝑖𝑖𝑖𝑖𝑖) was constructed by surveying the homepages
of each city on the internet. Regarding country-pair characteristics, following Head and Ries
(2008), this study employs directional dummy variables for colonial relationships to indicate
M&As to a former colony from its colonizer (𝑇𝑇𝑃𝑃𝐶𝐶𝐿𝐿𝐿𝐿𝐶𝐶𝑖𝑖𝑖𝑖 ) and M&As from a colony to its colonizer (𝑅𝑅𝑆𝑆𝑃𝑃𝐹𝐹𝐶𝐶𝐿𝐿𝐿𝐿𝐶𝐶𝑖𝑖𝑖𝑖 ). These are obtained from the Centre d’Etudes Prospectives et
d’Informations Internationales as well as other country-pair characteristics, including the
common currency dummy (𝐶𝐶𝐶𝐶𝑀𝑀𝐶𝐶𝐶𝐶𝑅𝑅𝑖𝑖𝑖𝑖 ), common language dummy (𝐿𝐿𝑀𝑀𝐿𝐿𝐿𝐿𝑖𝑖𝑖𝑖 ), and RTA dummy (𝑅𝑅𝑇𝑇𝑀𝑀𝑖𝑖𝑖𝑖𝑖𝑖 ). To consider the impact of country-level FDI regulation in the target city
11
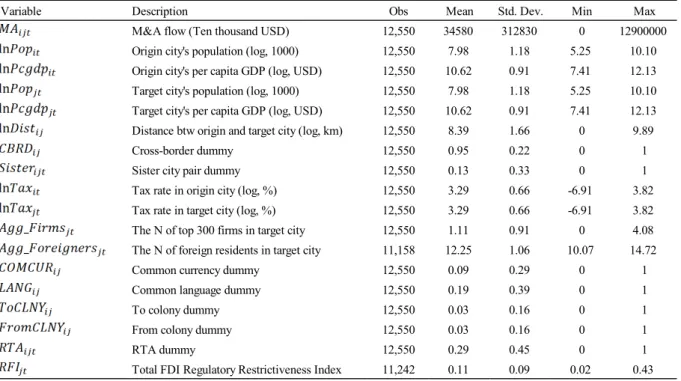
restrictions on FDI, was collected from the OECD. Table 3 shows the descriptive statistics of
the variables.
[Insert Table 3 here]
4. Estimation results 4.1 Base results
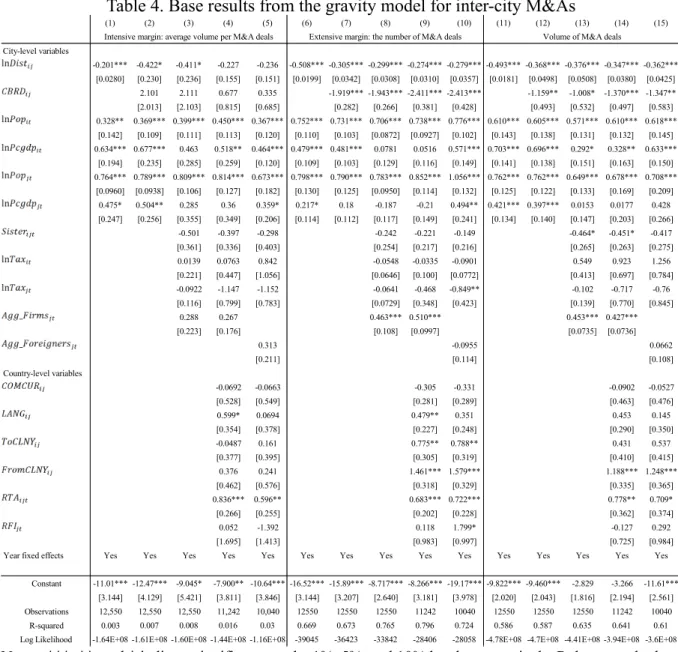
Table 4 shows the basic results from the pooling estimation for Eq. (3). The results show the
estimated coefficients from PPML and robust standard errors clustered at the city pair in
brackets to account for the correlation within a city pair. All estimations include year fixed
effects, although the results are suppressed. Columns (1)–(5) report the results for the intensive
margin measured as the average volume per M&A deals. Columns (6)–(10) show the results for
the extensive margin as the number of M&A deals, and columns (11)–(15) indicate the results
for the volume of M&A deals. As PPML is a non-linear model, the sum of the coefficients of
both margins is not equal to the coefficients for the volume. All the models include the market
sizes of both the origin and target city, and the distance between them. As shown in the results
of empirical studies on the bilateral gravity model, the economic sizes of both cities have a
positive impact on M&As between cities, while the geographical distance between the two
cities is, as expected, significantly and negatively associated with inter-city M&As. This result
is always consistent, even when considering other covariates.
Columns (2), (7), and (12) show the results of the model with the border dummy
variable that takes the value of 1 when the target city is located in a foreign country. As for the
volume of M&A deals in column (12), the coefficient of the border dummy is significantly
negative, indicating that cross-border M&As would be approximately one-third of
intra-national M&As (exp[−1.159]=0.314), holding other factors constant. This result is consistent with the results in Table 1, which show that, in most cities, the average volume of intra-national
M&As is significantly larger than that of cross-border M&As. As demonstrated by the gravity
model of trade, border effects are still noticeable even if the effects of distance are controlled.
In addition, the results from the decomposition of M&A volume into the intensive margin and
the extensive margin indicate that such a border effect is found only for the extensive margin.
The result in column (3) shows that other time-varying city and city pair characteristics
are not associated with inter-city M&As. The exception is 𝑀𝑀𝑃𝑃𝑃𝑃_𝑅𝑅𝐷𝐷𝑆𝑆𝐹𝐹𝐷𝐷𝑖𝑖𝑖𝑖 the number of the
world’s top 300 companies introduced into the model as a proxy for the agglomeration of
foreign-invested firms in the target city. The agglomeration has a statistically significant and
positive impact on the volume of M&A and mainly on the extensive margin, while the
coefficient of another measurement for agglomeration, i.e., that of foreign residents,
𝑀𝑀𝑃𝑃𝑃𝑃_𝑅𝑅𝑃𝑃𝑆𝑆𝑆𝑆𝐷𝐷𝑃𝑃𝐹𝐹𝑆𝑆𝑆𝑆𝐷𝐷𝑖𝑖𝑖𝑖 is not statistically significant.
Regarding corporate tax rates, since this study only covers major cities in the world,
13
insignificance of the tax rate in the target city may be due to the lack of variation in the sample.
As a city-pair attribute, this study examines the possible positive effect of twin/sister cities or
cooperation agreements on inter-city M&A volume. However, contrary to expectations, the
coefficient of the sister city dummy variable is not statistically significant. Originally, the
conclusion of sister city agreements may have been intended for cultural exchange rather than
strengthening economic ties, but in some cases, they mutually exchange investment promotion
delegates. The results of this study show that investment in two cities does not necessarily
accelerate even if the official connection between cities is strengthened; instead, investment is
increased in cities without such bureaucratic connections.
Columns (4)–(5), (9)–(10), and (14)–(15) show the results from the model where
country pair-level variables are added as well as city-level variables. Although the signs of the
common currency dummy and common language dummy are not statistically significant, those
of the colonial relationship dummy and RTA dummy, being intuitively plausible (only for the
volume and the extensive margin), are statistically significant and positive. Even if country-pair
level variables are introduced into the model, they do not change the significance of city-level
variables.
4.2 Alternative specification
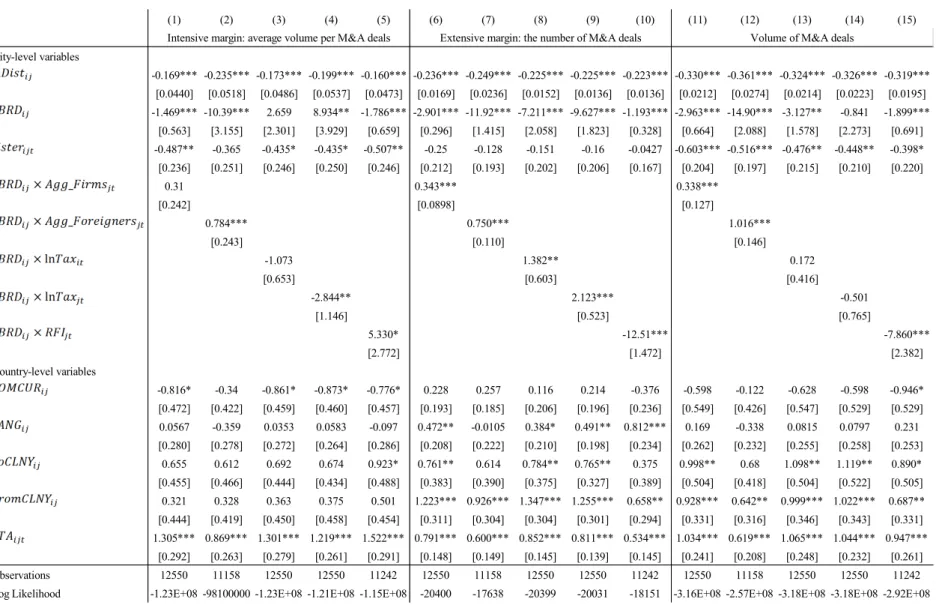
This study also examines the equation in which dummy variables for the city-year
results from the model with time-varying city fixed effects. Remarkably, the coefficient of the
border dummy variable is still significant at the 1% level, even after the time-varying city fixed
effects are introduced into the model. As shown in Eq. (4), introducing interacted terms of
time-varying city attributes and the border dummy leads to an alternative specification that examines
the heterogenous effect of city characteristics between intra-national and cross-border. Columns
(1), (6), and (11) in Table 5 show the results of the interaction between the border dummy and
the number of the world’s top 300 firms (𝐶𝐶𝐶𝐶𝑅𝑅𝐷𝐷𝑖𝑖𝑖𝑖 ×𝑀𝑀𝑃𝑃𝑃𝑃_𝑅𝑅𝐷𝐷𝑆𝑆𝐹𝐹𝐷𝐷𝑖𝑖𝑖𝑖), which are compatible with
the results in Table 4, showing a statistically significant positive effect on the extensive margin
and the volume. As an alternative measurement, the model with the interaction term of border
dummy and the number of foreign residents (𝐶𝐶𝐶𝐶𝑅𝑅𝐷𝐷𝑖𝑖𝑖𝑖×𝑀𝑀𝑃𝑃𝑃𝑃_𝑅𝑅𝑃𝑃𝑆𝑆𝑆𝑆𝐷𝐷𝑃𝑃𝐹𝐹𝑆𝑆𝑆𝑆𝐷𝐷𝑖𝑖𝑖𝑖) is also estimated,
and its coefficient turns out to be statistically significant and positive, as reported in columns
(2), (7), and (12). These results support the assertion that the concentration of foreign-invested
companies and foreign workers has the effect of further promoting subsequent cross-border
inward M&As. In addition to the variables of interest, the effects of other factors, such as tax
rates and regulations, were also examined. With respect to the tax impacts (𝐶𝐶𝐶𝐶𝑅𝑅𝐷𝐷𝑖𝑖𝑖𝑖 ×
ln𝑇𝑇𝑇𝑇𝑇𝑇𝑖𝑖𝑖𝑖,𝐶𝐶𝐶𝐶𝑅𝑅𝐷𝐷𝑖𝑖𝑖𝑖× ln𝑇𝑇𝑇𝑇𝑇𝑇𝑖𝑖𝑖𝑖) shown in columns (13) and (14), as for the volume, no statistically
significant impact is detected for both the origin and the target cities. In contrast, statistically
significant impacts are found for both intensive and extensive margins. Specifically, for the
15
column (8). This result is consistent with the observation that high tax rates induce outward
investment in tax avoidance. Regarding the tax rate in the target city, the sign of the coefficient
differs between the intensive margin and the extensive margin, as shown in columns (4) and (9).
The negative effect of tax rates in the target city consistent with expectations is observed for
intensive margins. A high tax rate in the target city has the effect of lowering average volumes
per M&A deals and increasing the number of deals, but does not affect the total volume. As
shown in column (15), country-level investment regulation (𝐶𝐶𝐶𝐶𝑅𝑅𝐷𝐷𝑖𝑖𝑖𝑖×𝑅𝑅𝑅𝑅𝑅𝑅𝑖𝑖𝑖𝑖 ), which is
measured by the total FDI RRI, is found to be negatively associated with inter-city M&As, and
the impact is concentrated in the extensive margin as shown in column (10). A higher RRI
reflecting foreign capital regulation at the country level is likely to inhibit M&A decisions. As
a robustness check, time-invariant city-pair fixed effects are introduced to the gravity equation.
The endogeneity can be eliminated by the fixed-effect model under the assumption that
unobserved city-pair specific effects are time-invariant. The results indicate that the main results
still hold, even after unobserved origin-target city-pair effects are controlled.
[Insert Table 5 here]
4.3 Goodness of fit for the gravity model by inter-city data
Unlike previous studies, this study succeeds in obtaining results consistent with the
conventional gravity model, even when using inter-city data. The fit of the gravity model is
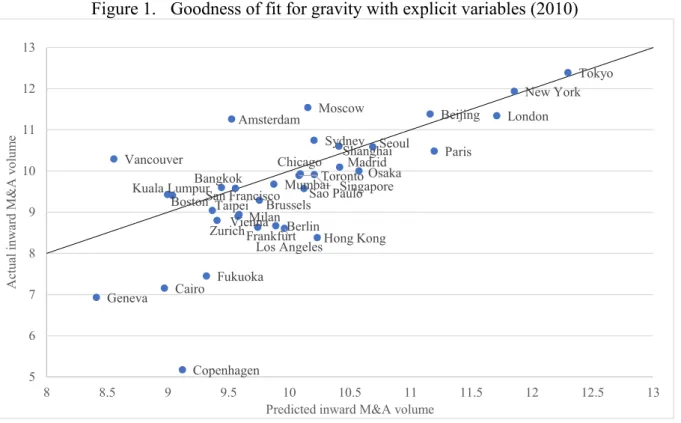
of fit using the estimation results. Figures 1 and 2 show the goodness of fit based on the results
from Eq. (3) (i.e., column 14 in Table 4) for 2010 and 2017. The vertical axis shows the average
value of the inward M&A volume of the target city, and the horizontal axis shows the predicted
value as a logarithmic value. A 45-degree line is also shown on the table, with the upper side
representing “outperform” and the lower side, “underperform.” Most of them tend to gather
around the 45-degree line, but some cities are scattered from there. Comparing 2010 and 2017,
it seems that 2017 is more likely to show dissipation, suggesting that the gap between winners
and losers is widening, but there are some cities in which inward M&A was successfully
increased during this period, perhaps because the policy to promote inward investment was
successful. For example, Geneva, Cairo, Fukuoka, and Copenhagen (especially Copenhagen)
moved down from the 45-degree line in 2010, but all of them except Fukuoka showed
significant improvement through 2017.
[Insert Figures 1 and 2 here]
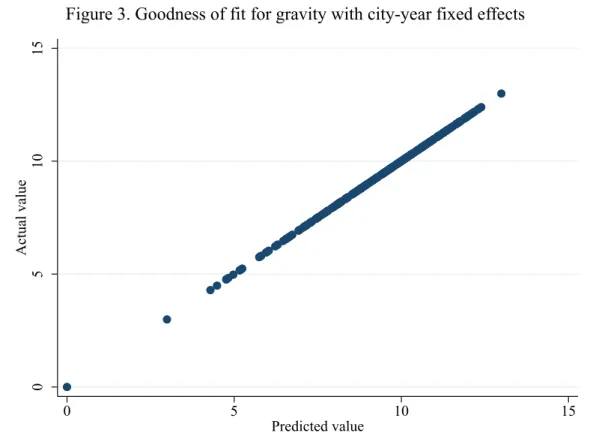
In addition to the results of considering the effects of explicit variables, the model that
also controls unobservable factors gives almost perfect predictions. Figure 3 shows the
relationship between the predicted value and the actual value based on the result obtained from
45-17
degree line. These results show that urban-level M&A flows can be estimated by the gravity
model, as has been shown in conventional gravity analyses by bilateral data.
5. Conclusion
With regard to the determinants of FDI, many previous studies relied on bilateral data to utilize
gravity models. Unlike the existing literature, this study uses disaggregated M&A data at the
city level for the years 2010–2017 to examine whether the gravity model can explain inter-city
M&As around the world. The empirical strategy builds on the framework of the gravity model
for bilateral FDI and empirically examines the effect of city-level attributes. The study focuses
on the role of the border effect and the agglomeration of foreign-invested firms.
The estimation results from the PPML reveal that the gravity model fits well for even
the inter-city data. Although the range of cities covered in the study is very limited, the evidence
that the gravity model is applicable even between cities reveals the untapped potential of gravity
models. The study also examines the border effect that differentiates intra-national and
cross-border M&As. The value of cross-cross-border M&As has nearly quadrupled in the last ten years
(UNCTAD, 2019) but the results of this study show that border effects are still substantial.
As for city attributes, this study sheds light on the role of the agglomeration of
foreign-invested firms in target cities in M&As across major cities. It is found that the agglomeration is
positively associated with the volume of inward M&As and mainly with the extensive margin.
workers agglomerated in the target cities will benefit subsequent investors. From the results, it
is concluded that the agglomeration of foreign firms or workers has a positive impact on inward
M&As. Policy debates have highlighted the importance of promoting inward investment to spur
economic growth. The results of this study show that the agglomeration of global firms has a
cyclical effect that leads to subsequent inward investment, suggesting that agglomeration
19
References
Bénassy-Quéré, A., Fontagné, L., Lahrèche-Révil, A., 2005. How does FDI react to corporate taxation? International Tax and Public Finance 12, 583–603.
Bergstrand, J.H., Egger, P., 2007. A knowledge-and-physical-capital model of international trade flows, foreign direct investment, and multinational enterprises. Journal of International Economics 73, 278–308.
Blonigen, B.A., Piger, J., 2014. Determinants of foreign direct investment. Canadian Journal of Economics 47, 775–812.
Brainard, S.L., 1997. An empirical assessment of the proximity-concentration trade-off between multinational sales and trade. American Economic Review 87, 520–544.
Duranton, G., Puga, D., 2004. Micro-foundations of urban agglomeration economies, Handbook of Regional and Urban Economics, in: Henderson, J.V., Thisse, J.F. (Eds.), Handbook of Regional and Urban Economics, 4. Elsevier, pp. 2063–2117.
Fujita, M., Thisse, J., 1996. Economics of agglomeration. Journal of the Japanese and International Economies 10, 339–378.
Head, K., Mayer, T., 2014. Gravity equations: Workhorse, toolkit, and cookbook, in: Gopinath, G., Helpman, E., Rogoff, K. (Eds.), Handbook of International Economics, 4. North-Holland, Amsterdam, pp. 131–195.
Head, K., Ries, J., 2008. FDI as an outcome of the market for corporate control: Theory and evidence. Journal of International Economics 74, 2–20.
Head, K., Ries, J., Swenson, D.B., 1995. Agglomeration benefits and location choice: Evidence from Japanese manufacturing investments in the United States. Journal of International Economics 38, 223–247.
Heid, B., Larch, M., Yotov, Y., 2017. Estimating the Effects of Non-Discriminatory Trade Policies Within Structural Gravity Models, School of Economics Working Paper Series 2017-10. LeBow College of Business, Drexel University.
Hoshi, T., Kiyota, K., 2019. Potential for inward foreign direct investment in Japan. Journal of the Japanese and International Economies 52, 32–52.
Hyun, HJ., Kim, HH., 2010. The determinants of cross‐border M&As: The role of institutions and financial development in the gravity model, The World Economy 33(2), 292–310. Institute of Urban Strategies, 2018. Global Power City Index 2018. The Mori Memorial
Foundation, Tokyo. http://mori-m-foundation.or.jp/wordpress/ius
Jones, J., 2017. Agglomeration economies and the location of foreign direct investment: A meta-analysis. Journal Regional Science 57, 731–757.
Jones, J., Serwicka, I., Wrena, C., 2018. Economic integration, border costs and FDI location: Evidence from the fifth European Union enlargement. International Review of Economics & Finance 54, 193–205.
Markusen, J.R., Maskus, K.E., 2002. Discriminating among alternative theories of the multinational enterprise. Review of International Economics 10, 694–707.
Mayer, T., Mejean, I., Nefussi, B., 2010. The location of domestic and foreign production affiliates by French multinational firms. Journal of Urban Economics 68, 115–128.
Portes, R., Rey, H., 2005. The determinants of cross-border equity flows. Journal of International Economics 65, 269–296.
Román, MS., V.M.-S., Bengoa, M., Sánchez-Robles, B., 2016. Foreign direct investment, trade integration and the home bias: Evidence from the European Union. Empirical Economics 50, 197–229.
Santos Silva, J.M.C., Tenreyro, S., 2006. The log of gravity. The Review of Economics and Statistics 88, 641–658.
21
Figure 1. Goodness of fit for gravity with explicit variables (2010)
Figure 2. Goodness of fit for gravity with explicit variables (2017)
Amsterdam Bangkok Beijing Berlin Boston Brussels Cairo Chicago Copenhagen Frankfurt Fukuoka Geneva Hong Kong Kuala Lumpur London Los Angeles Madrid Milan Moscow Mumbai New York Osaka Paris
San Francisco Sao Paulo Seoul Shanghai Singapore Sydney Taipei Tokyo Toronto Vancouver Vienna Zurich 5 6 7 8 9 10 11 12 13 8 8.5 9 9.5 10 10.5 11 11.5 12 12.5 13 A ctu al in w ar d M &A v o lu m e
Predicted inward M&A volume
Amsterdam Bangkok Barcelona Beijing Berlin Boston Brussels Buenos Aires Cairo Chicago Copenhagen Dubai Frankfurt Fukuoka
Geneva Hong Kong
Istanbul Jakarta Johannesburg Kuala Lumpur London Los Angeles Madrid Mexico City Milan Moscow Mumbai New York Osaka Paris San Francisco Sao Paulo Seoul Shanghai Singapore Stockholm Sydney Taipei Tokyo Toronto Vancouver Vienna Washington, D.C. Zurich 4 5 6 7 8 9 10 11 12 8 8.5 9 9.5 10 10.5 11 11.5 12 A ctu al M &A v o lu m e
Figure 3. Goodness of fit for gravity with city-year fixed effects
Table 1. Share of M&A volumes for top recipient cities in 2017
Source: Author’s computation based on the Zephyr database by BvD.
0 5 10 15 Actual value 0 5 10 15 Predicted value
Country Top 1% Top 5% Top 10%
China 66.5% 82.5% 88.8% France 55.6% 77.1% 88.6% Germany 25.4% 57.8% 72.6% Japan 60.8% 86.5% 92.9% UK 46.7% 68.1% 81.8% US 38.6% 75.0% 85.6%
23
Table 2. Sampled cities and the annual average volume of M&As (USD million)
City Availability Intra-national Cross-border Intra-national Cross-border
Amsterdam 2010-2017 5125 21294 5510 32555 Bangkok 2010-2017 3438 1066 3738 1666 Barcelona 2012-2017 3742 1500 924 839 Beijing 2010-2017 51631 15505 68244 17546 Berlin 2010-2017 1583 2932 1406 1300 Boston 2010-2017 6816 1348 23830 10654 Brussels 2010-2017 2523 3925 2532 18574 Buenos Aires 2017 2475 1381 2473 566 Cairo 2010-2017 230 1452 356 197 Chicago 2010-2017 20942 6605 40123 7009 Copenhagen 2010-2017 717 294 534 317 Dubai 2017 1025 1125 791 1982 Frankfurt 2010-2017 1435 1719 2451 2535 Fukuoka 2010-2017 549 78 310 34 Geneva 2010-2017 312 702 197 1052 Hong Kong 2010-2017 5443 2276 811 7154 Istanbul 2012-2017 1416 2521 1247 382 Jakarta 2016-2017 4233 3959 4504 688 Johannesburg 2016-2017 1856 447 879 1234 Kuala Lumpur 2010-2017 3585 2044 3830 1004 London 2010-2017 27957 46343 47081 66447 Los Angeles 2010-2017 5024 1758 8764 8788 Madrid 2010-2017 14155 17537 19999 9622 Mexico City 2012-2017 5648 1813 5130 1946 Milan 2010-2017 6489 13091 8567 2075 Moscow 2010-2017 34619 21172 41436 10506 Mumbai 2010-2017 12500 5907 14475 761 New York 2010-2017 92644 16201 120077 63677 Osaka 2010-2017 8970 2004 5621 3869 Paris 2010-2017 16548 16165 21326 35728 San Francisco 2010-2017 23773 2368 19044 6603 Sao Paulo 2010-2017 16213 5090 17454 1405 Seoul 2010-2017 25452 5287 27738 3422 Shanghai 2010-2017 31503 7652 33884 3542 Singapore 2010-2017 7849 7193 7828 28896 Stockholm 2012-2017 3237 5024 4923 4931 Sydney 2010-2017 14210 8354 15584 7570 Taipei 2010-2017 5327 818 6865 3005 Tokyo 2010-2017 64618 8052 74541 42758 Toronto 2010-2017 10546 4404 11974 19909 Vancouver 2010-2017 4171 4433 3704 1842 Vienna 2010-2017 963 2173 1525 1087 Washington, D.C. 2012-2017 2246 1235 11700 4519 Zurich 2010-2017 1814 3532 2432 12312
Table 3. Descriptive statistics
Variable Description Obs Mean Std. Dev. Min Max
M&A flow (Ten thousand USD) 12,550 34580 312830 0 12900000 Origin city's population (log, 1000) 12,550 7.98 1.18 5.25 10.10 Origin city's per capita GDP (log, USD) 12,550 10.62 0.91 7.41 12.13 Target city's population (log, 1000) 12,550 7.98 1.18 5.25 10.10 Target city's per capita GDP (log, USD) 12,550 10.62 0.91 7.41 12.13 Distance btw origin and target city (log, km) 12,550 8.39 1.66 0 9.89
Cross-border dummy 12,550 0.95 0.22 0 1
Sister city pair dummy 12,550 0.13 0.33 0 1
Tax rate in origin city (log, %) 12,550 3.29 0.66 -6.91 3.82 Tax rate in target city (log, %) 12,550 3.29 0.66 -6.91 3.82 The N of top 300 firms in target city 12,550 1.11 0.91 0 4.08 The N of foreign residents in target city 11,158 12.25 1.06 10.07 14.72
Common currency dummy 12,550 0.09 0.29 0 1
Common language dummy 12,550 0.19 0.39 0 1
To colony dummy 12,550 0.03 0.16 0 1
From colony dummy 12,550 0.03 0.16 0 1
RTA dummy 12,550 0.29 0.45 0 1
25
Table 4. Base results from the gravity model for inter-city M&As
Notes: ***, **, and * indicate significance at the 1%, 5%, and 10% levels, respectively. Robust standard errors clustered within city pairs are in brackets.
(1) (2) (3) (4) (5) (6) (7) (8) (9) (10) (11) (12) (13) (14) (15) City-level variables -0.201*** -0.422* -0.411* -0.227 -0.236 -0.508*** -0.305*** -0.299*** -0.274*** -0.279*** -0.493*** -0.368*** -0.376*** -0.347*** -0.362*** [0.0280] [0.230] [0.236] [0.155] [0.151] [0.0199] [0.0342] [0.0308] [0.0310] [0.0357] [0.0181] [0.0498] [0.0508] [0.0380] [0.0425] 2.101 2.111 0.677 0.335 -1.919*** -1.943*** -2.411*** -2.413*** -1.159** -1.008* -1.370*** -1.347** [2.013] [2.103] [0.815] [0.685] [0.282] [0.266] [0.381] [0.428] [0.493] [0.532] [0.497] [0.583] 0.328** 0.369*** 0.399*** 0.450*** 0.367*** 0.752*** 0.731*** 0.706*** 0.738*** 0.776*** 0.610*** 0.605*** 0.571*** 0.610*** 0.618*** [0.142] [0.109] [0.111] [0.113] [0.120] [0.110] [0.103] [0.0872] [0.0927] [0.102] [0.143] [0.138] [0.131] [0.132] [0.145] 0.634*** 0.677*** 0.463 0.518** 0.464*** 0.479*** 0.481*** 0.0781 0.0516 0.571*** 0.703*** 0.696*** 0.292* 0.328** 0.633*** [0.194] [0.235] [0.285] [0.259] [0.120] [0.109] [0.103] [0.129] [0.116] [0.149] [0.141] [0.138] [0.151] [0.163] [0.150] 0.764*** 0.789*** 0.809*** 0.814*** 0.673*** 0.798*** 0.790*** 0.783*** 0.852*** 1.056*** 0.762*** 0.762*** 0.649*** 0.678*** 0.708*** [0.0960] [0.0938] [0.106] [0.127] [0.182] [0.130] [0.125] [0.0950] [0.114] [0.132] [0.125] [0.122] [0.133] [0.169] [0.209] 0.475* 0.504** 0.285 0.36 0.359* 0.217* 0.18 -0.187 -0.21 0.494** 0.421*** 0.397*** 0.0153 0.0177 0.428 [0.247] [0.256] [0.355] [0.349] [0.206] [0.114] [0.112] [0.117] [0.149] [0.241] [0.134] [0.140] [0.147] [0.203] [0.266] -0.501 -0.397 -0.298 -0.242 -0.221 -0.149 -0.464* -0.451* -0.417 [0.361] [0.336] [0.403] [0.254] [0.217] [0.216] [0.265] [0.263] [0.275] 0.0139 0.0763 0.842 -0.0548 -0.0335 -0.0901 0.549 0.923 1.256 [0.221] [0.447] [1.056] [0.0646] [0.100] [0.0772] [0.413] [0.697] [0.784] -0.0922 -1.147 -1.152 -0.0641 -0.468 -0.849** -0.102 -0.717 -0.76 [0.116] [0.799] [0.783] [0.0729] [0.348] [0.423] [0.139] [0.770] [0.845] 0.288 0.267 0.463*** 0.510*** 0.453*** 0.427*** [0.223] [0.176] [0.108] [0.0997] [0.0735] [0.0736] 0.313 -0.0955 0.0662 [0.211] [0.114] [0.108] Country-level variables -0.0692 -0.0663 -0.305 -0.331 -0.0902 -0.0527 [0.528] [0.549] [0.281] [0.289] [0.463] [0.476] 0.599* 0.0694 0.479** 0.351 0.453 0.145 [0.354] [0.378] [0.227] [0.248] [0.290] [0.350] -0.0487 0.161 0.775** 0.788** 0.431 0.537 [0.377] [0.395] [0.305] [0.319] [0.410] [0.415] 0.376 0.241 1.461*** 1.579*** 1.188*** 1.248*** [0.462] [0.576] [0.318] [0.329] [0.335] [0.365] 0.836*** 0.596** 0.683*** 0.722*** 0.778** 0.709* [0.266] [0.255] [0.202] [0.228] [0.362] [0.374] 0.052 -1.392 0.118 1.799* -0.127 0.292 [1.695] [1.413] [0.983] [0.997] [0.725] [0.984] Year fixed effects Yes Yes Yes Yes Yes Yes Yes Yes Yes Yes Yes Yes Yes Yes Yes
Constant -11.01*** -12.47*** -9.045* -7.900** -10.64*** -16.52*** -15.89*** -8.717*** -8.266*** -19.17*** -9.822*** -9.460*** -2.829 -3.266 -11.61*** [3.144] [4.129] [5.421] [3.811] [3.846] [3.144] [3.207] [2.640] [3.181] [3.978] [2.020] [2.043] [1.816] [2.194] [2.561] Observations 12,550 12,550 12,550 11,242 10,040 12550 12550 12550 11242 10040 12550 12550 12550 11242 10040 R-squared 0.003 0.007 0.008 0.016 0.03 0.669 0.673 0.765 0.796 0.724 0.586 0.587 0.635 0.641 0.61 Log Likelihood -1.64E+08 -1.61E+08 -1.60E+08 -1.44E+08 -1.16E+08 -39045 -36423 -33842 -28406 -28058 -4.78E+08 -4.7E+08 -4.41E+08 -3.94E+08 -3.6E+08
Table 5. Results from the model with the time-varying origin and target city fixed effects
Notes: ***, **, and * indicate significance at the 1%, 5%, and 10% levels, respectively. Robust standard errors clustered within city pairs are in brackets. (1) (2) (3) (4) (5) (6) (7) (8) (9) (10) (11) (12) (13) (14) (15) City-level variables -0.169*** -0.235*** -0.173*** -0.199*** -0.160*** -0.236*** -0.249*** -0.225*** -0.225*** -0.223*** -0.330*** -0.361*** -0.324*** -0.326*** -0.319*** [0.0440] [0.0518] [0.0486] [0.0537] [0.0473] [0.0169] [0.0236] [0.0152] [0.0136] [0.0136] [0.0212] [0.0274] [0.0214] [0.0223] [0.0195] -1.469*** -10.39*** 2.659 8.934** -1.786*** -2.901*** -11.92*** -7.211*** -9.627*** -1.193*** -2.963*** -14.90*** -3.127** -0.841 -1.899*** [0.563] [3.155] [2.301] [3.929] [0.659] [0.296] [1.415] [2.058] [1.823] [0.328] [0.664] [2.088] [1.578] [2.273] [0.691] -0.487** -0.365 -0.435* -0.435* -0.507** -0.25 -0.128 -0.151 -0.16 -0.0427 -0.603*** -0.516*** -0.476** -0.448** -0.398* [0.236] [0.251] [0.246] [0.250] [0.246] [0.212] [0.193] [0.202] [0.206] [0.167] [0.204] [0.197] [0.215] [0.210] [0.220] 0.31 0.343*** 0.338*** [0.242] [0.0898] [0.127] 0.784*** 0.750*** 1.016*** [0.243] [0.110] [0.146] -1.073 1.382** 0.172 [0.653] [0.603] [0.416] -2.844** 2.123*** -0.501 [1.146] [0.523] [0.765] 5.330* -12.51*** -7.860*** [2.772] [1.472] [2.382] Country-level variables -0.816* -0.34 -0.861* -0.873* -0.776* 0.228 0.257 0.116 0.214 -0.376 -0.598 -0.122 -0.628 -0.598 -0.946* [0.472] [0.422] [0.459] [0.460] [0.457] [0.193] [0.185] [0.206] [0.196] [0.236] [0.549] [0.426] [0.547] [0.529] [0.529] 0.0567 -0.359 0.0353 0.0583 -0.097 0.472** -0.0105 0.384* 0.491** 0.812*** 0.169 -0.338 0.0815 0.0797 0.231 [0.280] [0.278] [0.272] [0.264] [0.286] [0.208] [0.222] [0.210] [0.198] [0.234] [0.262] [0.232] [0.255] [0.258] [0.253] 0.655 0.612 0.692 0.674 0.923* 0.761** 0.614 0.784** 0.765** 0.375 0.998** 0.68 1.098** 1.119** 0.890* [0.455] [0.466] [0.444] [0.434] [0.488] [0.383] [0.390] [0.375] [0.327] [0.389] [0.504] [0.418] [0.504] [0.522] [0.505] 0.321 0.328 0.363 0.375 0.501 1.223*** 0.926*** 1.347*** 1.255*** 0.658** 0.928*** 0.642** 0.999*** 1.022*** 0.687** [0.444] [0.419] [0.450] [0.458] [0.454] [0.311] [0.304] [0.304] [0.301] [0.294] [0.331] [0.316] [0.346] [0.343] [0.331] 1.305*** 0.869*** 1.301*** 1.219*** 1.522*** 0.791*** 0.600*** 0.852*** 0.811*** 0.534*** 1.034*** 0.619*** 1.065*** 1.044*** 0.947*** [0.292] [0.263] [0.279] [0.261] [0.291] [0.148] [0.149] [0.145] [0.139] [0.145] [0.241] [0.208] [0.248] [0.232] [0.261] Observations 12550 11158 12550 12550 11242 12550 11158 12550 12550 11242 12550 11158 12550 12550 11242 Log Likelihood -1.23E+08 -98100000 -1.23E+08 -1.21E+08 -1.15E+08 -20400 -17638 -20399 -20031 -18151 -3.16E+08 -2.57E+08 -3.18E+08 -3.18E+08 -2.92E+08