Image-based Condition Assessment for Concrete Bridge Inspection
Ram Sebak Adhikari
A Thesis
In The Department of Building, Civil, and Environmental Engineering
Presented in Partial Fulfillment of the Requirements for the Degree of Doctor of Philosophy at Concordia University
Montreal, Quebec, Canada
July 2014
CONCORDIA UNIVERSITY SCHOOL OF GRADUATE STUDIES This is to certify that the thesis prepared
By: Ram Sebak Adhikari
Entitled: Image-based Condition Assessment for Concrete Bridge Inspection
and submitted in partial fulfillment of the requirements for the degree of
DOCTOR OF PHILOSOPHY
complies with the regulations of the university and meets the accepted standards with respect to originality and quality.
Signed by the final examining committee:
Dr. W. Fang Xie Chair
Dr. Simaan M. AbouRizk External Examiner
Dr. Amin Hammad External to Program
Dr. Khaled E. Galal Examiner
Dr. Tarek Zayed Examiner
Dr. Osama Moselhi Thesis Supervisor
Dr. Ashutosh Bagchi Thesis Supervisor
Approved by
Chair of Department or Graduate Program Director
2014
Abstract
Image-based Condition Assessment for Concrete Bridge Inspection
Ram Sebak Adhikari, Ph.D. Concordia University, 2014
The following approaches are usually taken for the condition assessment and performance evaluation of civil infrastructure: visual inspection, structural response measurement due to loads, and sensing based inspection of bridge structures. This thesis concentrates on the last alternative using remote sensing for condition assessment of concrete bridge structures. Focusing on defect quantification problems for condition assessment of bridge structures, remote sensing techniques based on digital images provides superior result over conventional visual inspection-based methods. The aim of this thesis is to develop digital image-based condition assessment tools and techniques, which can be integrated with existing bridge management systems (BMSs) in order to enhance the reliability of current inspection practices.
The methodology of this research divides the entire task of bridge inspection into two modules. The first module develops quantification models based on the extent and severity of defects, and the second module develops a change detection model defined as change in element condition state over times. For defect quantification, three fundamental concrete defects such as cracks, spalling, and scaling have been considered. To illustrate the proposed methodology, digital images are acquired from laboratory experiments during the testing of reinforced concrete beams in flexure, and from field visits of bridges in Montreal,
Quebec using portable digital cameras. This research contributes in the development of crack quantification model based on the corresponding crack skeleton which takes consideration of crack tortuosity for retrieving of crack properties. The output of the crack quantification model is validated by capturing the crack properties using a crack scale. In addition, an automated model for estimating the condition rating and related computational algorithms for bridge inspection are developed using the guidelines of the Ontario Structure Inspection Manual. The developed algorithms for mapping of condition ratings are based on the supervised training of back propagation neural networks. Recognizing the importance of 3D visualization, which can mimic the on-site visual inspection, 3D visualization model is developed using ordinary digital images by manually projecting images on the 3D model of the bridge being inspected.
The second module proposes a novel approach for periodic detection of defects in concrete bridges based on a set of dimensionless metrics pertinent to spectral and fractal analyses of the captured images. The fractal analysis of digital images is described by fractal dimension (FD) using Box Counting algorithms. Similarly, the method of spectral analysis requires digital images to be translated from spatial domain to Fourier domain, and then finds one dimensional signatures to quantify change detection. The developed algorithm for change detection demonstrates superior results and eliminates the limitations of traditional approach of change detection based on image subtraction. The developed image-based models can either be applied as standalone condition assessment and rating applications or integrated with existing systems such as PONTIS ( a Bridge Management System in USA) in order to enhance the reliability of visualinspection.
Acknowledgements
It is impossible to teach someone until a favorable teaching environment is available to someone’s inner world where learning can happen automatically. Once a favorable learning cosmic space is available, it is sure that he/she will be near to experience success in no time. I heartily thank my supervisors: Dr. Osama Moselhi and Dr. Ashutosh Bagchi for helping me in catching up the abundant available cosmic energy where success is always going to flourish. I am indebted to my supervisors for such a precious gift in my life.
I thank for valuable comments and information about condition of bridges in Quebec provided by Mr. Adel Zaki, Chief Engineer (Roads and Bridges), SNC Lavalin Inc., and special thanks to Dr. Arash Rahmatian for providing me access to acquire digital images from flexural tests of reinforced concrete beams. I would also like to thank Concordia University in Montreal and Natural Sciences and Engineering Research Council of Canada (NSERC) for financial support during my research.
Special thanks to my parents: Sitaram and Lakho Devi, my wife: Mamata, and my son: Lance for helping me during my difficult times just saying a simple sentence “you can do it, and just do it”.
Table of Contents
Chapter 1: Introduction ... 1
1.1 Overview ...1
1.2 Limitations of Current Practices for Condition Assessment of Bridges ...2
1.3 Motivation ...4
1.4 Scope and Objectives ...5
1.5 Thesis Organization...7
Chapter 2: Literature Review ... 9
2.1 Introduction ...9
2.2 Remote Sensing ...11
2.2.1 Advanced Technologies ...11
2.2.2 Suitable Remote Sensing for Surface Defects Analysis...14
2.3 Current Practices in Automated Bridge Condition Assessment...21
2.3.1 Damage Evaluation ...22
2.3.2 Close Range Photogrammetry ...23
2.3.3 Digital images application for civil infrastructure ...24
2.3.4 Neural Networks Application for Civil Structures ...29
2.3.5 Automated crack detection using digital images...31
2.3.6 3D Defects Modeling to Assist Visual Inspection ...33
2.4 Automated Bridge Management Systems ...34
2.4.1 Bridge Management Systems ...34
2.4.3 Bridge Performance Indicators...45
2.5 Digital Image Processing ...48
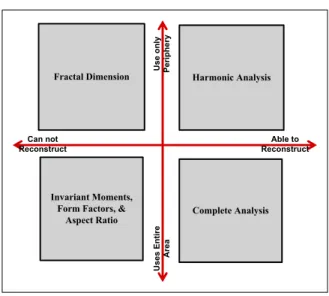
2.6 Measuring Shapes ...57
2.7 Summary ...60
Chapter 3: Proposed Methodology... 61
3.1 Introduction ...61
3.2 Proposed Methodology ...61
3.3 Field and Lab Data Collection ...64
3.4 Digital image Processing ...69
3.4.1 Pre-processing ... 69
3.4.2 Segmentation ... 72
3.4.3 Morphology ... 73
3.5 Data Processing and Condition Assessment ...74
3.5.1 Neural networks ... 74
3.5.2 Spectral and Fractal Analysis ... 76
3.6 Limitations ...79
Chapter 4: Concrete Crack Analysis using Digital Images ... 82
4.1 General ...82
4.2 Crack evaluation in Concrete Structures ...85
4.3 Proposed Method for Analysis of Cracks ...86
4.3.1 Imaging Criteria for Data Acquisition ...87
4.3.2 Image Stitching ...92
4.3.4 Skeletonization of cracks ...94
4.3.5 Crack Length and width ...95
4.3.6 Data Fitting for Crack Depth vs Crack Width...103
4.4 3D Visualization and Crack Density ...109
4.5 Discussion ...112
4.6 Summary ...114
Chapter 5: Image-based Automated Element Condition Rating ... 115
5.1 Introduction ...115
5.2 Proposed Framework...116
5.2.1 Feature Extraction ...119
5.2.2 Artificial Neural networks (ANN) ...123
5.3 Data Analysis and results ...125
5.3.1 Check for Normal Distribution ...126
5.3.2 BPNN Models ...127
5.3.3 Training and validating of the BPNN ...129
5.3.4 Comparison with other classifiers ...134
5.3.5 Element Condition Index ...137
5.4 Summary ...142
Chapter 6: A Study of Defect Propagation ... 144
6.1 General ...144
6.2 Periodic Detection of Defects ...145
6.3 Fractal Damage Characteristics ...145
6.4.1 The Fractal Analysis of digital images ...148
6.4.2 Computation of Fractal Dimension ... 149
6.5 Spectral Analysis ...155
6.6 Analysis and Results ...158
6.6.1 Analysis for isolated cracks...159
6.6.2 Analysis for crack patterns ...163
6.6.3 Comparison with manually segmented images ...170
6.6.4 Median Filter for Temporal Change Detection ...173
6.7 Summary ...175
Chapter 7: Conclusions and Future Work ... 177
7.1 Conclusions ...177
7.2 Contributions ...180
7.3 Limitations of the Current Research and Scope for Future Studies ...182
References ...187 Appendix A ... 208 Appendix B ... 209 Appendix C ... 213 Appendix D ... 216
List of Figures
Chapter 2
Figure 2.1: Electro-magnetic Spectrum relation with Energy and Wavelengths ... 12
Figure 2.2: Spatial Resolution Accuracy and Object Size (Luhmann et al. 2006) ... 14
Figure 2.4: The Important Bridge Defects (Norwegian graphic symbols) ... 17
Figure 2.5: (a) Spall area < 10 square inches (left); and > 100 square inches (right) ... 18
Figure 2.6: Successful technologies for Bridge Deck Analysis (Ahlborn et al., 2010) .... 21
Figure 2-7: Feature attributes of a defect (Moselhi and Shehab-Eldeen 2000) ... 30
Figure 2-8: Photo Visualization in the OBMS (Ontario-BMS, 2012) ... 38
Figure 2.9: A Well Composed Digital Images (Navy Bridge, 2008) ... 39
Figure 2.10: A Well Composed Digital Image showing the Underside of a Bridge ... 40
Figure 2.11: A Poorly Composed Digital Image, No scale for reference, location ... 41
Figure 2.12: Current Condition Rating Scale for Reinforced Concrete Decks... 42
Figure 2.13: (a) Condition States 2, (b) Condition States 3, and (c) Condition States 4 .. 44
Figure 2.14: (a) Condition States 2, (b) Condition States 3, and (c) Condition States 4 .. 44
Figure 2.15: Bridge Performance Framework ... 45
Figure 2.17: (a) A Mask for Point Detection ... 50
Figure 2.18: (a) A Mask for Line Detection a) Horizontal, b) + 45 Degrees ... 51
Figure 2.20: Sobel Edge Operators (Horizontal & Vertical) ... 52
Figure 2.21: Laplacian of Gaussian (LoG) Mask ... 53
Figure 2.22: Hough Transform a line AB to A Point “P” ... 55
Chapter 3
Figure 3.1: Research Methodology ... 62
Figure 3.2 : The structure of the proposed Framework ... 63
Figure 3.3: The location of Bridge Site for Field Demonstration ... 65
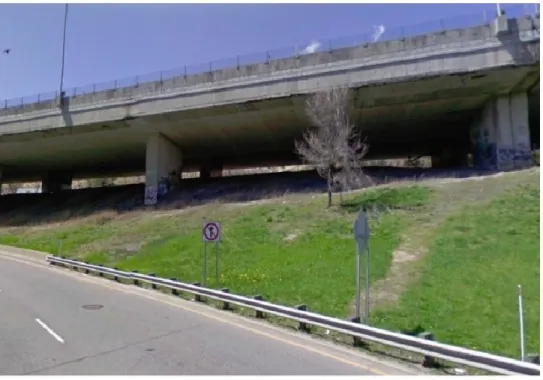
Figure 3.4: The Elevation of a Bridge Overpass... 66
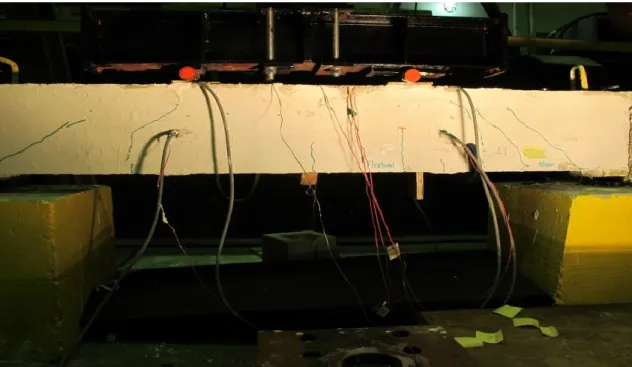
Figure 3.5: Images form Lab Observations ... 67
Figure 3.6: Cameras used in for Image Acquisition ... 68
Figure 3.7: Artificial Target in the image Frame ... 69
Figure 3.8: Image pre-processing techniques ... 70
Figure 3.9: Effect of perspective projection model (Solomon & Breckon, 2011) ... 71
Figure 3.10: Corrected Image form Perspective Error ... 71
Figure 3.11: Image Segmentation Algorithms (Gonzalez et al., 2009). ... 72
Figure 3.12: Combining Erosion and Dilation Processes . ... 74
Figure 3.13: Neural Network Model for Condition Assessment . ... 76
Figure 3. 14: Spectral Analysis of Digital Images (Adhikari et al. 2013a). ... 78
Figure 3. 15: Fractal Analysis of Digital Images (Adhikari et al. 2013d). ... 78
Chapter 4 Figure 4.1: Proposed Method for Analysis of Cracks………87
Figure 4.3: Projective Transform Work Flow... 91
Figure 4.4: Image after Projective Transformation (corrected Image) ... 91
Figure 4.5: Crack Detection Algorithm ... 94
Figure 4.7: Experimental setup for beam loading under fatigue loads ... 97
Figure 4.8: Use of Crack Scale for Width Measurement ... 99
Figure 4.9: Plot of Cumulative Crack Depth and width ... 102
Figure 4.10: Neural network Training Flow Chart ... 104
Figure 4.11: Data Fitting by Neural Networks ... 105
Figure 4.12: Error in Training, Validation, and Test Sets ... 105
Figure 4.13: Performance Evaluation of Trained Networks ... 107
Figure 4.14: Comparison with Boosted Decision Tree ... 107
Figure 4.15(c): 3D visualization, Front Face Crack Density = 0.0066 mm/mm2) ... 111
Chapter 5 Figure 5.1: The Proposed Methodology ... 117
Figure 5.3: Artificial Target ... 119
Figure 5. 4: Attributes Feature Extraction ... 120
Figure 5.5 (a): Scaling Defects region of Interest ... 121
Figure 5. 6: RGB profile with line width of 1 Unit ... 122
Figure5. 7: RGB profile with line width of 30 Units ... 122
Figure 5.8: Scaling Depth Estimation from RGB Profile ... 123
Figure 5.9: Forward and backward pass for Back Propagation Algorithm ... 125
Figure 5.10: Check for Normal Distribution of input parameters ... 126
Figure 5.11: BPNN Models ... 128
Figure 5.12: Neural Network Modeling Process ... 130
Figure 5.13: Prediction of Actual Depth Vs Model Output ... 133
Figure 5.15: Out of Bag algorithms (Feature Importance factors) ... 136
Figure 5.16: Fly over pass at the intersection of street Selby and Greene ... 137
Figure 5.17: (a) Detection of the spalled area, (b) defects identified as an object ... 139
Chapter 6 Figure 6.1: Proposed Change Detection Algorithm ... 148
Figure 6.2: Box Counting Work Flow Diagram ... 153
Figure 6.4: Spectral Change Detection ... 156
Figure 6.5: Fourier Transform of Digital Images at Time T1 ... 156
Figure 6.6: (a) Fourier Transform, Radial, and Angular Plot of Digital Images ... 157
Figure 6.8: Cracked Images at Different Loads ... 160
Figure 6-9: Estimation of Fractal Dimension ... 161
Figure 6.11: (a) Fractal images generated by Fractal Tree algorithms ... 165
Figure 6.12: Estimation of Fractal Dimension using Box Count Algorithms ... 165
Figure 6.13: Change Detection by Fractal Analysis of Concrete Surfaces... 166
Figure 6.14: Experimented at different resolutions (Resolution 3.591 pixels/mm) ... 167
Figure 6.15: Experiments results of Fractal Images for Fractal Dimension ... 168
List of Tables
Table 2.1: Satellites Spatial and Temporal Resolution (Roy, 2008)... 13
Table 2-2: Defects Types in Reinforced Concrete Structures (FHWA, 2006) ... 16
Table 2.3: Rating based Theoretical Sensitivity for Measurement Technologies ... 20
Table 2.5: Current Condition Rating Scale for Reinforced Concrete Decks ... 43
Table 2.6: Bridge Condition Index (Ontario Bridges, 2013) ... 48
Table 4-1: Evaluation of Crack Width and Depth ... 102
Table 4.2: ACI 224R-01, 2008 Permissible crack width ... 103
Table 4.3: OSIM (2008), Crack Classification for Reinforced Concrete Structures ... 103
Table 5.2: Neural Networks design criteria ... 130
Table 5.4: Contribution factors for Model (a) and Contribution factors for Model (b).. 131
Table 5.5: Comparison of results from different classifies ... 136
Table 5.6: Condition Assessment of a Deck Slab ... 140
Table 5.7: Evaluation of Bridge Condition Index ... 141
Table 6.1: Spectral and Fractal Analysis of digital images ... 164
Table 6.2: Change Detection based on Spectral Analysis and Fractal Analysis ... 169
Table 6.3: Change Analysis based on image registration ... 172
LIST OF ABBREVIATIONS
2D - Two Dimensional 3D - Three Dimensional
3DOBS - Three Dimensional Optical-evaluation Bridge System
AASHTO - American Association of State Highway and Transportation Officials ACI - American Concrete Institute
ASCE - American Society of Civil Engineers BIRM - Bridge Inspector's Reference Manual BVRCS - Bridge Viewer Remote Camera System DSS - Decision Support System
FEA - Finite Element Analysis FFT - Fast Fourier Transform
FHWA - Federal Highway Administration FOV - Field of View
GIS - Geographic Information System
GPR - Ground Penetrating Radio Detection and Ranging GPS - Global Positioning System
IR - Infrared
LASER - Light Amplification by Stimulated Emission of Radiation LiDAR - Light Detection and Ranging
LVDT - Linear Variable Differential Transformer MTO - Ontario Ministry of Transportation
NCHRP - National Cooperative Highway Research Program NDE - Non-destructive Evaluation
NDT - Non-destructive Testing SAR - Synthetic Aperture Radar SHM - Structural Health Monitoring Thermal IR - Thermal Infrared Imagery TIF - Tagged Image File
Chapter 1: Introduction
1.1 Overview
2013 report card published by American Society of Civil Engineers for America’s Infrastructures reveals that the average age of bridges in the USA (i.e. 607,380 ) is 42 years and about 11% of the bridges are rated as structurally deficient (ASCE 2013). Likewise, in Canada, more than 40% of the bridges currently in use were built over 50 years ago, and they are in need of immediate upgrade (Bisby and Briglio 2004). To maintain the condition of such infrastructure, there exist different inspection programs for monitoring the conditions of a structure during its life span. However, the importance of bridge inspection was not fully understood until the collapse of I-35 W Mississippi River Bridge which was built in 1964. According to the investigation report of the National Transportation Safety Board (NTSB, 2008), the Mississippi River Bridge on I-35 was inspected a year before the catastrophic failure of the deck truss at 6.05 p.m. on August 2007. As a result of the collapse, 1000 ft of the 1,907 ft long bridge fell to the water, 13 people lost their lives, 145 people injured, and 111 vehicles were involved in the accident. In further investigation, the inspection report showed that the bridge was rated 4 out of 9 resulting in the continuation of the bridge operation without any load restriction. The tragic accident of the Mississippi River Bridge revealed that the condition of such deficient bridges could have been worse than what bridge inspectors had reported in inspection report. Such accidents drew serious attention towards proper inspection guidance’s and technologies for accurately assessing the condition state of bridges for effective Bridge Management System (BMS) (National Transportation Safety Board, 2008).
In order to improve the effectiveness of a BMS, data collection and interpretation strategies need to be improved. In general, routine bridge inspection is carried out every two years to collect information on bridge conditions in the form of text, images, and drawings based on inspection manual guidelines (Navy Bridge Inspection Program, 2008). Routine inspections are generally carried out through visual inspection which is an arm’s length inspection of all portions of structures using some fundamental measuring methods and tools. However, the reliability of visual inspection regarding consistency and objectivity of inspected data has been questioned in literature (Moore et al. 2001).
1.2 Limitations of Current Practices for Condition Assessment of Bridges
Although several satellites such as (LANDSAT TM, SPOT4, IRS, and RADARSAT) are capable of identifying objects lying on the Earth surfaces, the defect detection and quantification of civil infrastructure are not possible due to the limitations of spatial resolution, temporal resolution, radiometric resolution, swath width, and spectral bands (Roy, 2008). The commonly used non-destructive techniques for condition evaluation of concrete decks are visual inspection, liquid penetrant dye, chain drag, Half-cell potential (HP), acoustic emission, ultrasonic pulse velocity, ground penetrating radar (GPR), impact echo (IE), and IR thermography (Yehia et al. 2007). However, these technologies are unable to provide the desirable accuracy in terms of extent and severity of defects required for effective BMS. To prove this point, a systematic study for the condition assessment of concrete bridge decks through experimental and field testing was conducted using several
remote sensing technologies listed above (Ahlborn et al. 2010). The study showed that the Bridge Viewer Remote Camera System (BVRCS) technique based on the close range 3D photogrammetry technique, and GigaPan Techniques based on Street View-style photography are the best technologies for defect measurement in concrete decks (Ahlborn et al., 2010).
Previously, Abudayyeh et al. (2004) proposed a framework for automated bridge imaging system based on digital image processing and integrated with Bridge Management Systems (BMSs) PONTIS. However, the assignment of condition rating for bridge elements was done manually by displaying the collected images on computer screens. The current version of PONTIS 5.1.2 allows multi picture uploading just by selecting all images stored in a folder (AASHTOWare Bridge, 2012). The approach provides great advantages over old version where pictures were uploaded one at a time. However, these images are not used for defect quantification purposes. They are just kept for references or visual comparisons.
The New Zealand Office of the Auditor General (2010) addressed the need for improved data collection in order to adopt the advanced bridge asset management system. Since the current practices of data collection is based on visual inspections, the approaches are not providing consistent or reliable information, and often they are not able to detect critical problems in bridge components (Bush et al. 2012). Therefore, there is a need for integration of non-destructive evaluation (NDT) techniques with the data collection needed for bridge management system. The validation of NDT program for defects assessments requires
developing a laboratory based specimens with embedded defects obtained from decommissioned bridges. Such approach will enhance the reliability of NDT program for further applications.
1.3 Motivation
Civil infrastructure, especially bridges, plays an important role for economic development of a country. The bridges not performing as per current code requirements can threaten human lives. Thus, regular maintenance and proper rehabilitation actions are necessary in order to maintain the functionality of bridges in preventing sudden failures. In spite of regular inspection of De La Concorde overpass in Quebec, on September 20 (2006), the bridge collapsed leaving five people killed and six people wounded (Vaysburd & Benoit, 2007). The investigation done by Vaysburd and Benoit (2007) showed that the inspection reports of de la Concorde were not consistent. There was a misinterpretation of abutment definition of de la Concorde Bridge. Until 1999, the bridge was defined as single span bridge, but from 1999, the bridge was started to be called a three span bridge taking into consideration of the cantilevers on both sides. In another report, it was admitted that bridge defects were rarely sketched; the location and extent of distresses were almost never reported, and that prevented the accurate evaluation of the bridge condition assessment over time (Commission of Inquiry 2007). The failure of the bridge underscored the importance of tracking of critical bridge element during bridge inspection.
The current practices of bridge inspections, which are based on visual inspections, are not reliable in terms or data consistency, and information reliability; and they are often unable to detect critical problems in structural components (Bush et al. 2012). The analysis of a critical element requires the tracking of progression of a particular defect over time so that necessary actions can be performed before any emergency situation. The advancement of information technologies and their application in civil engineering have made possible to acquire such information digitally in order to track the conditions of bridge elements, periodically (Brilakis et al. 2006).
Additionally, there exists several remote sensing technologies for accessing bridge defects; however, they do not provide reliable information such as the extent and severity of defects required for the effective application of BMS. This research presents a methodology based on digital image processing for condition assessment of the critical elements in a bridge, suitable for the application of BMS, as well as, a procedure for tracking of progression of defects in critical bridge elements.
1.4 Scope and Objectives
The condition assessment of bridge structural components encompasses diagnosis and monitoring of external and internal defects. This thesis considers only external defects with a focus on improving current practices for concrete bridge inspection, which is based on digital image analysis. The aim of this research is to develop tools and techniques in order
to enhance the reliability of visual inspection for effective performance of BMS using digital image processing.
In order to achieve the above main objective, the entire activities relating to condition assessment of concrete bridges have been categories into two parts: a) Defect Quantification Module, and b) Change Detection Module. For further development of these modules, this thesis considers three major categories of surface defects in reinforced concrete elements, which are: a) Spalling, b) Scaling, and c) Cracking. These defects including the crack map are to be captured by commercially available digital cameras, and processed for condition assessment of reinforced concrete beams/decks.
In order to fulfill the main objective, the following sub-objectives are identified.
1) Study the current practices, related literature, and limitations of remote sensing technologies for condition assessment of concrete bridges in order to support BMS. 2) Develop a methodology for condition assessment of concrete beams that accounts
for not only individual cracks, but also crack patterns.
3) Design a prototype software application for automated prediction of element condition rating based on identified concrete bridge scaling defects.
4) Develop an application for change detection in order to track progression of critical defects for improved condition assessment of bridge structures.
1.5 Thesis Organization
Chapter two presents a literature review on the current practices of condition assessment of bridge structures. The chapter starts with introduction followed by the application of remote sensing technology for civil infrastructure. Previously, the remote sensing application was limited for geometry measurement; however, due to current development of digital cameras, now it is possible to quantify defects in bridge structures in addition to capturing the geometries of bridge components. One of the sections of this chapter focus on digital image processing such as automated detection of lines, points, image pre-processing, and image segmentation. Also, the chapter discusses the importance of 3D visualization of bridge defects through the digital images which can mimic the on-site visualization of bridges.
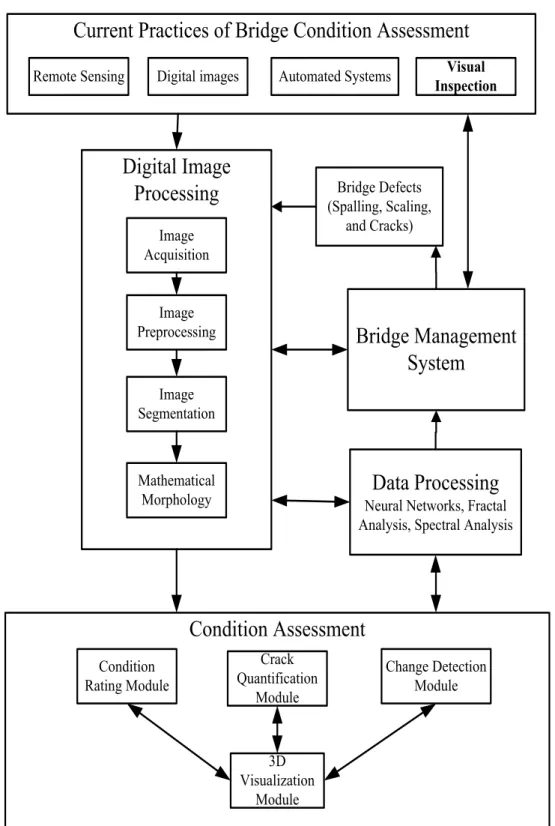
Chapter three presents the proposed methodology describing the main aspect of this research. In broad sense, the methodology consists of three main components: a) digital image processing, b) data processing, c) condition assessment modules. The condition assessment module is again sub-divided into three sub-modules which form the three next chapters as described here.
Chapter four, five and six develop procedures for crack quantification model, condition rating model, and change detection model for automated process of condition assessment of concrete bridges using digital images. For example, chapter four develops step by step process for crack detection and its length estimation based on crack skeleton itself. The
approach shows significant improvement over the previous approach of crack length estimation based on bounding box obtained by segmenting cracks. Also, the chapter presents a method to estimate crack density of a beam element, which is defined as total length of cracks over the total surface area, by developing 3D visualization models.
In chapter seven, the results of the present research are summarized, the main contributions are listed, and the recommendations for further research are presented.
Chapter 2: Literature Review
2.1 Introduction
The bridge infrastructure plays an important role for a country’s development. The social, economic, and political development of a country is largely dependent on the effective operation and management of the civil infrastructure. Bridges are one of the major components of highway infrastructure connecting people from different places economically and emotionally. However, in current scenarios, the condition of bridges in North America is rapidly degrading and it poses a major challenge in managing the effective distribution of financial packages for maintenance and rehabilitation of infrastructure (Hammad et al. 2007).
Since 40 years, in spite of technological development in North America, there has been insignificant improvement in routine bridge inspection. In general, routine bridge inspection is carried out in every two years through visual inspection which has been identified with several limitations. To overcome these limitations, there is an urgent need for developing methodologies to enhance the reliability of visual inspection without adding financial burdens to users for the effective management of civil infrastructure (Hammad et al. 2007). The American Society of Civil Engineers (ASCE) started to publish a Report Card in the beginning of 1988 to grade the nation’s infrastructure conditions. According to the latest report in 2012, about 11% of nation’s bridges (i.e. total bridges in USA 607,380) were classified as structurally deficient due to increased traffic, aging of construction
materials, and several environmental effects (ASCE Report 2013). Likewise, in Canada, more than 40% of bridges are older than 50 years (Bisby and Briglio 2004). Such bridges require immediate actions for condition evaluation to ascertain that they still meet the service requirements, and are safe for operations. In the past, several bridge management systems (BMSs) were developed for managing bridge structures such the Pontis bridge management system (PONTIS) developed by FHWA in 1989 (AASHTO, 2005) and later, the BRIDGIT bridge management system developed by the National Cooperative Highway Research Program (NCHRP) (Hawk, 1999). The input data source required for such BMSs are generally obtained through visual inspections which have been identified with several limitations such as they being time consuming, influenced by inspector’s experiences, and unreliability of element condition ratings (Gutkowski and Arenella, 1998; FHWA, 1995). The FHWA report in 2001 indicated that the condition rating assigned through visual inspection can vary significantly which raises questions on the reliability of visual inspection (Moore et al., 2001). The current BMSs require information on the defects in terms of their extent and severity in order to assign condition rating for the bridge elements. At this point, an accurate method of defect detection and quantification is essential for a reliable output from any automated trading systems such as PONTIS. Therefore, automated quantification of bridge defects using computer vision approaches needs to be explored further. Currently, a number of remote sensing techniques are available to evaluate the exterior or interior defects in bridge components. However, the major challenges are the cost and time. One of the promising approaches to enhance the reliability of visual inspection is through the use of digital image processing. Based on the processing of digital images, (Abudayyeh et al., 2004) developed an imaging data model for automated
condition assessment of concrete bridges. The model was integrated with an automated Bridge Management System (BMS), which was capable of generating automated inspection reports with the application of computers. However, in their approach, the assignment of condition rating for bridge elements was done manually by visualising images on computer screens by inspection experts. Thus, the literature review reveals that there is a need for the development of automated methodologies for predication of condition rating for bridge components. Such methodologies can be integrated with an automated bridge management system in order to enhance the current practices of visual inspections.
The next section presents the issues in current practices of routine bridge inspection with a focus on evaluating bridge condition rating and condition index associated with bridge components with multiple defects. Additionally, the chapter discusses the automation aspect of visual inspection through the application of digital image processing, and also the importance of shape descriptors for numerical representation of bridge defects. The chapter will also highlight the importance of 3D visualization of bridge defects through digital image processing in order to simulate on-site visual inspection through the use of modern technologies to assist in routine bridge inspection.
2.2 Remote Sensing
2.2.1 Advanced TechnologiesThe application of remote sensing in civil engineering can be defined as deriving information about the characteristics of civil infrastructure without being in contact with
them (Aronoff, 2005). The principle relies on reflectance signature of different surface materials over various portions of electromagnetic spectrum as shown in Figure 2.1 (NASA, 2013). Figure 2.1 clearly demonstrates that radio waves have larger wavelength with lower energy content, whereas gamma waves have shorter wavelength with higher energy content. Although, remote sensing can be carried out at any part of the light spectrum, the common form of light bands used in the management of civil infrastructure include visible and infrared light bands. The digital photography is limited to visible light bands occupying a small portion of the spectrum varying from 400 nanometers (nm) to 700 nm as shown in Figure 2.1.
Figure 2.1: Electro-magnetic Spectrum relation with Energy and Wavelengths
Although several satellites such as LANDSAT TM, SPOT4, IRS, and RADARSAT are capable of identifying objects lying on the Earth surface, the defect detection and
resolution, temporal resolution, radiometric resolution, swath width, and spectral bands (Roy, 2008). Table 2.1 displays the capabilities of four types of international satellites currently working the sky for gathering spatial and temporal information about the earth surfaces. The RADARSAT-1, a Canadian space satellite launched in November 4, 1995, is still active; however, the spatial resolution of digital images is just above 3 meters which are not sufficient for quantification of defects associated with civil infrastructure. The temporal resolution of the above mentioned four satellites varies from 16 days to 24 days which is sufficient enough to compare change detection for further recommendations after heavy flood or natural disasters.
Table 2.1: Satellites Spatial and Temporal Resolution (Roy, 2008)
System Altitude (KM) Bands Swath (KM) Spatial Resolution (m) Temporal Resolution (days) Scales LANDSAT 705 7 185 30 16 1:50,000 SPOT4 803 4 60 20 26 1:50,000 IRS 900 4 147 36 22 1:125,000 RADARSAT 798 1 < 500 >3 24 1:50,000
Apart from the satellite remote sensing, Aerial Photogrammetry which is also called passive sensors is very popular in civil engineering. The commonly used active sensors for the geometry measurement of civil infrastructural components are LIDAR (Light Detection and Ranging) and IFSAR (Interferometric Synthetic Aperture Radar). So, it is important to
select right sensors for a particular problem of interest because sensors selection is application dependent.
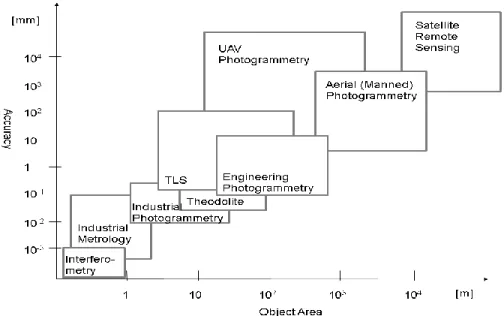
Figure 2.2 demonstrates the selection of different remote sensing technologies based on the required resolution and object sizes (Luhmann et al. 2006). Luhmann and others summarized that smaller objects required higher accuracy. The engineering photogrammetry yields accuracy in mm range for objects ranging from few meters to 100 meters.
Figure 2.2: Spatial Resolution Accuracy and Object Size (Luhmann et al. 2006)
2.2.2 Suitable Remote Sensing for Surface Defects Analysis
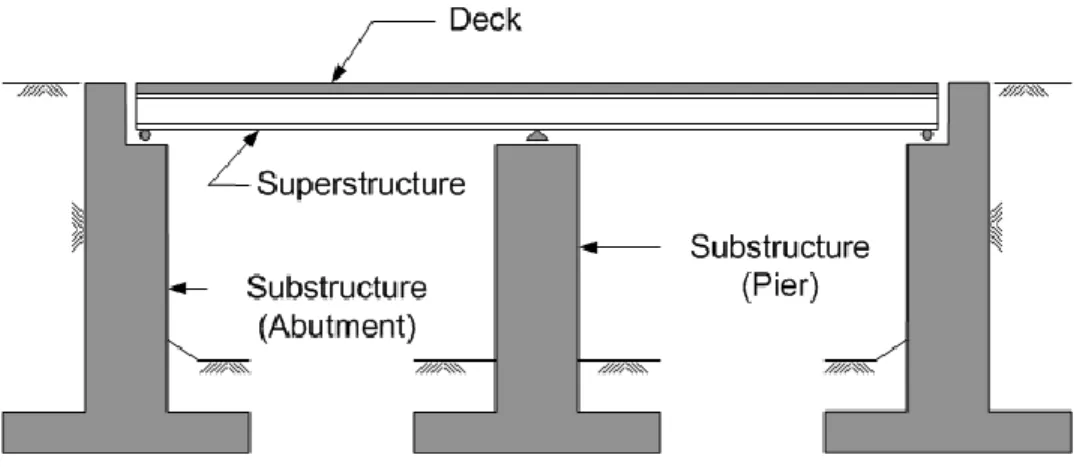
Although bridges are composed of variety of materials such as concrete, timber, and steel, the current thesis focuses on reinforced concrete Bridges. Most of bridge structures can be classified into three major components as shown in Figure 2.3.
Figure 2.3: Major Bridge Components (BRIM -1, 2012)
Out of the three major components of bridges (Decks, Piers, and Abutments), bridge decks are the most vulnerable part of any bridges. Because of direct contact with traffics, they are prone to wear and tear in comparison to structural bridge components (Ryall, 2003). Table 2.2 lists seventeen defects required to be studied for complete condition assessments of reinforced concrete structures; however, all the defects may not be present in a particular bridge component in question (FHWA, 2006). In general, the details of information necessary for condition assessment of bridge components are a) types of damages, b) location of damages, c) damage intensity, and d) damage extent (Bien, 1999).
Table 2-2: Types of defects in Reinforced Concrete Structures (FHWA, 2006) Material Type Defect Type Concrete
Cracking, Spalling, Scaling, delaminations, chloride contamination, efflorescence, formation,
honeycombs, pop-outs, wear, collision damage, abrasion, overload damage, reinforcing steel corrosion, prestressed concrete deterioration
The Norwegian graphic symbols list the important damage types necessary for condition assessment of bridge structures in Figure 2.4 (NCHRP SYNTESIS 375). The figure explores five major types of defects in concrete bridge structures. These defects are further classified into sub-classes according to their severity and impact on structural integrity of bridges.
Figure 2.4: The Important Bridge Defects (Norwegian graphic symbols)
The thesis considers only external defects which can be captured with digital images. For condition assessment of reinforced concrete beams/decks, the three types of defects considered in this thesis are: a) Spalling, b) Scaling, and c) Cracking or Crack Map. The typical Spalling, Scaling, and Cracking defects are shown in Figure 2.5.
Casting Joint
Delaminations, Spalling
Porous or Bad Quality Concrete
Cracks
< 2 Cracks > 0.2 mm, and < 2 mm
> 2 Cracks > 2 mm
Cracking
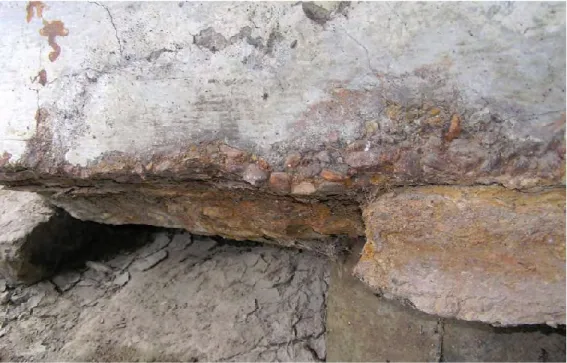
Figure 2.5: (a) Spall area < 10 square inches (left); and > 100 square inches (right) - (Project Scoping Manual, 2013)
Figure 2.5: (b) Crack Map on bridge deck surface (FHWA 2006)
Figure 2.5: (c) Concrete deck surface scaling (FHWA 2006)
For detection and quantification of bridge defects listed in Figure 2.4 needs a number of remote sensing technologies to be integrated for complete condition assessment of infrastructure. The commonly used non-destructive techniques for condition evaluation of
concrete decks are visual inspection, liquid penetrant dye, chain drag, Half-cell potential (HP), acoustic emission, ultrasonic pulse velocity, ground penetrating radar (GPR), impact echo (IE), and IR thermography (Yehia et al. 2007). For example, GPR, IE, and IR thermography were found promising techniques for detection of internal defects in concrete bridge decks (Yehia et al. 2007), while others could be suitable for surface defects. How these technologies can be helpful in enhancing the task of visual inspections are of great interest to researchers in managing civil infrastructure. A systematic study for the condition assessment of concrete bridge decks through experimental and field testing was conducted using Three Dimensional Optical Bridge Evaluation Techniques (3DOBS), Bridge Viewer Remote Camera System (BVRCS), GigaPan, LIDAR, Thermal IR, Digital Image Correlation (DIC), Ground Penetrating radar (GPR), Remote Acoustics, and high resolution Street View-style digital photography (Ahlborn et al. 2010). The study showed that 3DOB or BVCRS techniques based on the close range 3D photogrammetry technique and GigaPan techniques based on Street View-style photography are the best technologies for defect measurement for bridge inspections as illustrated in Table 2.3 (Ahlborn et al., 2010). An element receives the best score of 16 based on eight evaluation criteria from A to H which is rated to 0, 1, and 2 depending upon the condition of elements. The detailed information about rating of different techniques can be found in Appendix B.
The most successful technologies for bridge deck evaluation based on the field, as well as laboratory test verification have been listed in Figure 2.6 (Ahlborn et al., 2010). The rest of the sections discusses on the application of digital image processing for condition assessment of concrete bridge structures.
Table 2-3: Rating based Theoretical Sensitivity for Measurement Technologies (Ahlborn et al., 2010) L oca tio n C hallen ges In dicato r GPR Spec tr a 3D Ph oto gr aphy Satellite I m ag er y Op tical In ter fer om etr ic LiDAR Ther m al IR Aco us tics DI C R ad ar In SAR Stre etView Im ag es Dec k Su rf ac es Expansion Joint Cracks Within 2 ft 0 8 14 0 12 12 11 0 0 9 0 13 Spalls within 2ft 0 8 14 12 12 12 11 0 0 9 0 13 Map Cracking Surface Cracks 0 8 14 12 12 12 11 8 0 9 0 13 Scaling Depression in Surface 0 8 14 12 12 12 11 0 0 9 0 13 Spalling Depression with Fracture 0 8 14 12 12 12 11 0 0 9 0 13
3D optical bridge Evaluation system (3DOBS) Bridge Viewer Remote Camera System (BVRCS) GigaPan
Figure 2.6: Successful technologies for Bridge Deck Analysis (Ahlborn et al., 2010)
2.3 Current Practices in Automated Bridge Condition Assessment
The Navy Bridge Inspection Program Manual (2008) for bridge inspection lists seven types of bridge inspections required to document a bridge conditions over its useful life. They are 1) Initial Inspection, 2) Routine Inspection, 3) In-Depth Inspection, 4) Damage Inspection, 5) Fracture Critical Inspection, 6) Underwater Inspection, and 7) Interim Inspection. However, the discussion here is only focused on routine bridge inspection which has been defined as an arm’s length visual inspection of all parts of bridge structures using simple instruments supported by comments and photographs (Navy Bridge Inspection Program Manual, 2008). During routine inspections, it is necessary to assign the condition rating of all elements in accordance with FHWA guidelines (Recording, 1995). Although such method of assigning bridge condition rating is very popular, the
reliability of visual inspection has been questioned in literature (Moore et al., 2001). The reliable inspection information regarding to bridge elements are important for advance bridge management system.
2.3.1 Damage Evaluation
A damage inspection can be defined as an unplanned inspection i.e. not following any schedule to assess structural damages resulting from environmental factors or human actions (Ohio DOT, 2010). The purpose of this type of inspection is to determine the nature, severity, and extent of structural damages after any kinds of extreme events, traffic collisions/accidents to evaluate the safety requirement of structural members. Liu (2010) studied 69 collapsed bridges in the USA from 1967 to 2008. The result showed that more than 50% bridges were collapsed due to collisions, and natural disasters. These events trigger or initiate defect at an element level and progresses in due time during the service life of infrastructure. When these events will happen is unknown in advance, and therefore, it is difficult to establish a common inspection interval which can take care of impact on structural components resulted through such events. One way to tackle this problem is to revise the inspection frequency based on event-based management strategies. However, since bridge monitoring and inspection is expensive program, there is a need for developing automated tools using current technologies to assist routine bridge inspection. In the previous section, it has been discussed that the best way for concrete damage detection and quantification by using remote sensing technologies is the use of digital images (Ahlborn et al., 2010). Several researchers have worked on digital images for condition assessment
Abudayyeh et al. (2004) proposed a framework for automated bridge imaging system based on digital image processing and integrated with Bridge Management Systems (BMSs) PONTIS. Their models were capable of storing different surface defects in a structured way and generated automated inspection reports. However, the assignment of condition rating for bridge elements was done manually by displaying images on computer screens. To automate this process, a model for automated prediction of condition rating is required which can assign a unique number based on the severity and extent of defects. The approach requires training of expert functions for prediction of condition rating as an output based on selected input parameters.
2.3.2 Close Range Photogrammetry
Photogrammetry can be defined as measuring of geometry of physical objects from two-dimensional photographs. Depending upon how the digital images are acquired, the photogrammetry can be defined in two types: a) Aerial Photogrammetry and b) Terrestrial Photogrammetry (Gruen, 2000). Furthermore, the terrestrial photogrammetry is also called close-range photogrammetry when the object size and camera-to-object distance are both less than 100 meters (Jiang et al., 2008). Since the close-range photogrammetry has the ability to acquire detailed images of physical objects, it has been many applications in engineering (Fryer, 2000). In the development of automated bridge inspection tools, researchers have worked on ground-based remote sensing techniques for infrastructure monitoring using close range photogrammetry (Jiang et al., 2008). They presented a detailed literature review on the potential application of close-range photogrammetry in
bridge engineering. Their work briefly summarizes the basic development of ground-based remote sensing related to bridge deformation and geometry measurement, as well as structural health monitoring and documentation of historical infrastructure. Table 2-4 summarized work done from 1985 to 2003 based on the use of different types of cameras, target and control points application, and softwares covering the automated aspects of bridge inspection. Due to the rapid development in information technology in processing of digital images, the analysis of bridge defects such as cracks, spalling, and scaling is possible with reasonable accuracy which can be used to enhance the reliability of visual inspection. The next section will demonstrate the necessary steps required to analyze digital images to extract useful information.
2.3.3 Digital images application for civil infrastructure
As discussed in the previous section, Abudayyeh et al. (2004) proposed a framework for automated bridge imaging system based on digital image processing and integrated with Bridge Management Systems (BMSs) PONTIS. This was the first attempt to work with bridge defects by visualizing digital images on the computer screen.
The proposed methodology documented bridge defects digitally and automated reports were produced, however, the condition rating was assigned manually. The current thesis fulfills the gap by developing automated prediction of condition state rating based on digital image analysis. A considerable volume of literature has been published in the domain of construction industries using digital images to augment the effective infrastructure management systems.
Table 2-4: Application for Bridge Deformation and Geometry Measurements (Jiang 2008) R ese ar ch er Te st o bj ec t Ty pe o f mea su re me nt Ta rg et a nd ty pe o f ph ot og ra ph y C amer a use d N et w or k co nt ro l So ft w ar e use d B al es ( 19 85 ) R ei nf or ce d co nc re te de ck C ra ck le ng th an d w id th D if fu se ta rg et s, no n-fl ash ph ot og ra ph y Ze iss M K 10 /1 31 8, met ri c fi lm ca mer a (1 00 mm le ns) C on tr ol po in t s ur ve y St er eo sc op ic co m pa ra to r B al es an d H il to n (1 98 5) St ee l I – B ea m S te el gi rd er b ri dg e V er ti ca l de fl ec tio n K im (1 98 9) H ig hw ay B ri dg e Lo ng -t er m de fo rmat io n D if fu se ta rg et s, no n-fl ash ph ot og ra ph y M et ri c fi lm ca mer a (1 50 mm l en s) C on tr ol p oi nt su rv ey Se lf -d ev el op ed A bd el - Sa ye d et a l. (1 99 0) So il -st ee l B ri dg e G eo me tr y, de fo rmat io n R et ro -re fl ec tiv e ta rg et s, f la sh ph ot og ra ph y Le ic a fi lm ca mer a (2 4 mm le ns) Sc al e ba rs El co vi si on 1 0 C oo pe r an d R ob so n (1 99 0) St ee l b ri dg e D ef or ma tio n R et ro -re fl ec tiv e ta rg et s, f la sh ph ot og ra ph y Ze iss M K 10 /1 31 8 met ri c fi lm ca mer a (1 00 mm le ns) C on tr ol po in ts In te r ma p an al yt ic al co m pa ra to r Fo rn o et a l. (1 99 1) A rc h br id ge D ef or ma tio n R et ro - re fl ec tiv e ta rg et s, ph ot og ra ph y Ze iss M K -1 0 N met ri c ca mer a (2 .1 m le ns) C on tr ol po in ts M ic ro sc op e A lb er t e t a l. (2 00 2) R ei nf or ce d co nc re te b ea m C on cr et e ar ch br id ge V er ti ca l de fl ec tio n D if fu se ta rg et s, no n-fl ash ph ot og ra ph y K od ak D C S6 60 di gi ta l c amer a, mac hi ne v isi on ca mer a (2 4 mm le ns) D ist an ce mea su re me nt be tw ee n ta rg et s El lip se op er at or Le itc h (2 00 2) Jau re gu i e t a l. (2 00 3) St ee l b ea m P/ C gi rd er B ri dg e B ri dg e V er ti ca l de fl ec tio n D ef le ct io n Li ve lo ad de fl ec tio n D if fu se ta rg et s, no n-fl ash ph ot og ra ph y K od ak D C S6 60 di gi ta l ca mer a (2 8 mm le ns) C on tr ol p oi nt su rv ey Fo to G N or ri s (2 00 3) Jo hn so n (2 00 1 Su sp en si on B ri dg e G eo me tr y R et ro -r ef le ct iv e ta rg et s, f la sh ph ot og ra ph y Imet ri c an d K od ak D C S6 60 d ig ita l ca mer as C on tr ol p oi nt su rv ey Imet ri c
Digital photograph of construction sites provides the evidence of as-built project and the digital information can be used for effective infrastructure management which can assist a large number of construction inspection and management applications such as construction productivity and progress monitoring (Brilakis et al. 2006, Brilakis & Soibelman, 2008).
The above work was the first step in recognizing construction objects form images obtained from actual construction sites. They developed an automated recognition of construction materials (steel, concrete, or wood) using similarity-based criteria obtained from color or texture properties of material surfaces. They also added a content-based attribute (shape recognition) to recognize beam, columns, and wall related to construction activities.
These works are further studied by Zhu et al. (2010) and they proposed a novel method for detecting large-scale concrete columns for the purpose of developing an automated bridge condition assessment system. Since columns are large structural members, several images were taken and image stitching algorithm developed by Brown and Lowe (2007) was used to combine individual images into a single image. A neural-network based material classification method was reported in FANN (2009). Although above researchers worked for enhancing the effective bridge management systems, there were little attentions paid towards developing concrete defect models which could be an input to any BMS for concrete bridges. However, there has been a significant improvement in developing models for crack quantification.
Advantage and limitations of Google Street View Imaging
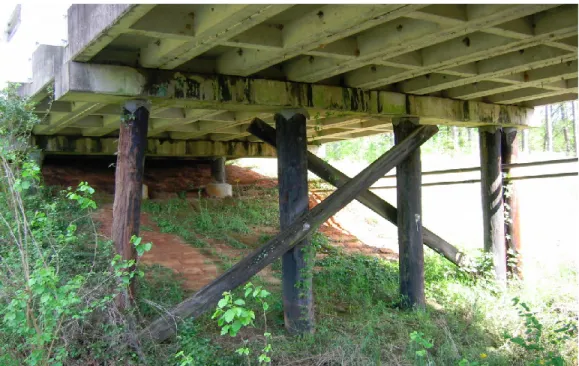
The Google Street view provides a continuous 360 degrees viewing environment for civil infrastructure. The technology is suitable for assessing the condition of an infrastructure by the inspectors from the offices without travelling to the site. Recently, Hinzen (2013) demonstrated the feasibility of damage detection and quantification based on Google Street View images. However, since the technology is based on vehicle-mounted instrumentation, this approach may not be suitable for condition assessment for elements at the underside of a bridge.
Since the imaging model is based on remote sensing technology, there is less disruption of traffic. By developing a technology which can be fixed with traffic moving at the same highway speed will maximize the benefit of such techniques. Although digital image-based analysis of condition assessment of infrastructure provides low capital cost, rapid deployment, and useful metrics (can compare condition over time, % area, volume, crack density, and roughness index), the slow speed of data collection (usually less than 5 mile per hour), traffic disruption, requires high resolution images, field of view, and data processing time are the challenges that need to be improved further (Ahlborn et al. 2010).
It is unlikely that fine cracks can be detected with the available resolution in the Google Street View; however, the detection accuracy of cracks can be increased using high resolution digital cameras. Currently, there are not enough guidelines available on the required resolution for detecting fine cracks. However, the resolution available in the Google Street view images is useful for condition evaluation of bridge deck surfaces
including spalling and scaling of bridge deck surfaces, mapping of cracks, joint damage, and delaminations expressed as surface damages (Ahlborn et al. 2010).
In order to improve the reliability of visual inspection, the developed methodology based on digital images needs to be integrated with existing bridge management system which is another challenge to be considered in developing an effective imaging model. In terms of cost, LiDAR scanners are very expensive for data acquisition and processing because they require digital cameras, scanners, positioning systems, computers, and related software tools. Similarly, the data collection by a digital camera is much cheaper than a GPR system (Ahlborn et al. 2010). Since each of the image-based technologies has its own advantages and disadvantages, a proper combination of such technologies is required to provide appropriate results.
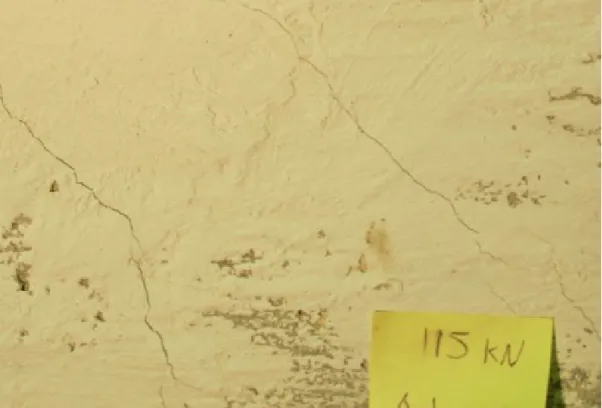
Often, the dimension of a surface defect captured by a digital image is measured in pixels. However, the defect measurement needs to be expressed in engineering units such as, feet or millimeters. Also the defect size is relative to the dimension of the image frame, and the actual size of the frame or the defect in physical/engineering units depends on many factors including image resolution, distance at which the image is taken etc. Several authors have used either artificial or natural scales of benchmark in the image frame for obtaining the actual dimension of a defect from a digital image (Adhikari et al. 2014, and Ahlborn et al. 2010). While working with digital images, the criteria need to be considered are: a) color images, b) the distance between camera and object which is called field of view shall be such that the minimum resolution on an image is 1 pixel per mm, c) lighting should be
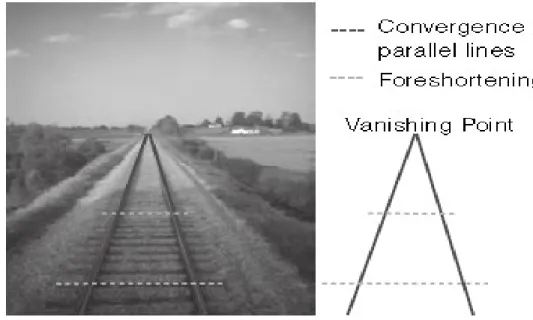
uniform to maintain images are consistent, and images shall be overlapped to ensure full coverage (McRobbie et al. 2008). Apart from the general conditions, they suggested that for defect evaluation, an image shall be acquired orthogonal to the plane on which a defect lie in order to improve accuracy of defect quantification by avoiding parallax and projection errors (McRobbie et al. 2008).
2.3.4 Neural Networks Application for Civil Structures
Neural Networks mimic the thought process of human brain by assigning weights to individual inputs attributes and output is mapped through a simple transfer functions (Liu, 2001). In the existing literature, neural networks (NN) have been reported to be used for several purposes for developing data fitting regression models as well as to solve classification problems where direct relations among input parameters do not exist (Moselhi and Shehab-Eldeen 2000, Bień and Rewiński, 1999). Neural Networks can be used as an intelligent system to assist bridge management systems for efficient operations as well as the maintenance schedule of structures. The systematic application of NN was listed in four categories for efficient bridge management systems (Bień, 2000). They are: 1) technical condition assessment processes, 2) maintenance technology selection processes, 3) real time data management systems, and 4) monitoring of structural parameters. However, the information required for training of NN was based on the result of visual inspection (Bień, 2000).
Over the past few decades, the application of NN was also very popular in automation of civil infrastructure management based on digital image processing. Neural networks were
used for automatic classification of defects in sewer pipe lines where digital images of sewer defects were used for extraction of geometric parameters required for training of neural networks (Moselhi and Shehab-Eldeen 2000). The accuracy of their prediction and classification of sewer defects was reported to be 98.2%. The geometric attributes used by them were area, perimeter, and major as well as minor axis lengths of defects as displayed in Figure 2.7.
Figure 2-7: Feature attributes of a defect (Moselhi and Shehab-Eldeen 2000)
Similarly, Khan et al. (2010) also used neural networks to analyze structural behavior of sewer pipes in terms of the variation of condition ratings, and the success rate of the developed model for the prediction of condition rating was reported to be 92.3%. However, the geometric attributes obtained for training of NN were obtained from visual inspection. Also, decision processes regarding to future conditions of an infrastructure depend on many
variables. Such uncertainties in the classification of defects in sewer pipes were discussed using neural-fuzzy networks (Sinha et al. 2003). One of the most relevant applications of neural networks was developed for predicting the fatigue life and failure of reinforcing bars in concrete elements. A recent paper written by Abdalla and Hawileh (2013) tested 15 specimens to measure fatigue failure of reinforcing bars and then neural networks were trained to predict failure patterns for the chosen samples.
2.3.5 Automated crack detection using digital images
In recent years, several automated crack detection algorithms have been proposed in the literature which can assist in condition assessment of reinforced concrete bridges. Abdel-Qader et al. (2003) compared the performance of crack edge detection against Fast Haar Transform (FHT), Fast Fourier Transform, Sobel, and Canny algorithms. It was concluded that FHT produced the best result over the other algorithms in detecting crack edge. Likewise, a Principal Component Analysis (PCA) was applied successfully for pattern recognition to determine whether a concrete surface was cracked or not, based on the Euclidean Distance as similarity criterion (Abdel-Qader et al. (2006). The crack analysis is necessary for automatic repair and maintenance of concrete surfaces. Haas et al. (1992) developed an automated field prototype crack sealing system which required fully automated crack detection, surface mapping, and control systems. In the digital imaging process, crack pixels need to be separated from their background. For segmentation of a crack from its background, a threshold is used for extracting the crack boundary pixels. The threshold can be estimated from mean and standard deviation of gray-level images (Cheng et al., 2003). However, this method does not ensure proper crack connectivity. To
solve this problem, the percolation-based image processing method was suggested to correctly detect cracks on concrete surfaces (Yamaguchi and Hashimoto, 2009). The result of this approach indicated that the percolation-based method is efficient even for larger-size concrete surfaces. In a later development, mathematical morphology was adopted in an image segmentation method where images were partitioned based on either similarity or discontinuity. Lyer and Sinha (Iyer and Sinha, 2006) adopted morphological filters with linear structuring elements for defect identification in sewer pipelines. Several types of concrete defects such as cracks, holes, joints, and collapsed surfaces were identified based on image processing and morphological segmentation approach which is necessary for automated classification of defects in sewer pipelines (Sinha, Fieguth, 2006). However, this approach was not suitable to discriminate all kinds of defects in sewer pipelines. Therefore, certain objects like joints and lateral displacements were classified by using the shape or texture features such as, roundness and compactness (Sinha, Fieguth, 2006).
The purpose of image processing is to extract the areas of interest from a given image frame. For example, the extraction of length and width of a crack is necessary for crack analysis of concrete members. So, proper definition of crack length and width needs to be stated explicitly. For practical purpose, average crack width is required to prepare a bid for repair and maintenance purposes. This could be possible by dividing a long crack into small crack segments and retrieving average length and width for each segment. In recent study, crack segmentation was achieved by searching of crack connectivity and matching the pixel orientations (Zhu et al., 2011). This approach needs input of at least one crack skeleton pixel to start searching of crack connectivity. Moreover, the length of a crack is
estimated from object-oriented bounding box which ignores the tortuosity of cracks (Zhu et al., 2011). The current thesis aims to fill the gaps by developing an automated crack quantification model using digital image processing.
2.3.6 3D Defects Modeling to Assist Visual Inspection
Many software systems have been developed for the design of structural components, however, little attention has been given to modeling defects in concrete elements based on defect parameters such as extent, severity and intensity of defects. The simplest way to obtain the geometry of defects is to collect the data of defect size, shape etc. by an inspector. But, such an approach is time consuming, costly, and prone to subjectivity. Therefore, modeling of defects from images for condition assessment of structural components provides an attractive alternative which can serve to augment the information obtained from visual inspection.
In order to overcome the limitations of visual inspection, several attempts have been proposed to automate the current bridge inspection process. One such attempt is to automatically retrieve the three dimensional (3D) as-built/as-is bridge information using remote sensing techniques. Although the 3D as-built/as-is bridge information is useful, the retrieval of such information is a challenging task (Remondino and El-Hakim, 2006). McRobbie et al. (2010) investigated several off-the-shelf 3D software tools, such as, MeshLab, Rhino, TrueSpace, and Phtosynth, and found that existing tools could not fully support the automatic retrieval of 3D as-built/as-is bridge information. A lot of manual editing and correction work are still required, which makes the overall information retrieval
process labor-intensive and time-consuming (Zhu, 2012). A photographic technique was demonstrated for 3D visualization of bridge components in quantitative assessment of bridge defects (Maksymowicz, 2011). However, the authors added an additional tool called “Damage Assessment Graphic Analysis — DAGA” for modeling defects from photographs. The above system was equipped with an advanced graphical editor enabled with fast creation of 3D models of bridge components and presentation of the results graphically. A quick 3D visualization model based on digital images and available software tools is required to assist the condition assessment process for concrete bridges.
However, one of the challenges still exists is how to reflect the current level of deterioration in the structure on a 3D model so that they could be reviewed on computer simulating the on-site visual inspection process. The thesis attempts to address this issue with the application of current available commercial software tools.
2.4 Automated Bridge Management Systems
2.4.1 Bridge Management SystemsA Bridge Management system (BMS) can be defined as an automated system for tracking the condition of bridges in a highway network which helps in prioritizing the task of maintenance and rehabilitation for better performance of infrastructure (Tonias and Zhao, 2007). A BMS is composed of several components consisting of bridge inventories, inspection reports, bridge deficiencies, financial evaluation, and management components (AASHTO, 2005). In USA, the importance of bridge safety through routine inspection and
maintenance regulation had not been realized until the collapse of Silver Bridge at Point Pleasant, West Virginia where 46 people were killed in 1967 (Lichtenstein, 1993). In 1971, the minimum standard required for bridge inspection was set up by the National Bridge Inspection Standards (NBIS) consisting of Bridge Inspector’s Training Manual by the Federal Highway Administration (FHWA), Manual for Maintenance Inspection of Bridges by the American Association of State Highway Officials (AASHO), as well as the FHWA’s Recording and Coding Guide for the Structure Inventory and Appraisal of the Nation’s Bridges (Liu, 2010). The development of BMS goes back to 1991, when the Intermodal Surface Transportation Efficiency Act (ISTEA) of USA mandated the requirement for the use of Bridge Management Systems by each state Department of Transportation (DOT). Soon, a rigorous BMS software package, Pontis, was developed and implemented in several states for effective bridge asset management (Gutkowski & Arenella, 1998). Today, more than 44 states are licensed with Pontis BMS. However, the level of implementation of a BMS varies from state to state (AASTHO, 2009). The literature revealed that the application of a BMS is different from not only from one country to another, but also from one state to another state. Several BMSs are listed here adopted in different countries, for examples, BRIME BMS is used in Europe (Woodward et al. 2001), Finland uses Finnish-BMS (Soderqvist 2004), Denmark uses DANBRO (Bjerrum and Jensen 2006), Taiwan uses T-BMS (Liao et al. 2008), and Argentinean-BMS is used by Argentina (Ruiz et al. 2008).
In spite of the fact that a majority of the states have used BMSs for managing infrastructure, less than 50% of the states consider BMSs recommendations for selecting bridge projects
because of skepticism of the simulation modeling, and resource limitations (Bektas, 2011). For effective application of BMS, a robust data management system is required. Inspection data required for BMS, in general, is collected through visual inspection. The first inspection, also called initial inspection, is necessary immediately after bridges are opened for traffic so that a baseline inspection target can be defined to compare the condition of bridge components over the service life of structures (Moore et al., 2000). As discussed in the previous section, visual inspection suffers from several limitations, and the application of advance information technology can enhance the reliability of BMS output. The current thesis adopts digital image processing application in enhancing the task of assigning condition rating for bridge elements. The next paragraph discusses the BMSs adopted by Canadian provinces.
Canadian provinces have developed different BMSs to suite their individual needs; for example, Alberta uses Transportation Infrastructure Management System (TIMS), Ontario uses Ontario-BMS, and Quebec has Quebec-BMS (Hammad et al., 2007). The Ministry of Transportation of Ontario (MTO) developed the Ontario Bridge Management System (OBMS) to store inventory and inspection data which can be processed for decision making purpose to identify the need of immediate repair, maintenance, and rehabilitation for bridges. The newly developed BMS in Ontario works at the network-level, as well as, at the project-level (Thompson and Ellis, 2000). The OBMS, which was first implemented in 1999, consists of five structural data records: Inventory, Elements, Inspections, Work History and Documents (Ontario-BMS, 2012). The regular inspection module of OBMS consists of Biennial Detail Tab and Recommendation Tab. The Biennial Details record the