DEPARTMENT OF ECONOMICS
UNIVERSITY OF CRETE
BE.NE.TeC.
W
orking
P
aper
S
eries
W
orking
P
aper:
2005-13
D
ownstream
R
esearch
J
oint
V
enture
with
U
pstream
M
arket
P
ower
Constantine Manasakis, Emmanuel Petrakis
Business Economics & NEw T
e
Chnologies Laboratory
Downstream Research Joint Venture with
Upstream Market Power
Constantine Manasakis, Emmanuel Petrakis
∗Department of Economics, University of Crete,
University Campus at Gallos, Rethymnon 74 100, Greece
September 2005
Abstract
In this paper, we examine how the structure of an imperfectly com-petitive input market affects final-good producers’ incentives to form a Research Joint Venture (RJV), in a differentiated duopoly where R&D in-vestments exhibit spillovers. Although a RJV is always profitable, down-stream firms’ incentives for R&D cooperation are non-monotone in the structure of the input market, with incentives being stronger under a mo-nopolistic input supplier, whenever spillovers are low. In contrast to the hold-up argument, we alsofind that under non-cooperative R&D invest-ments and weak free-riding,final-good producers invest more when facing a monopolistic input supplier, compared with investments under compet-ing vertical chains. Integrated innovation and competition policies are also discussed.
JEL classification: L13; O31
Keywords: Oligopoly; Process Innovations, Research Joint Ventures
∗E-mail addresses: manasakis@stud.soc.uoc.gr (Manasakis), petrakis@econ.soc.uoc.gr
(Pe-trakis). Manasakis wishes to thank participants at the Second CEPR School on Applied Industrial Organization, Munich, May 2005, for helpful comments and suggestions. Finan-cial support from the European Commission through the Marie Curie Actions of its Sixth Framework Programme (MSCF-2004-013342) is gratefully acknowledged.
1
Introduction
The critical role of innovation on the competitiveness offirms, industries and national economies has by far been established by academics and recognized by policy-makers. However, Research and Development (R&D hereafter) ac-tivities generate knowledge spillovers that may lead to free-riding and underin-vestment.1 In order to overcome these weaknesses, policy-makers and business
practitioners moved towards new organizational forms of R&D investments. As Vonortas (1997) notes, Research Joint Ventures (RJV hereafter) were regarded as “the cure for a number of failures in innovation markets” as far as knowl-edge spillovers are internalized and thus incentives for R&D investments are restored.2
The economic literature in the field of RJVs has mainly been inspired by the seminal papers of d’ Aspremont and Jacquemin (1988) and Kamien et al. (1992) that have been generalized and extended towards several directions.3
Caloghirou Ioannides and Vonortas (2003), surveying a great volume of available theory and empirical evidence, conclude on some robust incentives forfirms to participate in RJVs: Internalizing R&D spillovers, sharing the cost and avoiding the duplication of R&D activities, having access to complementary resources and skills, exploiting economies of scale and scope, distributing the investment risk to more investors, creating new investment options and promoting technical standards are strong incentives that lead to R&D cooperation.4
1D’ Aspremont and Jacquemin (1988) mention that “R&D externalities or spillovers imply
that some benefits of eachfirm’s R&Dflow without compensation to otherfirms and this may cause free-riding behavior and underinvestment problems”.
2Recent papers establish the growing trend of RJVs. Caloghirou Ioannides and
Vonor-tas (2003), exploring the existing databases (MERIT-CATI, NCRA-RJV, CORE, STEP TO RJV), demonstrate that the number of the new world-wide partnerships set up annually in-creased from about 30-40 in the early seventies to 100-200 in the late seventies. Starting from around 200 per year, the number of new partnerships announced every year reached around 600 or more in the eighties and nineties. Most partnerships are established between multina-tionalfirms from OECD countries and high-tech industries. Hagedoorn and van Kranenburg (2003), exploring the MERIT-CATI databank for the period 1960-1998, confirm a growth pattern in RJVs. Focusing on the EU case, Benfratello and Sembenelli (2002) mention that 1031 RJVs were sponsored under the EUREKA project over the 1985-1996 period and 3874 RJVs werefinanced under the 3rd and 4th Framework Programs for Science and Technology (FPST) over the 1992-1996 period.
3The papers of Suzumura (1992), Ziss (1994), Poyago-Theotoky (1995), Salant and Shaffer
(1998) and Katsoulacos and Ulph (1998) have contributed much in the literature. More recent contributions contain the papers of Yi and Shin (2000), Cabral (2002), Miyagiwa and Ohno (2002), Lambertini et al. (2002) and Amir et al. (2003).
4The empirical literature for RJVs is growing too. Cassiman and Veugelers (2002),
us-ing data from the Community Innovation Survey for the Belgian manufacturus-ing industry in 1993,find that although cost-sharing is an important incentive for cooperation, risk-sharing is not. They alsofind that the probability of cooperation increases in the size of thefirms and when incoming spillovers are high while outgoing spillovers are low. Benfratello and Sembenelli (2002),find thatfirms participating in the EUREKA program over the 1985—1996 period have experienced a significant improvement in their “adjusted” performance measures between the “pre” and the “post” period. Labor productivity and price cost margins for participating
firms show a lower than average in the pre-period but a higher than average performance in the post-period. Hernan et al. (2003), find that the probability of forming a RJV, under
Although the research on RJVs is growing, formal models have focused on horizontal settings, assuming that thefirms that form a RJV buy their inputs from perfectly competitive input markets. The purpose of this paper is to in-vestigate the effects of an imperfectly competitive input market where input suppliers do have market power and extract rents. Regarding a two-tier mar-ket structure, where downstreamfirms, that undertake R&D investments, buy inputs from input suppliers that capture mark-up rents, issues from the “hold-up” literature have to be taken into account.5 In this setting, cost-reducing
innovations by downstream firms increase the demand for the final good and subsequently, the demand for the inputs sold by suppliers also increases. Thus, suppliers increase the price that they charge and the stronger the suppliers’ mar-ket power, the higher the rents that they capture and the lower the downstream
firms’ profits and returns on R&D investments. Downstreamfirms know this ex ante and as a result they invest low amounts in R&D.
In this vertical framework, we address the following questions: Firstly, “how does the structure of the input market affect downstreams’ incentives to form a RJV?” and secondly, “how does the coexistence of R&D spillovers and suppliers’ rent-extracting affect downstreams’ amounts invested in case of non-cooperative and cooperative R&D investments?”
In order to answer these questions, we consider a two-tier market structure consisting of two downstreamfirms - final-good producers while the upstream industry can be either duopolistic or monopolistic. For the duopolistic case, we follow thecompeting vertical chains regime, where each downstreamfirm has an exclusive relationship with one of the two upstreamfirms. In the monopolistic case, there is acommon input supplierfor both downstreamfirms. Downstream
firms, endowed with symmetric technologies, produce a differentiatedfinal-good and invest in R&D for cost-reducing process innovations. Firms may invest either non-cooperatively, or by forming a RJV, while R&D activities exhibit spillovers.
The present paper contributes to the literature in several ways. First of all, it is found that downstreamfirms’ incentives to form a RJV are non-monotone in the structure of the input market. Although a RJV is always profit-enhancing
the EUREKA and EU Framework Programmes, is influenced positively by sectoral R&D in-tensity, industry concentration,firm size, technological spillovers and past RJV participation. Caloghirou, Hondroyiannis and Vonortas (2003), investigating data from the STEP TO RJVs databank, suggest that partnership success depends significantly on the closeness of the co-operative research to the in-house R&D effort of the firm, on thefirm’s effort to learn from the partnership and its partners and on the absence of problems of knowledge appropriation between partners. Moreover, theyfind thatfirms use partnerships as vehicles of risk and un-certainty reduction by collaborating with competitors and suppliers. Finally, Belderbos et al. (2004), using data from the Community Innovation Survey for the Netherlands during 1996-1998, examine the determinants of innovatingfirms’ decisions to establish cooperation with competitors (horizontal), suppliers or customers (vertical) and with universities and research institutes (institutional cooperation). Theyfind that incoming spillovers from universities and research institutes stimulate cooperation of all types. Risk, organizational constraints in the
firm’s innovation process andfirm size have a positive impact on all four types of cooperation, while R&D intensity has a positive impact on vertical and institutional cooperation.
for downstream firms, whether the input supplier(s) extract(s) rents from the downstream firms depends on the structure of the input market, the degree of spillovers that are internalized under the RJV and the degree of product differentiation. Whenever internalized spillovers are low, the efficiency of the RJV is fully exploited by thefinal-good producers and no efficiency is transferred to the upstream market, only if downstream firms face a monopolistic input supplier. Thus, downstreams’ incentives for a RJV are stronger in case of a single supplier, compared with incentives under competing vertical chains. Whenever internalized spillovers are high, the single supplier captures higher rents than suppliers under competing vertical chains do and thus, incentives for a RJV are stronger in case of competing vertical chains. The analysis also reveals that the more homogeneous the products are, the higher the spillovers that must be internalized under the RJV in order incentives under a single supplier to be stronger than incentives under a duopolistic input market.
In the second part of the paper we restrict our attention on the amounts invested in R&D. The present paper is among thefirst in the theoretical R&D literature that incorporates R&D spillovers into a vertical setting. In contrast to the hold-up argument, the analysis reveals that whenever firms invest non-cooperatively, investments are higher under a monopolistic supplier, compared with investments under competing vertical chains, if the free-riding is not in-tense. We argue that it is the combination of the low spillovers, that favor, and the single supplier’s strong pressure, that forces, downstreamfirms to increase R&D investments. This result contradicts with the conventional argument, which indicates that, the stronger the rent-extracting that downstream firms face, the lower the amounts that they invest per se. In case of a RJV, invest-ments are higher under competing vertical chains. In this case, downstreams invest cooperatively, avoid the free-riding and internalize the spillovers. As a result, there is no strategic interactions betweenfirms in the investments stage. As far as a single supplier always extracts a higher input price it discourages downstreams’ R&D investments. We argue that the effect of the input market structure on R&D investments depends on whether spillovers lead to free-riding or being internalized. We alsofind that the critical spillover rate increases as products become more homogeneous, indicating that thefiercer the competition becomes, the higher the spillovers thatfirms must internalize in order the RJV to be investment enhancing.
The welfare analysis suggests that a single supplier depresses social welfare under both non-cooperative and cooperative R&D investments. In addition to that, the minimum internalized spillovers in order the regulator to approve the RJV are lower under the competing vertical chains regime, compared with the single supplier regime, for every degree of product differentiation. These results underline that a single supplier hinders the transfer of the efficiency created by a RJV to consumers. Existing literature on RJVs, assuming perfectly competitive input markets, suggests that if spillovers exceed a critical level, a RJV results in enhanced social welfare and thus, cooperation will be preferable from the regulator’s point of view. This paper contributes to the relevant literature as we prove that the regulator, when deciding to approve or not the formation
of a RJV, should also take into account the structure of the input market. Policy-implications contain the encouragement of RJVs and the institution of antitrust enforcement for the input markets of R&D intensive industries. This combination of innovation and competition policies leads to the more preferable outcomes in terms of social welfare.
We are aware of two papers that study downstreamfirms R&D investments in two-tier vertically related industries. However, the questions addressed in these papers differ from ours. Attalah (2002) considers two vertically related duopolistic industries, with horizontal spillovers within each industry and verti-cal spillovers between the two industries. Allfirms can engage in cost-reducing R&D activities. In the first stage of the game all firms decide on their R&D simultaneously, while in the second and the third stage, suppliers and fi nal-good producers compete in quantities respectively. He studies four different schemes of R&D investments: No cooperation, intraindustry cooperation only,
interindustry cooperationonly andsimultaneous interindustry and intraindustry cooperation. Cooperative settings are compared in terms of R&D solely. The comparison shows that no setting uniformly dominates the others, while the type of cooperation that yields more R&D depends on horizontal and vertical spillovers, and market structure.6 Although we examine the case of
horizon-tal cooperation solely, the present paper departs from Athorizon-talah (2002) and Ishii (2004) in several ways. First of all, they examine only the case of an upstream duopoly, while in the present paper, the case of a single supplier is also exam-ined. Thus, we gauge the antitrust issues of different input market structures. In addition to that, Attalah (2002) and Ishii (2004) consider that input suppliers compete in input quantities. However, in our model suppliers set input prices. By doing so, the effects of supplier rent-extracting behavior is also taken into account. Thirdly, both of the above papers focus on R&D investments, while no attention is given infirms’ incentives to cooperate between different types of organization modes of R&D.
The rest of the paper is organized as follows: In section 2 we present the model and in sections 3 we examinefinal-good producers’ incentives to form a RJV. In section 4 the attention is restricted on R&D investment levels and in section 5 we carry out a welfare analysis and present policy implications. In section 6 some extensions of the basic model are discussed andfinally, section 7 concludes.
6In an identical setup and sequence of decisions, Ishii (2004) extends the analysis of Attalah.
Ishii (2004), following the taxonomy of Kamien et al. (1992), considers input R&D spillovers rather than output spillovers considered by Attalah (2002). He compares R&D investments under four vertical R&D organization modes: Non-cooperative R&D, vertical R&D cartels, vertical non-cooperative RJVs, and vertical RJV cartels. Hefinds that vertical R&D cartels attain a higher technological improvement and a larger social welfare than non-cooperative R&D and that vertical R&D cartels yield a larger social welfare than horizontal R&D cartels if the horizontal spillover rate between upstreamfirms is not sufficiently high.
2
The model
We consider a two-tier industry. There are two downstreamfirms, final-good producers, while the input market can be either duopolistic or monopolistic. The structure of the input market is assumed to be exogenously given. In case of a duopolistic input market, we follow thecompeting vertical chains regime
(CV): Each downstreamfirm has an exclusive relationship with one of the two upstreamfirms and buys its input only from that particular upstreamfirm. In the monopolistic case, there is asingle supplier (S)for both downstreamfirms. We also assume that the production cost for the supplier(s) is normalized to zero and that supplier(s) unilaterally set(s) the pricewof the input that is sold tofinal-good producers.7
Each downstream firm, denoted byi, j = 1,2, i 6=j, produces a diff erenti-ated final good (goods 1and 2respectively) and the inverse demand for that good is linear: Pi = α−qi −γqj. The parameter γ ∈ [0,1] is a measure of
substitutability in demand. Ifγ→0the goods are regarded as (almost) unre-lated, whereasγ→1corresponds to the case of (almost) homogeneous goods. Each downstream firm produces its final-good with a fixed-coefficient technol-ogy -one unit offinal product requires exactly one unit of the input- and the marginal cost of transforming the input into the final-good is c. We further consider thatfirm i can invest in R&D for cost-reducing process innovations. The overall marginal cost of transforming inputs into thefinal-good is given by
wi+c−yi−δyj. yiis the cost reduction due tofirmi’s R&D investment, while
yj is the benefits that leak from firm j to firm i without compensation, due
to the spillovers of R&D activities. δis the spillover rate, indicating the R&D externalities, with 0≤δ≤1. Following d’ Aspremont and Jacquemin (1988), we assume that spillovers are exogenous and industry-wide. The cost of R&D is
1 2ky
2
i, reflecting the existence of diminishing returns to R&D expenditures.
Pa-rameterkcaptures the relative effectiveness of R&D.8 Thus, downstream firm
ihas a total cost function,Ci= (wi+c−yi−δyj)qi−12y2i, i, j= 1,2, i6=j.
We consider that in this industry, R&D can be carried out under two alter-native organizational forms:
I. Non-cooperatively, where downstreamfirms carry out their R&D activities strategically. Formally speaking,firms act non-cooperatively in both R&D and output stage.
II. Cooperatively, where the downstreamfirms form a RJV and each enjoys the common R&D output. In this case, firms coordinate their activities so as to maximize their joint profits in the R&D stage. Under a RJV, although
firms internalize spillovers and avoid free-riding, duplication of effort is not eliminated.9
In order to answer the questions addressed above, we consider a four stage game with the following timing:
7In section 6.2 we allow for bargaining over the input price.
8k≥1guarantees that the second order conditions are satisfied. For simplicity, we assume
thatk= 1.
Stage 1: Downstream firms decide simultaneously, whether to invest in R&D non-cooperatively(nc)or to form a RJV (c).
Stage 2: Downstreamfirms invest in R&D.
Stage 3: Upstreamfirm(s) set(s) input price.
Stage 4: Downstreamfirms set quantities of thefinal-good.
We solve the game using Backwards Induction, in order to define the Sub-game Nash Perfect Equilibrium (SPNE).
3
Incentives to form a Research Joint Venture
103.1
The case of Competing Vertical Chains
We begin our analysis by examining the case where downstream firms invest in R&D non-cooperatively (denoted bync) .11 In the last stage of the game,
downstreams compete in a Cournot fashion, so as to maximize their profits:
Πi(qi, qj, wi, yi, yj, δ) = (a−qi−γqj)qi−(wi+c−yi−δyj)qi−
1
2y
2
i (1)
Solving thefirst order conditions of eq. (1), we compute the Nash-Cournot quantity levels:12
qi∗=[(2−γ) (a−c)−2wi+γwj+yi(2−γδ) +yj(2δ−γ)]
4−γ2 (2)
q∗
i decreases inwi and increases inwj. Note also thatqi∗increases not only
withfirmi’s R&D investment but withfirmj’s as well, indicating the positive spillover effect of R&D on thefinal-good quantity. Forγ∈[0,1]andδ∈[0,1],
firmi’s R&D investment has larger impact on its output thanj’s R&D impact has, as2−γδ >2δ−γ always holds. In the case of perfect spillovers (δ= 1),
firmi’s andj’s R&D investments have equal impact on eachfirm’s output. Given q∗
i and q∗j, in the third stage of the game input suppliers set input
prices simultaneously and non-cooperatively so as each supplier to maximize its profits:
πi=qi∗wi (3)
Thus, each supplier charges an input price equal to:
wi= £¡ γ2+ 2γ−8¢(a−c) +y i ¡ γ2+ 2γδ−8¢+y j ¡ 2γ+γ2δ−8δ¢¤ γ2−16 (4)
1 0Our benchmark is the paper of d’ Aspremond and Jacquemin (1988), who consider a
perfectly competitive input market. In this benchmark case, theyfind that a RJV increases investments if δ > 0.5, while it is always profitable for downstream firms, regardless the magnitude of spillovers.
1 1This can be the case where an antitrust law forbids the formation of RJVs among
com-petitors in order to deter a possible cartel in the market of thefinal good.
In the second stage of the game, downstream firms set non-cooperatively their R&D investments(y1, y2)in order to maximize their profits:
M axΠi yi =4 £¡ γ2+ 2γ−8¢(a−c) +y i¡γ2+ 2γδ−8¢+yj¡γ2δ+ 2γ−8δ¢¤ 2 (64−20γ+γ4)2 − 1 2y 2 i (5) Solving eq. (5), the symmetric R&D investment in equilibrium is:
yCVinc∗= 8 ¡ γ2+ 2γδ−8¢(a−c) A1 (6) whereA1= 40γ3−28γ4−2γ5+γ6−8γ2(δ−27)+64 (δ−7)−16γ ¡ 8 +δ+δ2¢.
Using eq. (1)-(6), equilibrium total R&D investment¡YCV
nc =y∗1+y2∗ ¢ ,fi nal-good quantity¡QCV nc ¢ , downstreamfirmi’s profits¡ΠCV inc ¢
and each upstream’s profits¡πCV
inc
¢
, are given by:
YncCV = 16 ¡ γ2+ 2γδ−8¢(a−c) A1 (7) QCVnc = 4 ¡ −γ4+ 20γ2−64¢(a−c) A1 (8) ΠCVinc = £ γ4¡520−40γ2+γ4¢+ 256γδ−23γ3δ−32γ2¡76 +γ2¢+ 3584¤(a−c)2 (A1)2 (9) πCVinc = −2 ¡ γ2−16¢2¡γ2−4¢3(a−c)2 (A1)2 (10) Qualitative analysis of the results in equilibrium indicates that, as far as downstream firms invest non-cooperatively and spillovers lead to free-riding, R&D investments and final-good quantity decrease in spillovers (dYincCV
dδ < 0
and dqCVinc
dδ <0). However, downstream and input suppliers’ profits increase in
spillovers (dΠCVinc
dδ > 0and dπCV
inc
dδ > 0), because increases in the spillovers that
leak from firm j to firm i, decrease i’s marginal cost. Finally, downstream and input suppliers’ profits decrease in the degree of product differentiation
³dΠCV inc dγ <0and dπCVinc dγ <0 ´
, because the more homogeneous that products are, the fiercer the competition, and as a result, final-good producers’ and input suppliers’ profits decrease.
Let us now examine the case where downstream firms form a RJV under competing vertical chains. In the last stage of the game, output is given by eq. (2) and in the third stage input suppliers charge a price given by eq. (4). In the second stage of the game downstreamfirms invest cooperatively in R&D so as to maximize their joint profits:
M axΠ yi,yj = 4 £¡ γ2+ 2γ−8¢(a−c) +yi¡γ2+ 2γδ−8¢+yj¡γ2δ+ 2γ−8δ¢¤ 2 (64−20γ+γ4)2 +4 £¡ γ2+ 2γ−8¢(a−c) +y i¡γ2δ+ 2γ−8δ¢+yj¡γ2+ 2γδ−8¢¤ 2 (64−20γ+γ4)2 −12yi− 1 2yi (11)
In equilibrium, the symmetric R&D investment is given by:
yCVic ∗= 8 (1 +δ) (a−c)
32γ−12γ2−4γ3+γ4−8¡7 + 2δ+δ2¢ (12)
We setA2= 32γ−12γ2−4γ3+γ4−8¡−7 + 2δ+δ2¢and it is found that
results in equilibrium are given by:
YcCV = 16 (1 +δ) (a−c) A2 (13) QCV c = 4¡−γ2+ 2γ+ 8¢(a−c) A2 (14) ΠCVic =4 (a−c) 2 A2 (15) πCVic =2 ¡ γ2−4¢(γ−2)4 (a−c)2 (A2)2 (16) R&D investments, total output, upstream and downstream profits increase inδ, as far as spillovers are internalized. Moreover, the comparative positive effect of spillovers on upstream and downstream profits in the case of a RJV is higher than the corresponding negative in case of strategic investments, due to spillovers’ internalization (that is,
¯ ¯ ¯dΠCVic dδ ¯ ¯ ¯ > ¯ ¯ ¯dΠCVinc dδ ¯ ¯ ¯ and ¯ ¯ ¯dπCVic dδ ¯ ¯ ¯ > ¯ ¯ ¯dπCVinc dδ ¯ ¯ ¯
always hold). Results for the role ofγ are identical with the corresponding in the non-cooperative case.
Now, consider that the formation of a RJVs is permitted. Do final-good producers have incentives(ICV)to form a RJV under competing vertical chains?
Thus, we investigate downstreamfirms’ strategies in thefirst stage of the game and we answer the first question addressed in the introduction of this paper. Downstream firm i has incentives to cooperate in R&D with firm j if each
firm’s profits under the RJV are higher than profits under non-cooperation
(ICV =ΠCVic −ΠCVinc >0). We state ourfindings in the following proposition:
Proposition 1 (i)Downstreamfirms have incentives to form a RJV under
final-good quantities are higher under a RJV, if δ >bδCV (γ) with d
b
δCV(γ)
dγ >0
andbδCV (0) = 0(bδCV (1) = 0.29).
Intuitively, firm i’s profits increase in spillovers in case of non-cooperation
³dΠCV inc dδ >0 ´ and under a RJV³dΠCVic dδ >0 ´ too. However, dΠCVic dδ > dΠCV inc dδ be-causedyicCV dδ >0, while dyincCV
dδ <0and as a result, decreases in marginal cost under
a RJV are higher than the corresponding decreases in case of non-cooperation. We further find that R&D investments are higher under a RJV, if spillovers exceed a critical rate(δCV). In case of non-cooperation, free-riding discourages
firms to invest in R&D anddyCVinc
dδ <0. On the contrary, by forming a RJV,firms
internalize spillovers and as a result, R&D investments increase³dyCVic
dδ >0
´
.13
Results for investments are presented infigure 1a. Note thatδCV increases from
0to 0.29, as products become more homogeneous(γ→1), indicating that the
fiercer the competition becomes, the higher the spillovers that firms must in-ternalize in order the RJV to be investment enhancing. According to upstream profits, as marginal cost and the price of the final-good decrease, the demand of thefinal-good increases. Subsequently, the demand for inputs increases, sup-pliers increase the input price that they charge and their profits increase too.
3.2
The case of a Single Supplier
Let us now examine the case wherefinal-good producers face a single supplier
(S). In the last stage of the game they compete in quantities trying to maximize their profits: Πi(qi, qj, wi, yi, yj, δ) = (a−qi−γqj)qi−(wi+c−yi−δyj)qi− 1 2y 2 i (17)
Solvingfirst order conditions of eq. (17), the Nash-Cournot quantity level is given by:
qi∗=(a−c) (2−γ) + (γ−2)w+yi(2−γδ) +yj(2δ−γ)
4−γ2 (18)
In the third stage, the monopolistic supplier maximizes:
π=¡q∗i +q∗j¢w (19)
by setting the input price, equal to:
w=1
4[2 (a−c) + (yi+yj) (1 +δ)] (20)
Input price increases infirm i’s andfirm j’s R&D investments, due to the R&D spillover effects.
1 3The same critical spillover rate holds for input price, upstream profits and final-good
In the second stage of the game, downstreamfirms set simultaneously their R&D investments so as eachfirm to maximize its profits:
M axΠi yi =[2 (2−γ) (a−c) +yi(6 +γ−2δ−3γδ) +yj(−2−3γ+ 6δ+γδ)] 2 16 (γ2−4)2 − 1 2y 2 i (21) Solving eq. (21), the optimal non-cooperative R&D investment level forfirm
iis given by:
yincS∗ = (−6−γ+ 2δ+ 3γδ) (a−c)
A3
(22) whereA3= 8γ2+ 4γ3−2¡13−2δ+δ2¢−γ¡15 + 2δ+ 3δ2¢. Subsequently,
equilibrium outcomes are given by:
YncS =2 (−6−γ+ 2δ+ 3γδ) (a−c) A3 (23) QSnc= (4γ 2−16) (a−c) A3 (24) ΠSinc= h 8¡γ2−4¢2−(6 +γ−2δ−3γδ)3i (a−c)2 (A3)2 (25) πS nc= 8 (γ−2)2(γ+ 2)3(a−c)2 (A3)2 (26) Qualitative analysis for the role ofγandδreveals that the results obtained in the case of non-cooperative R&D, under competing vertical chains, hold under a single supplier as well.
We now solve for the case where downstreamfirms form a RJV while facing a single supplier(S). Output in the last stage is given by eq. (18) and in the third stage the single supplier charges an input price given by eq. (20). Downstream
firms invest in R&D so as to maximize their joint profits:
M axΠ yi,yj = [2 (2−γ) (a−c) +yi(6 +γ−2δ−3γδ) +yj(−2−3γ+ 6δ+γδ)] 2 16 (γ2−4)2 [2 (2−γ) (a−c) +yj(6 +γ−2δ−3γδ) +yi(−2−3γ+ 6δ+γδ)]2 16 (γ2−4)2 −1 2yi− 1 2yj (27)
The optimal firmi’s R&D investment in case of a RJV is:
ySic∗= (4 + 2γ) (a−c)
Setting A4= 7 + 8γ+ 2γ2−2δ−δ2 , it is found that results in equilibrium are as follows: YcS = (8 + 4γ) (a−c) A4 (29) QSc = (2γ+ 4) (a−c) A4 (30) ΠSic= (a−c) 2 2A4 (31) πS c = ¡ 31 + 40γ+ 16γ2+ 2γ3−2δ−δ2¢(a −c)2 (A4)2 (32) The effects ofγandδon equilibrium outcomes reached for the case of RJV under competing vertical chains, hold for the present case as well. Note also that
¯ ¯ ¯dΠSic dδ ¯ ¯ ¯ > ¯¯¯dΠSinc dδ ¯ ¯ ¯ and ¯¯¯dπSic dδ ¯ ¯ ¯ > ¯¯¯dπSinc dδ ¯ ¯
¯ always hold. Investigating downstream
firms’ incentives to form a RJV(IS =ΠS
ic−ΠSinc)when facing a single supplier,
we state the following proposition:
Proposition 2 (i)Downstream firms have incentives to form a RJV under a
single supplier. (ii) R&D investments, input price, upstream profits and fi nal-good quantities are higher under a RJV, if δ > bδS(γ) with d
bδS(γ)
dγ > 0 and
bδS(0.33) = 0 (bδS(1) = 0.72).
The intuition behind these results goes precisely as in the case of compet-ing vertical chains and the results for investments are presented infigure 1b. However, a novel argument is that the critical spillover rate δS(γ) is higher
thanδCV(γ) for every degree of product differentiation, with δS(γ)increasing
from 0.33 to 0.72, as γ → 1. The reason for that lays on the comparative shift of investments and the subsequent point of intersection of the R&D in-vestment curves. If firms invest non-cooperatively, as spillovers increase and the free-riding effect becomes stronger, the decreasing rate of investment in case of a single supplier exceeds the corresponding under competing vertical chains³¯¯¯dyincS dδ ¯ ¯ ¯>¯¯¯dyCVinc dδ ¯ ¯
¯´. Thus, R&D investments in case of a single supplier are more steep inδthan investments under competing vertical chains. On the contrary, under a RJV, as spillovers increase, the increasing rate of investment under competing vertical chains exceeds the corresponding under a single sup-plier. ³¯¯¯dyicCV dδ ¯ ¯ ¯>¯¯¯dySic dδ ¯ ¯
¯´. Thus, the point of intersection betweenyCV
inc andyicCV
lays on the left of the point of intersection betweenyS
inc andyicS.
The analysis reveals that a single supplier increases the minimum spillovers that must be internalized in order the RJV to enhance investments andfi nal-good quantity. Therefore, we argue that a single supplier hinders the transfer of the efficiency created by a RJV to consumers.
0 0 . 2 0 . 4 0 . 6 0 . 8 1 0 0 . 2 0 . 4 0 . 6 0 . 8 1 0 0 . 2 0 . 4 0 . 6 0 . 8 1 0 0 . 2 0 . 4 0 . 6 0 . 8 1 C V n c Y C V c Y > C V c Y C V c Yn > S n c S c Y Y > S c S n c Y Y < 0 . 2 9 0 . 3 3 0 . 7 2 δ δ δ δ 1 a 1 b
Figure 1: 1a: R&D investments under competing vertical chains in case of non-cooperation ¡YCV nc ¢ and under a RJV ¡YS nc ¢
. 2b: R&D investments under a single supplier in case of non-cooperation¡YCV
nc ¢ and under a RJV¡YS nc ¢ .
3.3
Comparing
fi
rms’ incentives to form a Research Joint
Venture
The previous analysis suggests thatfinal-good producers do have incentives to form a RJV in case of competing vertical chains and under a single supplier too. In order to examine how does the structure of the input market affect downstreams’ incentives to form a RJV, we compare the magnitude of the in-centives under competing vertical chains¡ICV¢with the corresponding in case
of a single supplier¡IS¢. We state the following proposition:
Proposition 3 Downstreamfirms incentives to form a Research Joint Venture
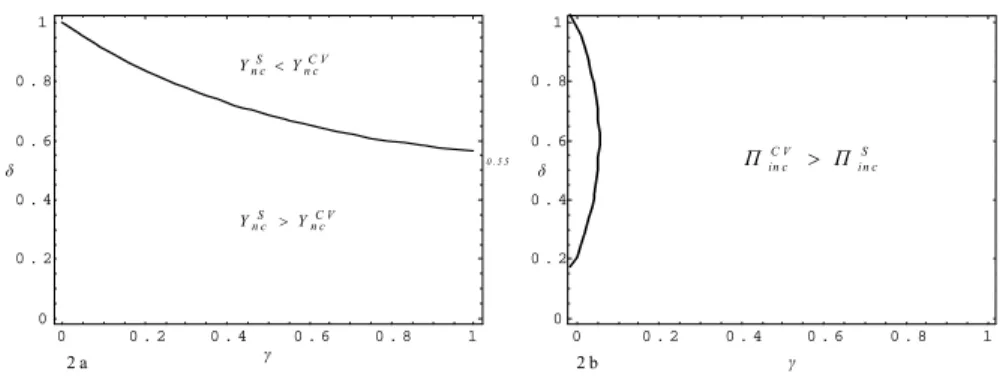
are stronger under a single supplier compared with incentives under competing vertical chains, ifδ <bδ(γ)with dγdbδ >0,bδ(0) = 0.24andbδ(1) = 0.55.
Results are presented infigure 2. Interestingly, it is found that although a RJV is always profitable for downstreamfirms, their incentives to form a RJV are non-monotone in the structure of the input market. The intuition behind this result goes as follows: A RJV is always profit-enhancing for downstream
firms. However, whether the input supplier(s) extract(s) part of the increased downstream firms’ profits due to the RJV, depends on the structure of the input market, the degree of spillovers that are internalized under the RJV and the degree of product differentiation.
Assumefirst that products are perfect substitutes (γ= 1). Whenever inter-nalized spillovers are low (δ <0.55), the RJV increases downstreams’ profits. In case of a duopolistic input market, in order upstreams’ profits to increase, the magnitude of the internalized spillovers must beδ >0.29. Only in this case, part of the efficiency created by the RJV is captured by the input suppliers. In case of a monopolistic input market, the RJV never increases the single sup-plier’s profits. The efficiency of the RJV is fully exploited by the downstream
0 0 . 2 0 . 4 0 . 6 0 . 8 1 0 0 . 2 0 . 4 0 . 6 0 . 8 1 γ δ C V S I I < C V S I I > 0 .5 5
Figure 2: Downstreamfirms incentives to form a RJV under competing vertical chains¡ICV¢and a single supplier¡IS¢.
firms and no efficiency is transferred to the monopolistic input supplier. As a result, if internalized spillovers arelow,downstreams’ incentives to form a RJV are stronger compared with the incentives under a duopolistic input market
¡
IS > ICV¢.
Assume now that the magnitude of spillovers that are internalized under the RJV ishigh (δ >0.55). In case of competing vertical chains, a RJV always increases downstreams’ and input suppliers’ profits, suggesting that part of the RJV’s efficiency is exploited by the input suppliers. In contrast to that, under a monopolistic upstream market, the supplier exploits higher profits only if the magnitude of the internalized spillovers isδ > 0.72. But, as far as the profits that the monopolistic supplier captures are higher than the profits that each supplier in competing vertical chains does, downstreams’ incentives to form a RJV are weakened, withICV > IS.
Incorporating the product differentiation parameter and assuming that prod-ucts can not be perfect substitutes, that isγ∈[0,1), we state the following re-sult: In order the downstreamfirms’ incentives for a RJV under a single supplier to be stronger than incentives under a duopolistic input market, the minimum internalized spillovers under the RJV should increase the more homogeneous the products become, that isγ → 1. This result suggests that the more homoge-neous the products are, the morefierce the competition between thefinal-good producers’ becomes and subsequently, the higher the spillovers that must be internalized under the RJV in order incentives under a single supplier to be stronger than incentives under a duopolistic input market. Observe infigure 2 that ddγbδ >0,withbδ(0) = 0.24andbδ(1) = 0.55.
4
Investments in R&D
In this part of the paper, the attention is restricted on the amounts invested in R&D. We examine how the coexistence of upstream rent-extracting and spillovers of R&D activities affects investments under different vertical rela-tions regimes, in case of non-cooperative and cooperative R&D. The present paper is among the first in the theoretical R&D literature that incorporates R&D spillovers into a vertical setting.
4.1
The case of non-cooperation
Let us begin the analysis with the case of non-cooperative R&D investments. Total R&D investment under competing vertical chains is given by eq. (7), and the corresponding under a single supplier is given by eq. (23). Comparing these, we state the following proposition:
Proposition 4 R&D investments are higher under a single supplier, compared
with the corresponding under competing vertical chains, ifδ <bδ(γ)with dγdbδ <0,
bδ(0) = 1andbδ(1) = 0.55.
This result contradicts with the conventional argument which predicts that investments under a single supplier should be lower, as far as a single sup-plier extracts higher rents. The intuition behind the result goes as follows: When downstreamfirms invest in R&D non-cooperatively, investments depend on the free-riding effect and the supplier rent-extracting effect. In case of no free-riding(δ= 0), investments under a single supplier are higher than invest-ments under competing vertical chains(Ys> Ycv). Although a single supplier
extracts higher rents ¡πS
nc> πCVinc always hold
¢
, its comparative stronger pres-sure increases R&D investments, rather than to decrease them. As free-riding arises, (δ > 0), only if it is weak(δ < δ∗) the single supplier pressure’s effect overcomes the negative effect of free-riding and thus Ys> Ycv. We argue that
when competition isfierce, in terms that downstreamfirms behave strategically in both R&D and output stages, the stronger single supplier’s pressure increases R&D investments, if free-riding is weak. It is the combination of low spillovers, that favor, and single supplier’s strong pressure, that forces, downstreamfirms to increase R&D investments.
Observe in figure 3a the inverse relation between the critical spillover rate
δ∗ and the degree of product differentiation. The more unrelated the products are, that isγ →0, the higher the profits that downstream firms capture and subsequently, the negative effect of free-riding must be very intense (high values ofδ) to offset the single supplier’s stronger pressure. In case of unrelated goods
(γ = 0) free-riding has no effect andYs > Ycv, while in case of homogeneous
goods(γ= 1), downstreamfirms invest more when facing a single supplier only ifδ∗<0.55.
Note also that firm i’s profits are higher under competing vertical chains, compared with the case of a single supplier, unlessγ = 0 and δ > 0.2(figure
0 0 . 2 0 . 4 0 . 6 0 . 8 1 0 0 . 2 0 . 4 0 . 6 0 . 8 1 0 0 . 2 0 . 4 0 . 6 0 . 8 1 0 0 . 2 0 . 4 0 . 6 0 . 8 1 C V n c S n c Y Y > C V n c S n c Y Y < S in c C V in c Π Π > 0 . 5 5 δ δ γ γ 2 a 2 b
Figure 3: 3a: Total R&D investments under competing vertical chains¡YCV nc
¢
and a single supplier¡YS nc
¢
. 3b: Firmi’ s profits under competing vertical chains
¡
ΠCV
inc
¢
and a single supplier¡ΠS inc
¢
.
3b). In addition to that, a single supplier’s profits are always higher than each supplier’s under competing vertical chains. Intuitively, downstreamfirms invest in R&D and as a result the marginal cost falls. The price of thefi nal-good decreases and its demand increases. Demand for input increases too and supplier(s) extract(s) rents through setting higher input price. A single supplier always extracts more rents, than a supplier in competing vertical chains does (wncS > wCVinc and πSnc > πCVinc always hold). But, the higher the price that suppliers charge, the lower the input quantities that downstreamfirms buy and the lower their profits. This is the rational why downstream firms’ profits are higher in competing vertical chains ¡ΠCVinc >ΠSinc¢. However, for γ = 0 and
δ >0.2, each downstream earns more when facing a single supplier, which is a
counterintuitive result. In case of no free-riding, downstreams earn more under competing vertical chains, regardless the degree of product differentiation. As free-riding arises (δ >0.2), only if final-goods are unrelated and subsequently downstream firms act as monopolists, their profits are higher when facing a single supplier.
4.2
The case of a Research Joint Venture
Let us now proceed in the analysis of the case wherefirms invest in R&D under a RJV. Investments under competing vertical chains are given by eq. (13) and the corresponding under a single supplier are given by eq. (29). Comparing these results, we state the following proposition:
Proposition 5 R&D investments are always higher in case of competing
ver-tical chains.
In case of a RJV, downstream firms invest cooperatively, they internalize spillovers and avoid the free-riding. In this case, there is no strategic
interac-tion betweenfirms in the R&D investment stage. Given that a single supplier extracts higher rents ¡πS
c > πCVic always holds
¢
, investments are higher under competing vertical chains¡YCV
c > YcS
¢
.14 The previous analysis suggests that
the effect of the input market structure on R&D investments depends on whether spillovers lead to free-riding or being internalized.
According to upstream and downstream profits, the findings for the case of RJV coincide with the corresponding in case of non-cooperation. However, in the present case, downstreams’ profits are always higher under competing vertical chains. This result comes also from the fact that as far as spillovers are being internalized, they do not affect downsteams’ strategic interactions.
5
Welfare analysis
In this section we conduct a welfare analysis and suggest some policy implica-tions. For the purposes of the analysis we assume that there exists a regulator who can approve the formation of a RJV if it enhances social welfare. The appropriate measure of welfare consists of three parts: Consumers’ surplus, downstreamfirms’ profits and suppliers’ profits. We have two alternative or-ganizational forms of R&D activities (non-cooperative: ncand cooperative: c) and two downstreams-supplier(s) regimes: Single supplier(S) and competing vertical chains(CV). Thus, social welfare is defined as:
SWAB =1 2 ¡ QBA¢2+ 2ΠBA+ 2πiBA, A=nc, c, B=CV, S (33) 1 2 ¡
QBA¢2 indicates consumers’ surplus and2ΠBA and2πBA indicate overall down-stream and updown-stream profits respectively. Social welfare for each case is given in the Appendix.
Interestingly, it is found that SWCV
nc > SWncS and SWcCV > SWcS always
hold. Downstream profits and consumers’ surplus are higher under the CV
regime. On the contrary, a single supplier always earns more than each supplier does under competing vertical chains. However, the sum of downstream prof-its and consumers’ surplus overcome the single supplier’s depression in social welfare.
We now turn to the core issue of the social welfare analysis: How does the structure of the input market affect the regulator’s decision to approve the RJV?
1 4Banerjee and Lin (2003), following a setup where nfinal-good producers, that face a
monopolistic upstream supplier setting the input price, undertake cost-reducing R&D invest-ments, prove that downstream firms may overcome underinvestment through a fixed input price contract, signed before R&D is undertaken. They also suggest that this type of arrange-ment can be viewed as a long-term contractual relationship where the upstreamfirm commits to a prespecified input price even if the demand conditions for the input change in the future. We depart from their paper as we examine the case of a duopolistic input market as well and we incorporate R&D spillovers. In addittion to that, the reversal of timing that they suggest does not correspond to the planning horizon usually associated with the respective decisions, as investment decisions are mostly long-run while input price contracts are usually negotiated for a much shorter time horizon.
0 0 . 2 0 . 4 0 . 6 0 . 8 1 0 0 . 2 0 . 4 0 . 6 0 . 8 1 0 0 . 2 0 . 4 0 . 6 0 . 8 1 0 0 . 2 0 . 4 0 . 6 0 . 8 1 δ δ γ γ C V c S W C V n c S W > 0 . 2 9 0 .3 3 0 .7 2 C V n c S W C B c S W > S Wn cS >S WcS S WcS>S Wn cS 4 a 4 b
Figure 4: 4a: Social welfare under competing vertical chains in case of non-cooperation ¡SWCV nc ¢ and under a RJV ¡SWS nc ¢
. 4b: Social welfare under a single supplier in case of non-cooperation¡SWncCV¢and under a RJV¡SWncS¢.
In order to answer this question, we compare -for everyregime- social welfare under non-cooperative R&D investments with welfare under a RJV, and we state the following proposition:
Proposition 6 (i) The regulator will approve the Research Joint Venture
un-der the competing vertical chains regime ifδ > bδCV (γ) with dbδCVdγ(γ) >0 and
bδCV (0) = 0 (bδCV (1) = 0.29). (ii) The regulator will approve the Research
Joint Venture under the single supplier regime ifδ >bδS(γ)with d
bδS(γ)
dγ >0and
bδS(0.33) = 0 (bδS(1) = 0.72).
Results are presented infigures 4a and 4b. According to the economic ratio-nale behind these results, a RJV always leads to increased downstream profits. However, the minimum internalized spillovers in order the RJV to increase con-sumers’ surplus and suppliers’ profits are lower under the competing vertical chains regime, for every degree of product differentiation, as we have already proven in section 3. In case of competing vertical chains, the minimum spillover rate increases from 0 to 0.29, as products become more homogeneous, while in case of a single supplier the corresponding rate increases from0.33 to 0.72. Thus, although a RJV always increases downstream profits, it is not always preferable from the social welfare point of view. The more concentrated the input market is, the higher the spillovers that have to be internalized through a RJV, in order downstreamfirms’ and regulator’s incentives for a RJV to be aligned. This result underlines the difficulties for the alignment betweenfirms’ and regulators’ preferences and the rigidities for the transfer of the efficiency created by a RJV to consumers, that a single supplier causes.
In the relevant literature, although Ishii (2004) conducts a welfare analysis he does not suggest any policy implications for reaching socially preferable out-comes. On the contrary, the previous analysis offers some directions for R&D
and antitrust policy implications. According to the first one, policy-makers should move towards the encouragement of RJVs (e.g. through subsidization) in R&D intensive industries where input suppliers do have market power. A RJV leads to more preferable outcomes forfirms and consumers given that a minimum degree of spillovers are internalized. The second policy implication comes from the depressing effects of a single supplier on social welfare. We suggest that policy-makers should extend the antitrust rules to input markets of R&D intensivefinal-good industries. Thus, possible anticompetitive situa-tions should be investigated in the suppliers’ market, beyond the market of the
final-good.
Existing literature on RJVs, assuming perfectly competitive input markets, suggests that if spillovers exceed a critical level, a RJV results in enhanced social welfare and thus, the cooperation should be approved by the regulator. This paper contributes to the relevant literature as we prove that the regulator, when deciding to approve or not the formation of a RJV, should also take into account the structure of the input market. The analysis shows that it is the combina-tion of the above R&D and antitrust policies that leads to the more preferable outcomes in terms of social welfare. Through the above integrated policy-mix, policy-makers can overturn not only free-riding (through the encouragement of RJVs), but also rent-extracting (through blocking high concentration in in-put suppliers for R&D intensivefinal-good industries), and this is not only an contributional argument in the relevant literature, but also a straightforward applicable policy. Especially for the case of European Union, given the wide asymmetries across Member States’ innovation policies, our analysis suggests that the above policy-mix can be an effective framework for integrated policies that will sufficiently increase European competitiveness.
6
Extensions
The basic model is rather stylized, so it is natural to check the robustness of our results. Thus, we extend the basic model in three different directions.15
6.1
Bertrand competition
The question addressed in this subsection is whether results demonstrated under Cournot competition, hold under price competition as well. The corresponding profit function for downstreamfirmi, has the form:16
Πi(Pi, Pj, wi, yi, yj, δ, θ) = [P i−(wi+c−yi−δyj)]× α(1−γ) +γPj−Pi 1−γ2 − 1 2kx 2 i (34)
1 5Due to space limits, the results are presented in brief. A detailed derivation of the results
is available from the authors upon request.
1 6As in the case of Cournot competition, we set k= 1a condition which guarantees that
It can be shown that results obtained in the previous sections, hold for the case of Bertrand competition as well. The reason is that although the nature of product market competition is altered, competition in prices does not alter the interactions between downstreamfirms and supplier(s) that drive the results.
6.2
Bargaining over input price
In the previous analysis, it was assumed that supplier(s) unilaterally set(s) the input price. It is then natural to check whether our results still hold if we allow downstreamfirms to have bargaining power over the input price. It has already been showed that results obtained under Cournot competition hold for the case of Bertrand competition as well and that although the product differentiationγ
affects the results, it is not the main factor that drives them. Therefore, we allow for bargaining over the input price, considering homogeneous products (γ= 1) and Cournot competition. In the case of competing vertical chains, under the general asymmetric Nash Bargain over input price between each input supplier - downstreamfirm pairi solves:
wi= arg max n Bi=πβiΠ 1−β i o (35) We consider that input suppliers are endowed with the same bargaining power(β1=β2=βCV). It is found that downstreamfirms do have incentives to form a RJV even if the input price is determined through bargaining. In addition to that, the critical spillover rate that guarantees investments, input price, upstream profits andfinal-good quantity enhancement due too the RJV, decreases in the bargaining power of the input suppliers³dbδCV(β)
dβCV <0 ´
.17 In
the second case, a single supplier (with bargaining power βS), bargains with downstreamfirms’ federation over the input price and the federation acts so as to maximize overall industry’s profits. We alsofind that downstreamfirms do have incentives for a RJV. Interestingly, the critical spillover rate that guarantees investments, input price, upstream profits andfinal-good quantity enhancement due too the RJV, increases in the bargaining power of the monopolistic supplier
³
dbδS(β)
dβS <0 ´
.18
It turns out that our qualitative results are robust. Thus, it is mainly the structure of the input market rather than the distribution of bargaining power between upstream(s) and downstreams that drives the results. The trade-off be-tween suppliers’ bargaining power and the critical spillover rate, depends on the regime between supplier(s) final-good producers. The economic rationale be-hind this result is that the distribution of bargaining power, betweenfinal-good producers and input suppliers, affects suppliers’ rent-extracting potential and
1 7The case of bargaining in competing vertical chains was analytically solved, while results
for the case of bargaining between a single supplier and the federation were obtained after numerical simulations. A detailedfile is available from the authors upon request.
1 8In all of the above cases, the fall-back payoffs for downstreamfirms and input suppliers
downstream R&D investments as spillovers vary and subsequently, the critical spillover rate is also influenced.
6.3
The case of a RJV cartel
Our formal modeling for the case of the RJV was based on two key assumptions: According to thefirst one, the magnitude of spillovers is industry-wide and the sharing of information in case of a RJV remains the same as when R&D is conducted non-cooperatively. According to the second one, whenfirms form a RJV, R&D activities are conducted in two different labs. Thus, although free-riding is avoided, firms do not eliminate the duplication of effort. It is logical then to examine the case where firms form a RJV and undertake their R&D activities in one common lab. In this case, information sharing is maximized, that is, the formation of the RJV leads to δ = 1. This is the case of a RJV cartel, in the taxonomy proposed by Kamien et al. (1992), where firms avoid not only the free-riding but the duplication of effort as well.
Analysis of pure-strategy subgame-perfect Nash equilibria discloses that a RJV cartel gives more preferable results, in terms of investment levels, fi nal-good quantity, input price, consumers’ surplus and social welfare. However, downstreamfirms’ incentives to form a RJV cartel are always stronger under the competing vertical chains regime, compared with incentives in case of a single supplier.
7
Concluding remarks
Although the research on RJVs is growing, formal models have focused on hor-izontal settings. However, vertical market structures are critical because they may hinder downstream R&D investments. The purpose of this paper was to investigate final-good producers’ incentives to form a RJV and R&D invest-ments in vertically related industries where input suppliers extract rents. The analysis suggests that downstream firms’ incentives to form a RJV are non-monotone in the structure of the input market. Although a RJV is always profit-enhancing for downstream firms, whether the input supplier(s) extract rents from the downstreamfirms depends on the structure of the input market, the degree of spillovers that are internalized under the RJV and the degree of product differentiation. In addition to that, it was showed that the intense hold-up of a single shold-upplier, in case of non-cooperative R&D, increases investments if free-riding is weak. The welfare analysis suggests that the regulator, when deciding to approve or not the formation of a RJV, should take into account the structure of the input market and the regime that relates input suppliers withfinal-good producers. We suggest that the encouragement of RJVs between downstreamfirms jointly with the strict antitrust in input market leads to the more preferable outcomes in terms of social welfare.
The results obtained in this paper could guide future research in the field of empirical investigation of RJVs participation determinants and participants’
performance. An empirical test should start with a detailed study for the dis-crimination in the data material between process R&D intensive industries with low and high concentration of input suppliers. Based on the previous analysis, afirst testable hypothesis is the participation probability offinal-good produc-ers in RJVs depending on the concentration ratio in input suppliproduc-ers’ industries. Infinal-good industries with low spillovers, the higher the concentration in in-put suppliers’ industries, the higher the probability of final-good producers’ participation in RJVs. Empirical results consistent with our argument would indicate that firms participate in RJVs in order to overcome their suppliers’ rent-extracting.
8
Appendix
Social walfare for each case is given by:
SWncCV =4 £ 31744 + 6768γ4−848γ6+ 48γ8−γ10+ 512γδ−64γ3δ−64γ2¡380 +δ2¢¤(a −c)2 £ 40γ3−28γ4−2γ5+γ6−8γ2(δ−27) + 64 (δ−7)−168γ¡8 +δ+δ2¢¤2 (a1) SWcCV =4 £ 256γ−160γ2−64γ3+ 20γ4+ 4γ5−γ6−16¡δ2 + 2δ−31¢¤2(a−c)2 £ 32γ−12γ2−4γ3+γ4−8¡7 + 2δ+δ2¢¤2 (a2) SWncS = £ 476−64γ3+ 32γ4+ 8γ5+ 4δ(6−δ) +γ¡116 + 40δ−12δ2¢+γ2¡−257 + 6δ−9δ2¢¤(a−c)2 £ 8γ2+ 4γ3−2¡13−2δ+δ2¢ −γ¡15 + 2δ+ 3δ2¢¤2 (a3) SWcS = ¡ 31 + 40γ+ 16γ2+ 2γ3−2δ−δ2¢(a −c)2 ¡ 7 + 8γ+ 2γ2−2δ−δ2¢2 (a4)
References
[1] Amir, R., Evstigneev, I., Wooders, J., 2003. Noncooperative versus cooper-ative R&D with endogenous spillover rates. Games and Economic Behavior 42, 183—207.
[2] Atallah, G., 2002. Vertical R&D spillovers, cooperation, market structure, and innovation. Economics of Innovation and New Technology 11(3), 179— 209.
[3] Banerjee, S., Lin, P., 2003. Downstream R&D, raising rivals’ costs, and input price contracts. International Journal of Industrial Organization 21, 79-96.
[4] Belderbos, R., Carree, M., Diederen, B., Lokshin, B., Veugelers, R., 2004. Heterogeneity in R&D cooperation strategies. International Journal of In-dustrial Organization 22, 1237-1263.
[5] Benfratello, L., Sembenelli, A., 2002. Research joint ventures andfirm level performance. Research Policy 31, 493-507.
[6] Cabral, L., 2000. R&D cooperation and product market competition. In-ternational Journal of Industrial Organization 18, 1033—1047.
[7] Caloghirou, Y., Hondroyiannis, G., Vonortas, N., 2003. The Performance of Research Partnerships. Managerial and Decision Economics 24, 85—99. [8] Caloghirou, Y., Ioannides, S., Vonortas, N.S, 2003. Research Joint
Ven-tures. Journal of Economic Surveys 17, 541-570.
[9] Cassiman, B., Veugelers, R., 2002. R&D cooperation and spillovers: some empirical evidence. American Economic Review 92 (4), 1169—1184. [10] D’Aspremont, C., Jacquemin, A., 1988. Cooperative and non-cooperative
R&D in duopoly with spillovers. American Economic Review 78, 1133-1137. [11] Hagedoorn, J., van Kranenburg, H., 2003. G rowth patterns in R&D part-nerships: an exploratory statistical study. International Journal of Indus-trial Organization 21, 517—531.
[12] Hernan, R., Marin, P.L., Siotis, G., 2003. An empirical evaluation of the determinants of research joint ventures. Journal of Industrial Economics 52, 75-89.
[13] Ishii, A., 2004. Cooperative R&D between vertically related firms with spillovers. International Journal of Industrial Organization 22, 1213— 1235. [14] Kamien, M.I., Muller, E., Zang, I., 1992. Research joint ventures and R&D
cartels. American Economic Review 82, 1293-1306.
[15] Katsoulacos, Y., Ulph, D., 1998. Endogenous Spillovers and the Perfor-mance of Research Joint Ventures. The Journal of Industrial Economics. 46(3), 333-357.
[16] Lambertini,L., Poddar, S., Sasaki, D., 2002. Research joint ventures, prod-uct differentiation, and price Collusion. International Journal of Industrial Organization 20, 829-854.
[17] Miyagiwa, K., Ohno, Y., 2000. Uncertainty, spillovers, and cooperative R&D. International Journal of Industrial Organization 20, 855—876. [18] Poyago-Theotoky, J., 1995. Equilibrium and Optimal Size of a Research
Joint Venture in an Oligopoly with Spillovers. The Journal of Industrial Economics. 43(2), 209-226.
[19] Salant, S., Shaffer, G., 1998. Optimal asymmetric strategies in research joint ventures. International Journal of Industrial Organization 16, 195— 208.
[20] Suzumura, K., 1992. Cooperative and noncooperative R&D in an oligopoly with spillovers. American Economic Review 82 (5), 1307—1320.
[21] Vonortas, N.S., 1997. Research joint ventures in the United States. Research Policy 26, 577-595.
[22] Yi, S., Shin, H., 2000. Endogenous formation of research coalitions with spillovers. International Journal of Industrial Organization 18, 229-256. [23] Ziss, S., 1994. Strategic R & D with Spillovers, Collusion and Welfare. The