An Analysis of United States Navy Disaster Relief Operations
ABSTRACT
Over the past decade, there have been numerous disasters for which the United States Navy (USN) has provided a significant amount of effective assistance in terms of scope, scale and timing due to its many unique and critical capabilities. During each disaster response the USN has deployed many different types of ships. However, not all ships are equally suited to contribute effectively to each disaster. Currently, there is no mechanism to explicitly evaluate the utility of vessel types for disaster response. We discuss the characteristics of specific USN vessels in the context of three events – the 2004 Indian Ocean Tsunami, 2005 U. S. Hurricane Katrina, and 2010 Haiti Earthquake – so as to illustrate their relative utility for disaster response. Our contribution to the research literature is threefold. First, we present a case methodological approach to evaluate the capability of an organization to provide assistance during a disaster response operation; this methodological approach may be used in future research to evaluate the disaster response capabilities other types of organizations. Second, we determine which USN assets are best suited for specific disaster relief efforts based upon the capabilities and limitations of the vessels and the traits of the disaster. Finally, our results will assist the U.S. Congress as well as the USN with its decisions when considering the types of vessels it will retain or procure in the future to support humanitarian assistance and disaster relief.
2
1. INTRODUCTION
During the Indian Ocean earthquake and tsunami of 2004, the United States Navy (USN) provided 81 days of assistance with 29 different vessels. After Hurricane Katrina ravaged New Orleans, the USN provided 42 days of assistance with 34 different vessels. The magnitude 7.0 earthquake that struck Haiti in 2010 left over 200,000 people dead, over 250,000 injured, and over 1.1 million homeless (Aymat, 2010). The USN responded to the disaster with 31 ships to provide 72 days of assistance (Department of Navy, 2010).
The response to the earthquake in Haiti, the Indian Ocean tsunami, and Hurricane Katrina are but three among the many contributions made by the USN over the past decade due to its many unique and critical capabilities. With a large number of the world’s population living in close proximity to the coastline, the USN’s ability to traverse and deploy large quantities of relief from the sea is a valuable capability during a disaster relief operation. The ability to quickly establish presence in the littoral while delivering large volumes of relief in the hours and days following a disaster helps to reduce the “gap of pain” that has been described as the time between the demand for aid and the time in which the aid is provided (Cuculo, 2006).
Though the USN has contributed many ships to past disaster relief efforts not all are equally capable of providing effective relief nor all should be sent to respond. On November 15, 2007, Bangledesh was struck by Cyclone Sidr, which caused over 10,000 deaths and more than US$450 million in damages. In response, the USN decided to send one of its Guided Missile Destroyers (DDG), which was in the vicinity. One of the authors was serving on this ship at that time. Due to the gradual slope of the ocean floor along the Bangledesh coastline which creates a relatively shallow draft, the DDG could approach no closer than 25 miles from the shoreline which was out of the visibile range. Additionally, the DDG was not outfitted with a helicopter, could not produce enough water to supply victims or hospitals ashore, and did not have extra food or medical supplies to provide the disaster victims. In short, this ship was unable to provide tangible relief to the devastated area. Thus, the USN may send assets that are able to reach an affected area quickly but the effort serves no purpose if the vessels sent are not suitable for the task at hand. Such examples illustrate that in order to become more effective in humanitarian assistance and disaster relief (HADR) operations, the USN will need to understand which assets may contribute the greatest benefit when responding to specific disasters. The prevailing
3
assumption that the closest asset is best asset to deploy will not necessarily lead to a suitable or effective utilization of resources.
In order to provide appropriate humanitarian support an organization needs to assess the needs of the affected population, study the capabilities of the provider and match the needs of the affected population with the capabilities of providers. Therefore, we need to understand the ‘demand’ and ‘supply’ in disaster relief operations. There have been many scholarly articles written that describe the activities that occur during disaster relief operations (see, for example Apte 2009, Yi and Ozdamar 2007, Hoffman 2006, Hale and Moberg 2005, Pettit and Beresford 2005, Barbarosoglu et al. 2002, and Baker et al. 2002). However, there is very little that has been published that explicitly considers the demand for aid during a disaster as it evolves over time. The humanitarian community has a general notion of the necessary supplies and services that would be needed but the ‘what’ and ’where’ of the needs to be satisfied by ‘whom’ is one of the most complex, and unfortunately least addressed, issues in the humanitarian assistance and disaster response literature. Even more complex is the understanding of ‘when’ the demand for certain supplies and services arose and ‘when’ the supply was provided.
In many disasters, supply does not necessary follow the demand. Supply may be deployed independent of knowing demand simply because it is difficult or impossible to determine demand immediately following a disaster event. What is needed and precisely when and where it is needed may be unknown. Further, the capabilities and scope of the supply of disaster responders may be unknown to those in the affected disaster area. The uncertainty associated with both the demand for and supply of disaster assistance frequently leads to a mismatch of goods and/or services in quantity, type or both (Apte 2009, McCoy 2008).
Recently, as a part of Operation Tomadachi, the USN “pushed” supplies into those areas affected by the earthquake and tsunami in Japan without fully understanding the demand. The demand, which comes in the form of a formal request from the Government of Japan, is transmitted to the U.S. State Department whereas the supply originates from the U.S. Department of Defense (Semilla, 2011). To better understand the nature of demand and supply for aid we analyzed different types of disasters to uncover and describe a generalized set of needs (or demand) which we call disaster traits. Some of these needs will be met by non-military organizations and some by military organizations. On the supply side, our focus is on the military organization. We
4
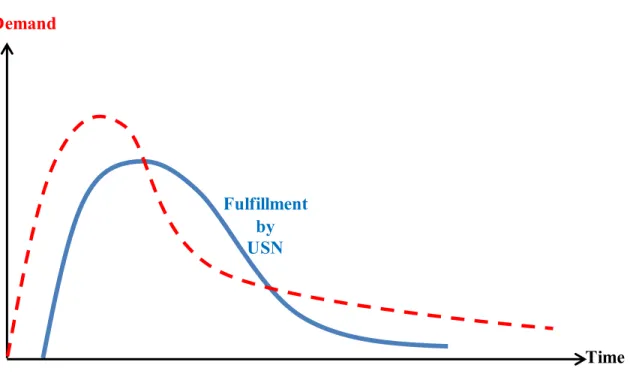
specifically study the role of the USN in past three disasters to understand how demand was met not through just one asset such as a ship, but through a portfolio of assets which constitute the force structure of the USN. We also wished to understand the timing of demand and supply for disaster aid. In Figure 1 we offer a notional graph of demand for assistance in terms of
commodities and services in case of a disaster. Through our analysis of the USN response to three major disaster events we are able to determine the arrival on-scene of each ship and build an illustration of the cumulative supply of assistance over time.
Our contribution to the research literature is threefold. First, we present a case methodological approach to evaluate the capability of an organization to provide assistance during a disaster response operation; this methodological approach may be used in future
research to evaluate other types of organizations which in turn will yield a more complete picture of efforts and capabilities needed to reduce the gap of pain. Second, we determine which USN assets are best suited for specific disaster relief efforts based upon the capabilities and limitations of the vessels and the traits of the disaster; vessels are selected based on the fulfillment capability as well as timeline of the fulfillment. Finally, our results will assist the U.S. Congress and USN with its decisions when considering the types of vessels it will retain or procure in the future to support humanitarian assistance and disaster relief.
Figure 1 Notional Graph of Demand in case of a Disaster Demand
5
The remainder of the paper is structured as follows. In section 2 we describe the demand for resources during a disaster by describing a set of common disaster traits that drive relief requirements. In section 3, through our observations, we describe the capabilities of specific USN vessels and the mission requests each is able to fulfill. In section 4 we identify those vessels most capable of fulfilling specific demands and requirements during a. The fulfillment process has two dimensions: 1) the supply of a needed resource for the demand, and 2) the timing of the fulfillment of that demand. In section 5, we offer our analysis about how demand for disaster relief may best be met by specific types of USN assets based upon their capabilities and limitations. In the last section we conclude the article and describe possibilities for future research.
2. THE DEMAND
We collected and analyzed data for the 2004 tsunami in the Indian Ocean, the 2005 Hurricane Katrina, and the 2010 earthquake in Haiti. These disasters were selected based upon the diversity of their speed of onset and geographic dispersion (see Apte, 2009 for a further discussion of disaster classifications). In addition, each of these disasters was catastrophic in its effects and occurred near the coast and therefore elicited a U.S. Navy response. For each of the three events discussed in this research we focus on common disaster traits that typically require the involvement of ships.
2.1 Disaster Traits
The Indian Ocean tsunami of 2004 was the result of an earthquake that measured
magnitude 9.1 on the Richter scale and at the time it was the fourth-largest earthquake worldwide since 1900. The tsunami that occurred in the aftermath struck more than a dozen countries. Indonesia experienced most of the damage resulting in broad destruction of many elements of critical infrastructure. The coastal highway on the island of Sumatra was completely destroyed, making many damaged areas inaccessible to land-based aid workers (Elleman, 2007). Hurricane Katrina struck Louisiana’s coastline on August 29, 2005. At landfall, the storm was a Category 3 on the Saffir-Simpson hurricane scale, with winds greater than 125 mph (NOAA Public Affairs, 2007). Hurricane Katrina is recognized as the most costly hurricane ever to strike the United States, with an estimated $135 billion in damage to the gulf coast states (Plyer, 2010).
6
The earthquake that impacted Haiti, on January 12, 2010, was 7.0 in magnitude and lasted 35 seconds. The earthquake caused significant damage to the infrastructure and resulted in many
deaths and serious injuries (Aymat, 2010). Table 1shows the effects of the Indian Ocean
Tsunami, Hurricane Katrina, and the Haiti Earthquake.
Table 1 Effects of Indian Ocean Tsunami, Hurricane Katrina and Haiti Earthquake
(Sources: National Geographic, 2005; NGDC, 2011b; Van Rooyen & Leaning, 2005; CRS, 2005; Louisiana Department of Health and Hospitals, 2006; NOAA Public Affairs, 2007; Plyer,
2010; Wooldridge, 2010)
The destruction of critical infrastructure, public goods (such as water), and critical facilities (such as hospitals) was apparent in each of the disasters. In Indonesia, the tsunami destroyed more than 25% of Aceh Province's villages along with much of the transportation and communications infrastructure. Other countries affected by the tsunami lost all electric power production capability. As a result of Hurricane Katrina more than three million people were left without power and thousands without fresh water as a result of broken water mains. More than 80% of New Orleans was underwater on August 31, 2005 to include the Louis Armstrong New Orleans International Airport resulting in its closure. Highways throughout the Gulf of Mexico region were closed due to flooding and there was considerable damage to the oil and fishing industries as a result of lost boats and rigs blown from their fixed locations. The Haiti earthquake destroyed all five medical facilities around Port-au-Prince as well as portions of the Toussaint L'Ouverture International Airport. Most of the Port-au-Prince communication infrastructure and roadways as well as the seaport were destroyed and unusable during the immediate rescue operations. Debris as a result of fallen buildings presented a significant obstacle to rescue teams attempting to reach those still trapped beneath the rubble in the immediate aftermath. The
2004 Indian Ocean Tsunami Slow-onset and Dispersed
2005 Hurricane Katrina Slow-onset and Localized
2010 Haiti Earthquake Fast-onset and Localized
Deaths >227,000 >1,700 92,000-220,000 estimated
Injured >500,000 >2,000 in New Orleans alone 250,000
Missing >2,000,000 (summary of initial reports) >12,000 reported 20,000 Displaced >1,500,000 >1,000,000 in gulf coast states 1,100,000
7
collapse of port docks and cranes in Haiti, as well as debris along the coast of Indonesia as a result of the tsunami, presented navigation challenges to ships because of uncertainty in the location of the coastline. Though diverse in classification, we found all three disasters shared common traits and that these traits were also observed in many disasters catalogued by the International Disaster Database (EM-DAT, 2011).
We identify some of the basic disaster traits that these disasters have in common such as: high number of deaths and injuries, population dispersion, homelessness, and high number of missing persons, facility destruction and loss of common goods such as fresh water supply, need for medical personnel, facilities, and volunteers. We list these in the first column of figure 2.
Figure 2 Basic Disaster Traits and Relief requirements
2.2 Relief Requirements
The disaster traits identified can be translated into specific relief requirements. Though not exhaustive, we identify those relief requirements that correspond to the disaster traits in the second column of figure 2.
Large number of deaths and injuries
Population dispersion, homelessness, and large number of missing persons
Increased demand for critical commodities such as fresh water, food, and medical supplies
Need for medical personnel, facilities, and volunteers
Destruction of transportation infrastructure such as airports, seaports, railroads, and roads
Large amounts of debris and destroyed buildings
Search and rescue
Transfer of affected population
Triage facilities and operating rooms
Supply of fresh water or means to purify water
Stock of non-perishable food and medical supplies
Engineering equipment to construct temporary facilities and remove debris
8
For example, search and rescue missions are initiated as a result of missing persons and therefore we identify it as a critical relief requirement. Homelessness and population dispersion require personnel to be transferred from unstable to stable locations. Injuries, combined with a shortage of medical supplies and clinicians, generate a requirement for trauma teams supported by triage tents and operating rooms. The demand for fresh water increases sharply after a natural disaster which requires the availability of stocks of bottled water or some means of purification in the proximity of the affected area. The destruction of critical facilities and transportation infrastructure such as airports and public administration buildings generates a need for the construction of temporary structures to carry out the essential humanitarian operations. Because debris can hamper the speed and effectiveness of the relief effort there is often a requirement for engineering equipment such as heavy earth moving machinery. In addition to these relief requirements there will be a need for a strong and able workforce unaffected by the outcome of the disaster to conduct cleanup operations.
3. THE SUPPLY
Having discussed the needs in case of a disaster we now describe USN’s part in fulfilling some of these needs. The USN has two basic classes of ships available to conduct missions: combatant ships and noncombatant ships. Combatant ships are part of the USN and
noncombatant ships are part of the Military Sealift Command (MSC). The MSC has a rather unique reporting structure in its chain of command in that it reports to the commander of the USN Fleet Forces Command for Navy-specific missions, the commander of U.S. Transportation Command for the movement of Department of Defense items, and to the assistant secretary of the Navy for research, development and acquisition for anything related to procurement. In order to develop a comprehensive understanding of the capabilities of USN and MSC ships we
examined source documents on ships from multiple USN and MSC publications as well as the historical records of disasters and the response to those disasters by both organizations. Data supporting our analysis of the USN response to the three disasters was obtained from operational commander historical logs and archives, operational chronological records, operational orders, deployment orders, and daily situation reports. The result of our analysis is a detailed
9
inventory, and the relative degree to which these characteristics contribute to effective disaster response.
3.1 Mission Requests
The measure of a ship’s capability to conduct a specific HADR mission set is derived from the vessel’s specific characteristics. The USN and MSC have many different types of vessels with different capabilities that will be selected through a mission request process generated by the officers of the Navy. In order to understand which ships are better suited for HADR operations we first discuss the different types of missions that operational commanders may be requested to conduct. Mission requests may include aircraft support, amphibious landing, or fresh water production, as well as the ability to conduct towing or salvage operations. Table 2 lists the most common HADR mission requests. Fulfilling HADR mission requests have a high impact on relief efforts.
Table 2 Most Common HADR Mission Requests
Dry goods storage
Refrigerated goods storage Fresh water storage Roll On Roll Off (RORO) Fuel storage & dispensation
Self-sufficient; no need for external cran Aircraft support capability
Transit speed
Amphibious Landing Craft support
Hydrographic survey
Personnel support for cleanup and recovery efforts Berthing capacity
Medical support
Search and Rescue (SAR)
Salvage operations
Cargo
Towing
Personnel transfer Fresh water production
10
The specific characteristics of all USN and MSC vessels were drawn from public
databases such as Jane’s Fighting Ships (Jane’s, 2010), MSC Handbook (MSC, 2010), and the
online Navy Fact Files (www.navy.mil/navydata/fact.asp). These characteristics include speed, draft, lift capacity, number of onboard personnel, fresh water making capacity, storage space, and other traits that enable a ship to support one of the identified HADR missions
3.2 USN and MSC ship capabilities
We now identify the capabilities of various USN and MSC vessels and assess them in reference with HADR mission requests. Each ship class and its HADR related characteristics are broken down by platform, to include the various classes within the platform. The characteristics analyzed include only those characteristics applicable to HADR operations.
Not all of MSC’s vessels are government owned, nor are they all in a ready status. MSC is capable of leasing commercial ships, and maintains its own forces as well. A general
breakdown of MSC vessel types includes: Naval fleet auxiliary forces which supply USN ships at sea, special mission ships which perform a variety of missions, prepositioning ships which enable strategic placement of military supplies in key areas of the ocean, and sealift ships which provide ocean transportation for equipment and supplies (MSC, 2010).
For classification purposes, we have divided MSC ships according to their program designation. The most beneficial aspects of the MSC fleet are the ability to carry large amounts of cargo to a disaster area, and the ability to provide significant medical support. Beyond cargo capacity, we looked at the benefits of MSC ships being self-sustaining, in terms of their
capability of on-loading and off-loading cargo without the assistance of outside equipment. Landing craft serve as the waterborne transportation link between amphibious platforms and the shore. In HADR operations landing craft play the critical role of getting supplies, cargo, and personnel to and from the shoreline and supporting ships. While USN landing craft were not designed for HADR operations, they are valuable assets that are capable of supporting the
mission because of their lift capacity, draft, speed, and range.
When considering specific vessels, the seaborne aircraft that may be embarked upon them constitute a key facet of their capability. Seaborne aircraft include all helicopters and fixed wing aircraft that may be utilized by USN and MSC ships. Among the fixed-wing aircraft the USN has in its fleet only the MV-22 Osprey was considered for this study. Most military
fixed-11
wing aircraft that play any significant role in HADR operations are characteristically too large to land onboard any USN or MSC vessel, and therefore play no role in determining the usefulness of different vessels. Aircraft were evaluated in terms of the capabilities they contributed to their sea-basing platform and these were primarily lift capability, personnel transportation capability, and range.
12
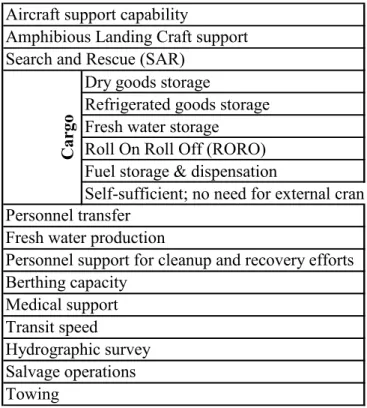
Table 3 [Continued] Capability Parameter Definitions for HADR Missions
Capability Rating Defnition No embarked helo; unable to support helicopter operations
Single helo embarked; able to support the majority of helo platforms
Multiple helos embarked; able to sustain multiple flight operations simultaneously No ability to support landing craft
Some ability to support landing craft
Landing craft embarked; able to load / off load cargo and store amphibious vehicles No embarked helo; unable to efficiently conduct SAR missions
Single embarked helo with communication equipment and night vision Multiple helos embarked with communication equipment and night vision Dry goods storage
Refrigerated goods storage Fresh water storage Roll On Roll Off
Fuel storage & dispensation Self-sufficient
No ability to support personnel transfer; slow speed vessel with deep draft Ability to support personnel transfer for 15+ personnel
High speed, shallow draft vessel with ability to transport 30+ personnel per voyage No ability to produce freshwater beyond shipboard usage
Ability to produce and transfer >2,000 gallons per day (gpd) beyond shipboard usage Able to produce and transfer > 5,000 gpd beyond shipboard usage
Low crew size with minimal ability to support HADR mission (< 50 personnel) Medium size crew which can support HADR mission (51 - 200 personnel) Large crew with ability to support HADR mission (> 200 personnel) Little to no excess berthing or facilities (< 30 racks)
Some excess berthing and facilities (31-50 racks) Large number of excess berthing and facilities (> 50)
No ability to conduct inpatient medical treatment; no Medical officer embarked Some medical support onboard; ability to support minor medical procedures Medical officer embarked; ability to perform surgeries and hold several patients 0-18 knots max speed
19-24 knots max speed 25 + knots max speed
No ability to conduct hydrographic surveys
Some ability to conduct hydrographic surveys to include soundings and chart building Able to conduct hydrographic surveying, soundings and chart development
No ability to conduct salvage operations
Some ability to conduct lift and salvage operations in shallow waters Able to conduct heavy lift and deep water salvage operations Aircraft support
Landing Craft support
Search and Rescue (SAR)
Car
go Capa
city
Hydrographic survey
Salvage Ops
0No ability to store goods beyond current ship crew use
1Ability to store supplies beyond ship crew's use
2Ability to store and transfer large quantities of supplies
Personnel transfer
Fresh water production
Personnel support
Berthing capacity
Medical support
13
We compare capabilities of USN and MSC platforms to basic mission requests to identify which USN and MSC vessels are best suited to satisfy the relief requirements. We evaluate the relative utility of each vessel type using ordinally scaled expert ratings which were assigned by USN surface warfare officers. The ordinal ratings have three values indicating whether a ship has “little to no capability” [], “some capability” [] or “significant capability”
[] to accomplish a specific mission requests. The three rating values for each of the capabilities
for HADR mission requests and their operational definitions are given in Table 3.
3.3 USN and MSC ship platforms
The USN vessels (some examples shown in Figure 3) are displayed in four categories in Table 4: 1) nuclear powered aircraft carriers (Nimitz and Enterprise class), 2) amphibious ships, 3) cruisers and destroyers (CRUDES), and 4) other which include the littoral combat ships, patrol craft, and mine countermeasures ships.
MSC vessels are arranged in five categories in Table 5 that correspond to the different commands within the organization: 1) vessels that are part of the Naval fleet auxiliary force, 2) special mission ships, 3) prepositioning ships, 4) sealift ships, and 5) Ready reserve force vessels.
Figure 3 Amphibious Assault Ship, Hospital Ship, and Roll-on/Roll-off Ship
Capability Rating Defnition No ability to conduct towing operations
Ability to conduct emergency towing operations
Designed to conduct push, pull, or alongside towing operations 0-18 knots max speed
19-24 knots max speed 25 + knots max speed
No ability to conduct hydrographic surveys
Some ability to conduct hydrographic surveys to include soundings and chart building Able to conduct hydrographic surveying, soundings and chart development
No ability to conduct salvage operations
Some ability to conduct lift and salvage operations in shallow waters Able to conduct heavy lift and deep water salvage operations No ability to conduct towing operations
Ability to conduct emergency towing operations
Designed to conduct push, pull, or alongside towing operations Transit speed
Hydrographic survey
Salvage Ops
Towing Towing
14
For MSC, type one (Naval fleet auxiliary force) vessels are made up of fleet
replenishment oilers, dry cargo and ammunition ships, and rescue and salvage ships, fleet ocean tugs, and hospital ships. The special mission ships (type 2) are comprised of a command ship, submarine tenders, ocean surveillance and survey, missile range instrumentation, and cable repair. Type 3, the prepositioning ships include large, medium-speed roll-on/roll-off vessels, maritime prepositioning ships capable of loading and unloading containerized cargo without the aid of dockside cranes as well as accommodating roll-on/roll-off cargo such as vehicles, offshore petroleum discharge ships, break-bulk ships for non-containerized cargo, and high-speed vessels which are high-speed catamarans capable of transporting personnel or equipment. The vessels, part of the sealift program, include large, medium-speed roll-on/roll-off vessels, common use tankers, dry cargo ships, and arctic tankers. The last type, Ready reserve force ships include roll-on/roll-off ships, crane ships, lighterage-aboard ships which function as floating barges and are critical for moving cargo ashore where infrastructure has been damaged, destroyed or is non-existent, and aviation logistics support vessels.
Our evaluation of each of the USN and MSC vessel type in terms of its ability to conduct HADR missions is described in tables 4 and 5. These tables display the expert ratings of the HADR mission capabilities of each USN and MSC ship type. From these tables we can identify those ships that have consistently high levels of capability with respect to HADR mission capabilities by identifying the rows of full circles (encircled in the tables).
15
Table 4 USN Platforms to Capability Comparison
LPD: amphibious transport dock, LSD: dock landing ship, CG: cruisers, DDG: guided missile destroyers, LCS: littoral combat ships, PC: patrol craft, MCM: mine countermeasures
4. OBSERVATIONS
We now offer our observations based on the data collected and analyzed for USN as well as MSC assets. These observations focus on timing capabilities in addition to type of vessels deployed based on our synthesis of the USN’s assets-suitability in HADR mission. In this section we also offer an overview in terms of the bigger picture.
4.1 USN Vessels
The results of the expert ratings of ships to deliver HADR mission capabilities show that the USN (Table 4)has significant cargo transfer capabilities as a result of the large numbers of helicopters and landing craft that may be deployed, the ability to bring large numbers of trained personnel to a disaster scene to assist with rescue, berthing space for temporary housing, and the capacity to provide medical services that would be found in any tier one U.S. hospital. The
D ry goo ds s to rag e R ef ri ger at ed g oo ds s tor age F res h w at er s to rag e R oll O n R oll O ff F uel s to rag e & di sp ens at io n S elf S uf fic ie nt Nuclear
Carriers CVN (Nimitz & Enterprise) 2 0 2 1 1 1 0 1 1 2 1 2 2 2 2 0 0 0
amphibious assault ships 2 2 2 1 1 1 0 1 1 2 1 2 2 2 1 0 0 0
amphibious assault ships 2 2 2 1 1 1 0 1 1 2 1 2 2 2 1 0 0 0
amphibious command ships 1 0 1 1 0 0 0 0 0 1 0 1 1 1 1 0 0 0
LPD (San Antonio) 2 2 2 1 0 0 0 0 1 1 0 1 1 1 1 0 0 0 LPD (Austin) 2 2 2 1 0 0 0 0 1 1 0 1 1 1 1 0 0 0 LSD (Harpers Ferry) 2 2 2 1 0 0 0 0 1 1 0 1 1 1 1 0 0 0 LSD (Whidby Island) 2 2 2 1 0 0 0 0 1 1 0 1 1 1 1 0 0 0 cruisers 1 0 1 0 0 0 0 0 0 1 0 1 0 0 2 0 0 1 DDG (FLT I & II) 0 0 0 0 0 0 0 0 0 0 0 1 0 0 2 0 0 1 DDG (FLT IIA) 1 0 1 0 0 0 0 0 0 1 0 1 0 0 2 0 0 1 Frigates 1 0 1 0 0 0 0 0 0 1 0 1 0 0 2 0 0 1 LCS (Freedom) 1 0 1 0 0 0 0 0 0 1 0 0 0 0 2 0 0 1 LCS (Independence) 1 0 1 0 0 0 0 0 0 1 0 0 0 0 2 0 0 1 PC 1 0 1 0 0 0 0 0 0 1 0 0 0 0 2 0 0 1 MCM 0 0 0 0 0 0 0 0 0 0 0 0 0 0 0 0 0 2 Capabilities A irc ra ft s up po rt L and in g C ra ft s upp or t S ear ch an d R es cue ( S A R ) Cargo Capacity P er so nn el tr an sf er Fr es hw at er Pr od uc tion P er so nnel s upp or t B er th ing capac ity U. S . Na vy S h ip s M ed ical s upp or t T rans it s peed H ydr og ra ph ic s ur ve y S al vage O per at io ns To w in g A m phi bi ous Shi ps C rui se rs a nd De st ro ye rs Ot he r
16
amphibious assault ships have consistently high levels of capability to conduct HADR missions. Such ships may accommodate large numbers of helicopters, support continuous air operations (such as search and rescue), accommodate large numbers of personnel and have medical and surgical capabilities aboard to include operating rooms, x-ray capabilities, and a 1,000-unit blood bank. Additionally, amphibious assault ships have approximately 2,000 marines embarked who may be deployed to provide security and assistance to the affected area.
The results also show the limitations of cruisers and destroyers, patrol craft and the littoral combat ship. In general, these ships are capable of traversing the oceans at high speeds but have very few of the other capabilities that are critical to HADR missions. The CRUDES vessels that have embarked helicopters (Cruisers, Flight IIA Destroyers, and Frigates) may provide some aircraft support, search and rescue capability, and personnel transfer capability. However, without an embarked helicopter the CRUDES class of vessels is limited in their contribution to HADR missions.
4.2 MSC Vessels
The major advantage of the MSC fleet is its ability to carry large quantities of cargo to and from the disaster region (see Table 5). The MSC fleet is designed to provide supplies to the military and it is therefore no surprise that these ships are extremely capable in terms of
supporting HADR missions. In addition to its cargo capabilities, the MSC also has two hospital ships in its inventory which provide high levels of medical support. In addition to their ability to provide tier 1 medical capabilities, the hospital ships have significant berthing capacity, large numbers of trained personnel, and the ability to produce fresh water.
While MSC is substantially capable of bringing supplies to the disaster region, it is limited in its ability to conduct other HADR missions. Very few MSC vessels have embarked helicopters and they are therefore marginally capable at conducting search and rescue missions or aircraft support. Another aspect of the MSC fleet is that the ship’s crews are small with the majority being civilian mariners. The small crews do not allow for a significant level of
personnel support during HADR missions and beyond the hospital ships, the MSC fleet does not have any capability to conduct medical support.
17
Table 5 MSC Platforms to Capability Comparison
4.3 Timing of Capabilities
An important aspect of the understanding of the demand-supply picture is when the need arises and when it is fulfilled. In order to understand how U.S Navy HADR capabilities have
D ry good s st or ag e R ef ri ger at ed g oo ds s to rage F res h w at er s to rag e R ol l O n R ol l O ff F uel s to rag e & di sp en sa tio n Se lf Su ff ic ie nt
T-AOE: fast combat support ships 1 0 0 2 2 2 0 2 1 0 0 0 0 0 2 0 0 0 T-AO: fleet replenishment oilers 1 0 0 2 2 2 0 2 1 0 0 0 0 0 1 0 0 0 T-AE: dry cargo and ammunition ships 1 0 0 2 0 1 0 2 1 0 0 0 0 0 1 0 0 0 T-AKE: dry cargo and ammunition ships 1 0 0 2 2 1 0 2 1 0 0 0 0 0 1 0 0 0 T-ARS: rescue and salvage ships 0 0 0 0 0 0 0 0 2 0 0 0 0 0 0 0 2 2 T-ATF: fleet ocean tugs 0 0 0 0 0 0 0 0 1 0 0 0 0 0 0 0 1 2 T-AH: hospital ships 1 0 0 0 0 0 0 0 0 1 2 2 2 2 0 0 0 0 LCC: command ship 1 0 1 1 0 0 0 0 0 1 0 1 1 1 1 0 0 0 AS: submarine tenders 0 0 0 0 0 0 0 0 1 0 0 1 0 0 1 0 0 1 T-AGOS: ocean surveillance and survey 0 0 0 0 0 0 0 0 0 0 0 0 0 0 0 1 0 1 T-AGS: ocean surveillance and survey 0 0 0 0 0 0 0 0 0 0 0 0 0 0 0 2 2 2 T-AGS: ocean surveillance and survey 0 0 0 0 0 0 0 0 0 0 0 0 0 0 0 0 0 0 T-AGM: missile range instrumentation 0 0 0 0 0 0 0 0 0 0 0 0 0 0 0 0 0 0 T-ARC: cable repair 0 0 0 0 0 0 0 0 0 0 0 0 0 0 0 1 0 1 LMSR: roll-on/roll-off vessels 1 0 0 2 2 2 2 2 2 0 1 0 1 0 1 0 0 0 MPS: roll-on/roll-off cargo such as vehicles 1 0 0 2 2 2 2 2 2 0 0 0 1 0 1 0 0 0 MPF: loading and unloading Container cargos 1 0 0 2 2 2 0 2 2 0 0 0 1 0 1 0 0 0 T-AOT: fleet replenishment tankers 0 0 0 0 0 0 0 2 2 0 0 0 0 0 0 0 0 0 T-AK (USAF): container, roll-on roll-off ships 1 0 0 2 2 2 0 2 2 0 0 0 1 0 1 0 0 0 T-AK (USA): container, roll-on roll-off ships 1 0 0 2 2 2 0 2 2 0 0 0 1 0 1 0 0 0 T-AVB: aviation logistics support ships 1 0 0 2 2 2 0 2 2 0 0 0 1 0 1 0 0 0 OPDS: offshore petroleum discharge ships 0 0 0 0 0 0 0 0 0 0 0 0 0 0 0 0 0 0
Break-Bulk 1 0 0 1 1 1 0 0 2 0 0 0 0 0 0 0 0 0
HSV: high-speed vessels 0 0 0 0 0 0 0 0 0 2 0 0 0 0 2 0 0 0 LMSR: roll-on/roll-off vessels 1 0 0 2 2 2 2 2 2 0 1 0 1 0 1 0 0 0 T-5: arctic tankers 0 0 0 0 0 0 0 2 2 0 0 0 0 0 0 0 0 0 Common Use Tanker 0 0 0 1 1 2 0 2 1 0 0 0 0 0 0 0 0 0
Dry Cargo 0 0 0 2 2 1 0 1 2 0 0 0 0 0 0 0 0 0
Fast Sealift Ship 1 0 0 2 2 2 0 2 1 0 0 0 0 0 2 0 0 0
RO/RO ships 1 0 0 2 2 2 2 2 2 0 1 0 1 0 1 0 0 0
Crane Ships 0 0 0 2 2 1 0 1 2 0 0 0 0 0 0 0 0 0
Lighterage-aboard ships 0 0 0 2 2 1 0 1 2 0 0 0 0 0 0 0 0 0 OPDT: offshore petroleum discharge tankers 0 0 0 0 0 0 0 2 2 0 0 0 0 0 0 0 0 0 Break-Bulk Ships 1 0 0 1 1 1 0 0 2 0 0 0 0 0 0 0 0 0 Avaition Logistics Support 1 0 0 2 2 2 0 2 2 0 0 0 1 0 1 0 0 0
M ili ta ry S ea lift C omma n d (M S C ) S h ip s R ea dy R es erv e F orce Me di ca l su pp or t B er thi ng c ap aci ty Sp ec ia l Mi ss io n Shi ps N aval F le et A uxi li ar y Fo rc e P re po si ti oni ng Shi ps Se al if t Shi ps A ircra ft s up po rt L andi ng C ra ft s upp or t To w in g Cargo Capacity P er son ne l t ran sf er F res hw at er P ro du ct ion P er son ne l s up por t Capabilities T ran si t sp ee d H ydr og ra ph ic s ur vey S al vag e O per at io ns S ear ch an d R es cu e
18
been deployed in the past, as well as the types and levels of capability provided, we collected data about “on-scene” arrival of every ship that was deployed to respond to the 2004 Indian Ocean tsunami, the 2005 Hurricane Katrina, and the 2010 Haiti Earthquake.
Using the capability parameters given in Tables 4 and 5, we assign each ship a capability value of 0 if it possessed little-to-no capability of performing a mission, a value of 1 if it had some capability, and a value of 2 if it was significantly capable of performing a mission. It is important to recognize that there is a great deal of difference between a ship with no landing craft support capability (0) and a ship with some capability (1). However, the difference between a ship with some capability (1) and a ship with significant capability (2) is much less.
For each day of the disaster response by USN and MSC we summed all capability values
from ships that were present on the scene to arrive at a cumulative HADR capability value. The
cumulative HADR capability value is a measure of the total volume of disaster relief capability that is on-station in the disaster zone at a given time. Such measures of benefit rendered by a
specific ship are in common use for Navy scheduling (see Brown et al., 1990; Dugan, 2007;
Silva, 2009; Hallman, 2009). For example, if only one ship was present during the disaster response, and it had a mission capability of 1 for Aircraft Support, then the mission’s cumulative capability for that day was 1. If another ship was present, with a mission capability score of 2 for Aircraft Support, then the mission’s cumulative capability for that day would be 3. We used cumulative capability for each day and each mission to analyze response patterns and present it in Figure 4. The cumulative capabilities include critical supplies (fuel, dry and refrigerated goods, fresh water production, fresh water cargo), transportation and rescue (aircraft support, search and rescue, landing craft support, personnel transfer) and medical and shelter care
(berthing capacity, medical support). In addition to these cumulative capability values, depicting the fulfillment of relief requirements, timing of such delivery which is of critical importance is illustrated along a timeline in Figure 4. We found that USN delivered relief peaked from about day 10 through day 35.
Indian Ocean Tsunami: It can be seen that the response to the Indian Ocean tsunami
lasted 81 days and that the first substantial increase in composite capability occurred
19
completed by Day 41. The peak of cumulative capability occurred on Day 24 of the response effort, and the peak range of support occurred from Day 15 to Day 35. Our data (not given here for brevity) suggested that the mission that received the most support was critical supplies. The least support was received by medical and shelter care.
Figure 4 Cumulative HADR Capabilities for Three Disasters
Hurricane Katrina:The response to Hurricane Katrina lasted 42 days and the first
substantial increase in composite capability occurred about two weeks into the effort. Nearly all USN and MSC support for the response effort was complete by Day 38. The peak of cumulative mission composite capacity of the response occurred on Day 17 of the response effort and the peak range of support occurred from Day 10 to Day 23. In this case too, our data (not given here for brevity) suggested that the mission that received the most support was critical supplies. The least support was received by medical and shelter care.
Haiti Earthquake: The USN response to the Haiti earthquake lasted 72 days. Nearly all
USN and MSC support for the response effort was complete by Day 41. The first substantial increase in composite capability occurred about two weeks into the effort. The peak cumulative
0 50 100 150 200 250 1 3 5 7 9 11 13 15 17 19 21 23 25 27 29 31 33 35 37 39 41 43 45 47 49 51 53 55 57 59 61 63 65 67 69 71 73 75 77 79 81
Day of Disaster Response
Unified Assistance, IO Tsunami JTF Katrina Unified Response, Haiti C u m u l a t i v e C a p a b i l i t y
20
mission composite capacity of the response occurred on Day 19 the peak range of support occurred from Day 12 to Day 28. The support for all missions in this case was on a higher scale than the previous cases. Our data (not given here for brevity) suggested that the peak for medical and shelter care support is maximum here which is about ten times more than in Tsunami and five times more in Katrina. Both critical supplies and transportation and rescue support are the least here but still are much more than the other two cases.
It is interesting to note that there was no support during response to Katrina from Day 25-28. The sharp drop in support is the result of Hurricane Rita, which caused most ships to get underway and out of the area to avoid damage. The presence, and therefore quick response, of the Minesweepers stationed in Texas, combined with the need to corral oil rigs knocked adrift in both hurricanes, created an opportunity for use of a vessel type that we did not identify as
particularly useful for HADR operations. The USN and MSC response to Hurricane Katrina was quickly truncated rather than tapered down due to the large presence of the Department of State and non-governmental agencies who were able to assume roles originally filled by the military, as well as a strong desire to push management of the disaster to local levels (CRS, 2005).
4.4 Comparison of Disaster Responses
Our data also yielded the number of ships that responded to the disasters discussed. The fewest number of ships used in any of the three disaster responses discussed was 29 and the largest was 34. Overall, the numbers of ships deployed by the USN and MSC were consistent with the MSC providing more ships for each disaster. Studying the details of the three missions, critical supplies, transportation and rescue, and medical and shelter, we observed that MSC’s dry goods cargo and self-sufficient cargo handling vessels were among the top five most supported mission capabilities in all three disaster responses. Aircraft support, fuel cargo and fresh water cargo appeared in the top five for two responses each. Berthing capacity, provided by an MSC Hospital Ship (and leased cruise liners in the case of the Hurricane Katrina response), search and rescue, and personnel support (best provided by a USN large deck ship such as an amphibious assault or aircraft carrier) missions (in the Haiti earthquake response) only received “top five” support once among all three disasters. MSC consistently provided ships to fill unforeseen needs, such as the rental of four entire cruise ships for berthing space during the Katrina response
21
(Inspector General, 2006), and three integrated tug and barge platforms for downloading cargo when responding to the earthquake in Haiti (Schulte, 2010).
4.5 Bigger Picture
For the additional reason of understanding the overall picture of the capabilities in HADR we graphed (Figure 4) the cumulative mission capability from all ships present in each HADR response. The graph illustrates that the USN and MSC provide significantly more cumulative capacity to HADR missions within two weeks of the event and then tapering off on or just before the fortieth day after the disaster event. Peak response efforts for each disaster occurred on Days 24 (Indian Ocean Tsunami), Day 17 (Katrina) and Day 19 (Haiti Earthquake). The beginning of the peak plateau of support occurred on Days 15, 10, and 12 and endings of peak plateau of support occurred on Days 35, 23 and 28, respectively. Typically, support is ramped up in the first two weeks of a response, and then begins to level out as it peaks, usually near the end of the third week.
Figure 5 Demand and Fulfillment
A free-hand curve is drawn to represent the basic shape of the relationship between cumulative capability and time in a USN and MSC disaster response effort, (maintaining the highest peak and overall trend) in Figure 4. The slope suggests a response reaching the highest
Time Fulfillment
by USN Demand
22
peak by day 19 and then tapering off. This general shape of USN and MSC support to HADR missions is consistent with the model described by Pettit and Beresford’s (2005) of emergency recovery that examined emergency relief operations in military and non-military circumstances. Figure 5 (derived from Figure 1 and Figure 4) shows the relation between the ‘when’ of the demand and supply, clearly showing the gap of pain due to lag in arrival of relief. However, it should be pointed out that the bulk of the core relief arrives relatively quickly, given the size of the fulfillment, and leaves fairly quickly.
5. ANALYSIS
The USN and MSC responses to the tsunami, hurricane, and earthquake were surprisingly consistent. One hospital ship was used in each of the disaster responses. More MSC vessels were sent to each disaster than USN vessels. The number of amphibious assets employed was usually much larger than cruisers and destroyers (CRUDES). The one instance where more CRUDES were sent than amphibious ships was when the Navy deployed an entire carrier strike group (CSG). However, since the 2004 tsunami, seemingly, the Navy has adopted a joint task force approach to HADR missions. One conclusion that can be drawn from the mission response
data represented in Figure 4 is that the USN and MSC typically arrive en masse two weeks into a
response effort, provides peak capability at three weeks. The capability rapidly declines as vessels are withdrawn during the close of an operation.
It is true that the degree of uncertainty that exists in both the disaster environment and the requirements assosciated with alleviating its effects greatly complicates the planning and
response process. Based upon our analysis of HADR capabilities we can make
recommendations with respect to task force composition, force structure and design of USN and MSC HADR responses that will be robust with respect to both the environment and the
requirements for assistance. Tables 4 and 5 may be used to determine which vessels have the greatest utility when conducting HADR missions, and what combination of vessels are required to cover the full range of missions which HADR operations require. Our analysis indicates that amphibious vessels typically have the greatest utility with respect to conducting HADR
operations due to their embarked helicopter capabilities, landing craft, berthing and medical capacity. Our analysis has also shown the limitations of specific USN vessels when it comes to
23
conducting the full range of HADR missions. Based on our analysis we conclude that those vessels which can conduct lift operations should provide personnel to assist in disaster response, and provide medical services are best suited to conduct HADR missions while those vessels which are limited in their ability to conduct such missions are not well suited for HADR missions.
The USN fleet is comprised of carrier strike groups, expeditionary strike groups, amphibious ready groups, and submarine strike groups. These organizational structures were conceived in order to be effective in major war campaigns however they do not appear to be the best formations of vessels for responding to HADR operations. In the case of the 2004 Indian
Ocean tsunami, Operation Unified Assistance, the USN deployed full expeditionary strike
groups which resulted in tasking several CRUDES vessels to support the HADR mission. As discussed earlier, CRUDES vessels provide little assistance in HADR operations and therefore were being underutilized for their entire time on station.
For future HADR operations, it would be advisable for the combatant commanders to form a HADR Task Force comprised of amphibious vessels and MSC vessels. A Task Force should be able to conduct all required HADR missions with only the most effective platforms leaving other vessels free to perform other USN missions or training. Based upon Tables 4 and 5 we identify the specific vessel (classes) best suited for HADR operations that are supported by their respective capabilities. We believe that amphibious assault and transport dock ships need to be part of the ‘HADR flotilla’ because of their ability for search and rescue, aircraft and landing support, freshwater production, berthing capacity and medical support. Although nuclear
powered aircraft carriers have the ability to provide aircraft support, fresh water production, berthing capacity and medical support, these vessels primarily support fixed-wing fighter aircraft that do not have the same level of utility as vertical lift and rotary wing aircraft which are
abundant on amphibious assault ships. Though combat ships such as destroyers and cruisers can travel at high speeds they have less utility in the disaster zone because of they lack the ability to produce large amounts of fresh water, do not have excess food stores, and generally lack extra berthing capacity; these ships are particularly ill-suited to HADR missions if they lack an
24
capability, and hospital ships are also critical elements of an HADR flotilla because they have storage capacity and capabilities that other commercial and war ships lack.
The response to Hurricane Katrina provides an obvious caveat to our proposed force structure for HADR operations. The presence of nine mine countermeasures vessels in the Gulf of Mexico were capable of locating and corralling oil rigs that had broken free and were drifting in open water (USNORTHCOM, 2005). Another special consideration in HADR operations based on the 2011 Japan earthquake is the use of nuclear-reactor qualified personnel in gaining stability to the affected reactors. In this incident, we have an example of a very unique situation in which the USN played a vital role in assisting the affected population.
6. CONCLUSION
Providing appropriate humanitarian assistance and disaster relief requires understanding the needs of the affected population. In this research we proposed a list of relief requirements to that extent based on representative disasters. We described the capabilities of the USN as one of the suppliers of relief in disasters. More importantly, our data also illustrated when the relief was provided and shows the time lag in arrival of relief.
Through the details of the data collected we have identified the primary mission requests received by the USN and the MSC, and then rated each HADR mission capability provided by every ship in the USN and MSC inventory. We used the mission capabilities for each ship and combined them with the timeline of every ship deployed for each of the disasters (2004 Indian Ocean tsunami, 2005 hurricane Katrina, and 2010 Haiti earthquake) we studied. Based on this
we calculated a cumulativecapability that constitutes as an index of the relative HADR mission
capability that has been brought to bear to a disaster event.
A firm understanding of which vessels are most appropriate for use during disaster
response will help the USN as well as other military organizations make more effective decisions when considering the types of vessels it will procure in the future as well as in planning and executing humanitarian operations throughout the world. Though our particular analysis in this case study is focused on the USN, our methodology can be replicated by any organization wishing to support humanitarian operations. Such studies will be extremely beneficial in getting a clearer picture for ‘what’ and ‘when’ of demand in case of a disaster and supply for relief in
25
order to reduce the gap of pain. Such effort will also expose the issue of relief requirement in terms of ‘what’ and ‘when’ for all organizations for which the studies are carried out. This is important in the reduction of gap of pain since needs assessment is a critical issue which due to its complexity has not been adequately studied.
Limitations of this study can be exploited for future research. The rating system that was used to determine each ship’s capabilities can be parameterized in the future. Future research would develop measurement or rating systems that are valid and reliable across all types of vessels responding to disasters.
An analytical tool that will facilitate the reduction of the existing gap of pain is the
development of an optimization model based on the parameterized rating system that can provide a ‘Product-mix’ for the supply of relief through a portfolio of vessels in terms of best
composition for the future force structure. Such model would determine the optimal mix of ships based on capabilities as opposed to the proximity or availability of a ship. The model currently being developed is as follows: the objective is to reduce the gap of pain (by maximizing the available capabilities for relief requirements). The constraints result from issues such as budget/cost, availability of personnel, operational abilities.
26
REFERENCES
Apte, A. U. 2009. “Humanitarian logistics: A new field of research and action.” Foundations and
Trends in Technology, Information and Operations Management, 3(1), 1-99.
Aymat, J. 2010. Operation unified response:Joint task force—Haiti, D+37 brief. Unpublished
PowerPoint briefing at the Naval War College, Newport, RI.
Baker, S. F., D. P. Morton, R. E. Rosenthal, and L. M. Williams. 2002. “Optimizing Military Airlift.” Operations Research, 50, 582-602.
Barbarosoglu, G., L. Ozdamar, and A. Cevik. 2002. “An Interactive Approach for Hierarchical
Analysis of Helicopter Logistics in Disaster Relief Operations.” European Journal of
Operational Research, 140, 118-133.
Brown, G., Goodman, C., and Wood, K. 1989. “Annual Scheduling of Atlantic Fleet Naval
Combatants,” Operations Research 38, pp. 249-259.
Congressional Research Service (CRS). 2005. Hurricane Katrina: DoD disaster response
(RL33095). Retrieved from Federation of American Scientists website:
http://www.fas.org
Cuculo, A. 2006. National response to catastrophic events: Applied lessons for consequence
management. PowerPoint briefing presented at the meeting of Joint Center for
Operational Analysis, Colorado Springs, CO.
Department of the Navy (DoN). 2010. Naval operations concept, implementing the maritime
strategy. Retrieved from http://www.navy.mil/maritime/noc/NOC2010.pdf
Dugan, K. 2007. “Navy Mission Planner.” MS Thesis in Operations Research,
27
Elleman, B. A. 2007. “Waves of hope: The U.S. Navy’s response to the tsunami in northern Indonesia.” Newport, RI: Naval War College Press.
EM-DAT. 2011. The international disaster database. Retrieved from
http://www.emdat.be/database
Hale, T. and C. R. Moberg. 2005. “Improving Supply Chain Disaster Preparedness: A Decision Process for Secure Site Location.” International Journal of Physical Distribution &
Logistics Management 35 No. 3, 195-207.
Hallmann, F. 2009. “Optimizing Operational and Logistical Planning in a Theater of
Operations.” MS Thesis in Operations Research, Naval Postgraduate School, Monterey,
CA.
Hoffman, W. 2006. “Building Relief Networks Fritz Institute, American Logistics Aid Network look for better ways to support disaster relief efforts.” Traffic World, 17.
Inspector General, U.S. Department of Homeland Security. 2006, February 16. Management
advisory report on the acquisition of cruise ships for Hurricane Katrina evacuees (Report
Number GC-HQ-06-11) [Memorandum]. Retrieved from
http://www.dhs.gov/xoig/assets/katovrsght/OIG_GC_HQ_06-11.pdf
Jane’s. 2010. Jane’s fighting ships: The authority on the world’s navies. Retrieved from
http://jfs.janes.com/public/jfs/ind’ex.shtml
McCoy J. H., 2008. “Humanitarian response: Improving logistics to save lives,” American
Journal of Disaster Medicine, 3(5), 283-293.
Military Sealift Command (MSC). 2010. The U.S. Navy’s Military Sealift Command handbook
28
National Oceanic Atmospheric Administration Public Affairs. 2007, February 12. Hurricane
Katrina. Retrieved from http://www.katrina.noaa.gov
Pettit, S. J., & Beresford, A. K. 2005. “Emergency relief logistics: An evaluation of military,
non-military and composite response models.” International Journal of Logistics:
Research and Applications, 8(4), 313–331.
Plyer, A. 2010. Facts for features: Hurricane Katrina impact. Retrieved from the Greater New Orleans Community Data Center website:
http://www.gnocdc.org/Factsforfeatures/HurricaneKatrinaImpact/index.html
Schulte, A. 2010. Henson clears path for Haiti. Sealift. Retrieved from
http://www.msc.navy.mil/sealift
Semilla, F. 2011. Contingency Operations Officer, Pacific Fleet, United States Navy. Private
Communication.
Silva, R. A. 2009. “Optimizing Multi-Ship, Multi-Mission Operational Planning for
the Joint Force Maritime Component Commander.” MS Thesis in Operations Research,
Naval Post Graduate School, Monterey, CA.
United States Northern Command (USNORTHCOM). 2005. USNORTHCOM Hurricane
Katrina timeline [Draft]. Retrieved http://www.northcom.mil/FOIA
Wooldridge, M. 2010. Haiti will not die, President Rene Preval insists. Retrieved from BBC
News website: http://news.bbc.co.uk/2/hi/americas/8511997.stm
Yi, W. and L. Ozdamar. 2007. “A Dynamic Logistics Coordination Model for Evacuation and
Support in Disaster Response Activities.” European Journal of Operational Research,


![Table 3 [Continued] Capability Parameter Definitions for HADR Missions](https://thumb-us.123doks.com/thumbv2/123dok_us/1318390.2676219/12.918.170.863.96.947/table-continued-capability-parameter-definitions-hadr-missions.webp)