Economic centrality, per capita income and human capital – some results at regional level1
Nuno Crespo (ISCTE-University Institute for Social Sciences, Business Studies and Technology)
and
Maria Paula Fontoura (ISEG/CISEP -Technical University of Lisbon)
Abstract:
It has been shown that countries located further from global economic activity will have lower levels of per capita income and human capital. We evaluate, for the Portuguese case, the validity of the positive relationship of economic centrality with per capita income and with human capital at the regional level (275 regions). Results show that more central regions - in terms of proximity to the location of the economic activity - appear to have higher levels of per capita income and human capital. Some regions suffer a permanent penalty resulting from their disadvantage as regards the relative geographical position.
Keywords: economic centrality, economic geography, income per capita, human capital. JEL Codes: O10, O18.
Corresponding Author: Maria Paula Fontoura ISEG
Rua Miguel Lúpi, 20 1200-781 Lisboa, Portugal fontoura@iseg.utl.pt
1
Economic centrality, per capita income and human capital - some results at regional level
1. Introduction
In the recent papers of Redding and Venables (2004) and Redding and Schott (2003) it is shown theoretically that countries more distant from global economic activity will have lower levels of per capita income and human capital, respectively. The empirical tests presented in these studies are favourable to the theoretical relationship in both cases.
Commenting their own results, Redding and Schott (2003) point out that «potentially fruitful avenues for further inquiry include looking for a similar relationship across regions within countries» (Redding e Schott, 2003, p. 537). In this paper, we follow this research line and, with data for the Portuguese economy at the level of concelhos (275 regions), we evaluate the validity of the positive relationship of economic centrality with per capita income and with human capital.
The paper is organised as follows. Section 2 briefly summarises the theoretical arguments concerning the impact of the economic centrality on the per capita income and the human capital levels. Section 3 presents the data and the results, at regional level, for the Portuguese case. Section 4 concludes.
2. The theoretical argument
In the context of an economic geography model, Redding and Venables (2004) establish the relationship between the centrality level of the countries (expressed as proximity to the markets and the suppliers of intermediate goods) and the level of per capita income. In the case of less central countries, the transport costs – in their broad meaning, including trade barriers – are higher, implying that firms in those countries pay lower wages as the proportion of value added left to the remuneration of production factors is smaller.
Following a similar approach, Redding and Schott (2003) establish a relationship between the centrality level of the countries and their educational level. As in Redding and Venables (2004), less central countries pay higher transport costs and the labour remuneration is lower. If manufactured goods are relatively skill-intensive and face relatively large transport costs, significant returns to scale (meaning that proximity to large markets is especially important) or widespread input-output linkages (implying that trade costs must be paid on both imported intermediates and exported output), it is shown that physical
remoteness as regards the centre of economic activity depresses the skill premium and reduces therefore the incentive to the accumulation of human capital.
In the context of Redding and Schott (2003)’ model, each individual has one unit of labour which, at the initial moment, is unskilled. The individuals choose endogenously between becoming skilled or not. In order to be skilled, they incur in an education cost which is a function of the institutional context, the government policies and the individuals’ own ability. They will prefer to become skilled if the wage differential between skilled and unskilled workers exceeds the education cost. As countries locate further from global economic activity, the critical level above which workers decide to become skilled increases, since the differential between skilled and unskilled wages decreases. The conclusion to be retained is that remoteness limits the accumulation of human capital and reduces the supply of skilled labour. This factor amplifies consequently the negative effect on the per capita income.
3. The empirical evaluation
In this section, we evaluate at the regional level the validity of the relationships established at the country level by Redding and Schott (2003) and Redding and Venables (2004).
Aiming a more direct comparison of the results obtained with those at the country level, we adopt a specification based on the ones used in the two above mentioned studies, which consists on regressing the variable which we are testing (the income per capita or the education level) on the economic centrality of the regions.
The statistical information for the Portuguese economy excludes Madeira and Azores. In what concerns the spatial unit of reference, we consider the concelhos level, which means, in the Portuguese case, 275 regions (with an average area of 323.79Km2).
For this analysis we need to obtain a measure of the economic centrality of the regions (concelhos). Several ways have been used to quantify the centrality level.2 In the present case, we use the most widespread approach (the gravitational one), according to which the economic centrality of a region is associated to the “centre of gravity” of the economic activity, varying positively with its “mass” or volume and that of the other regions and negatively with the area of the region itself and with its distance to the other regions. The study of Keeble et al. (1988) – the most quoted in this context – adopts the following index:
2
N
Pi = (Mi /
δ
ii)+∑
Mh /
δ
ih , h ≠ ih=1
where Pi reflects the accessibility of region i, M represents the variable which quantifies the
“mass” (economic activity) of the regions and δ is the regional distance (inter or intra). This index is not a direct measure of the centrality of the regions as it considers absolute values, and for that reason it is usually converted into a 0-100 scale. To overcome this limitation, we propose the following alternative index, which directly evaluates the centrality level of a region:
N
C
i= l
i/
δ
ii+
∑
l
h/
δ
ih,
h ≠ i h=1where li and lh (h = 1, 2, …, N) represent, respectively, the share of total economic activity
located in the region i and in each one of the remaining regions.
Ci is calculated for each one of the 275 Portuguese concelhos. Economic activity (M)
includes the manufacturing industry and the services sectors and it is measured in terms of employment. Employment data is taken from Ministry of Employment. Inter and intra-regional distances between all concelhos -75350 bilateral distances and 275 internal distances - are obtained both in kilometres (km) and in minutes (min). These distances are given by the program ROUTE 66. In what concerns distances in time terms, this program considers the time needed to travel that distance by car, taking into consideration the characteristics of the different roads (based on speeds pre-defined by the program). Following Keeble et al. (1982, 1988) and Brülhart (2001), we link the internal distance of the region to its area, by considering the formula δii = 1/3 (ψi/π)1/2, where ψi corresponds to the area of i.3
The level of education (edu) is measured by the share of population residing in each
concelho with a minimum of 9 years of education. Information concerning the educational level is based on data from Censos (2001). GDP per capita (gdppc)is taken from Ramos
(1998) and refers to 1994.
Limited by the periods for which we have information for edu and gdppc, the
dimension of the economic activity (M) is evaluated with data for 1995 in the case of the analysis of the impact on GDP per capita and with data for 2000 concerning the impact on human capital.
3
As a result of an intense debate on this question, namely in the context of the “border effects” literature, there is, nowadays, a wide range of measures of intra-regional distances. For a survey on this topic, see Head and Mayer (2002).
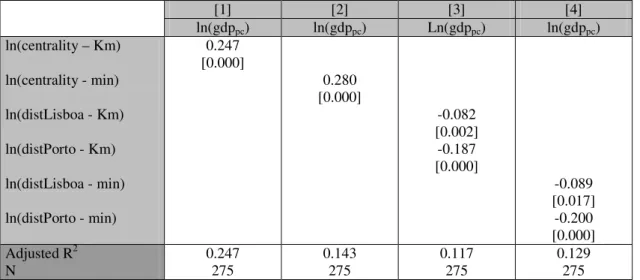
Table 1 presents the results for the regressions which evaluate the impact of economic centrality (Ci) on per capita income. We also considered, in alternative to Ci, the distances of
each region to the two main areas of economic activity concentration (Lisboa and Porto), both in kilometres (km) and in minutes (min).
Table 1 – Centrality and per capita income
[1] [2] [3] [4] ln(gdppc) ln(gdppc) Ln(gdppc) ln(gdppc) ln(centrality – Km) ln(centrality - min) ln(distLisboa - Km) ln(distPorto - Km) ln(distLisboa - min) ln(distPorto - min) 0.247 [0.000] 0.280 [0.000] -0.082 [0.002] -0.187 [0.000] -0.089 [0.017] -0.200 [0.000] Adjusted R2 N 0.247 275 0.143 275 0.117 275 0.129 275 Note: p-values between parentheses
As it is shown in Table 1, the expected positive relationship between economic centrality and per capita income is clearly confirmed by the results of regressions [1] and [2]. Furthermore, when, alternatively, the proximity of each region to the location of the economic activity is measured, in a more simplified way, by the distances to Lisboa and Porto, the expected influence - in this case reflected in a negative sign of the coefficients associated to those variables - is also confirmed (regressions [3] and [4]). The relationship found by Redding and Venables (2004) at the country level appears thus to be valid also at the regional level in the Portuguese case.
Let us now analyse the relationship between economic centrality and the educational level. Since the share of the population with a higher level of education - previously defined - is bounded between 0 and 1, we use a logistic transformation. Table 2 shows the results concerning the influence of economic centrality on the educational level of the Portuguese
concelhos. Once more we have also considered the distance measured in relation to Lisboa and Porto.
Table 2 – Centrality and education level
[1] [2] [3] [4]
Ln (edu/(1-edu)) ln (edu/(1-edu)) ln (edu/(1-edu)) ln (edu/(1-edu)) ln(centrality –Km) ln(centrality-min) ln(distLisboa - Km) ln(distPorto - Km) ln(distLisboa - min) ln(distPorto - min) 0.370 [0.000] 0.432 [0.000] -0.346 [0.000] -0.087 [0.017] -0.377 [0.000] -0.091 [0.017] Adjusted R2 N 0.238 275 0.274 275 0.329 275 0.359 275 Note: p-values between parentheses
The evidence presented in Table 2 points to the confirmation at the regional level of the results obtained at the country level by Redding and Schott (2003): economic centrality is positively related to educational attainment and consequently to human capital accumulation. The negative coefficient when we consider the distance to the main economic centres (Lisboa and Porto) is a confirmation of that relation. It is therefore suggested that the differences in the centrality level of the regions help to explain their divergence in terms of income per capita and human capital.
It is interesting to note that the results obtained in the analysis we have performed are influenced not only by the distribution of economic activity but also by the relative geographical position of the regions, as it is obvious from the expression of Ci. In fact, even if
the economic activity was evenly distributed, concelhos would have distinct levels of centrality.
A simple way to illustrate how relevant are differences in the geographical position of the Portuguese regions, consists in calculating the sum of the distances between each
concelho and all the others. Table 3 shows the extreme cases, i.e. the more central and the less central concelhos.
Table 3 – Geographical centrality of the Portuguese concelhos - the extreme cases
More central Less central
Concelho Total distance (Km) Concelho Total distance (Km)
Condeixa-a-Nova 51845.3 Tavira 127746.7
Coimbra 52423.2 Vila Real de S. António 127451.0
Ansião 53071.8 Castro Marim 127107.0
Alvaiázere 53311.6 Olhão 122883.0
Table 3 clearly shows the significant differences that exist in the geographical centrality of the Portuguese concelhos.
Of course, a distribution of economic activity more favourable to the more remote regions may decrease the cross-regional differences in economic centrality and, consequently, the implications on the relative levels of per capita income and human capital shown in this section.
4. Final remarks
Considering data for the Portuguese economy, we have confirmed the existence, at the regional level, of a positive impact of economic centrality on per capita income and human capital, in line with the one established, at country level, by Redding and Venables (2004) and Redding and Schott (2003): more central regions - in terms of proximity to the location of the economic activity - appear to have higher levels of per capita income and human capital. Obviously, as the centrality level of the regions is a function of the actual distribution of the economic activity, it may change in the future. Nevertheless, some regions suffer a permanent penalty resulting from their disadvantage as regards the relative geographical position, which may have serious negative consequences in terms of their per capita income and human capital levels if it is not counteracted with appropriate policies.
More sophisticated models may be built to explain the relationships that we have analysed and the results we have obtained should be taken as a preliminary evaluation on the topic. We have nonetheless put into evidence the relevance, at the regional level, of the economic centrality on differences in per capita income and human capital levels.
References
Brülhart, M. (2001), “Evolving Geographical Concentration of European Manufacturing Industries”, Weltwirtschaftliches Archiv,137(2), pp. 215-243.
Censos (2001), Instituto Nacional de Estatística.
Copus, A. (1999), “A New Peripherality Index for the NUTS III Regions of the European Union”, ERDF/FEDER Study 98/00/27/130, Report for the European Commission.
Head, K. and T. Mayer (2002), “Illusory Border Effect: Distance Mismeasurement Inflates Estimates of Home Bias, CEPII Working Paper 2002-01, Paris.
Keeble, D., P. Owens e C. Thompson (1982), “Regional Accessibility and Economic Potential in the European Community”, Regional Studies, 16(6), pp. 419-432.
Keeble, D., J. Offord and S. Walker (1988), “Peripheral Regions in a Community of Twelve Member States, Report for European Commission, Brussels.
Ramos, P. (1998), “Estimativas do PIB per capita para os Concelhos do Continente Português”, Revista de Estatística, 3(3), pp. 31-50.
Redding, S. e P. Schott (2003), “Distance, Skill Deepening and Development: Will Peripheral Countries Ever Get Rich?”, Journal of Development Economics, 72, pp. 515-541.
Redding, S. and A. Venables (2004), “Economic Geography and International Inequality”,
Journal of International Economics, 62 (1), pp. 53-82.
Schürmann, C. e A. Talaat (2000), “Towards a European Peripherality Index”, Report for General Directorate XVI Regional Policy of the European Commission.