An Integrated Approach to Planning
Charging Infrastructure for Battery
Electric Vehicles
This thesis is submitted for the degree of Doctor of Philosophy
School of Engineering
Myriam Neaimeh
i
Declaration
I hereby declare that this thesis is a record of work undertaken by myself, that it has not been the subject of any previous application for a degree, and that all sources of information have been duly acknowledged.
For the avoidance of doubt, it must be noted that unless explicitly stated, all the work in this thesis is carried out by the author.
Parts of this work, have been the subject of previous publications: Journal Papers:
Neaimeh M, Hill GA, Hübner Y, Blythe PT. “Routing systems to extend the driving range of electric vehicles.” IET Intelligent Transport Systems 2013, 7(3), 327-336.
Neaimeh M, Wardle R, Jenkins A, Hill GA, Lyons P, Yi J, Huebner Y, Blythe PT, Taylor P. “A probabilistic approach to combining smart meter and electric vehicle charging data to investigate distribution network impacts.” Applied Energy 2015, 157, 688-698.
Neaimeh M, Salisbury SD, Hill GA, Blythe PT, Scoffield DR, Francfort JE. “Analysing the usage and evidencing the importance of fast chargers for the adoption of battery electric
vehicles.” Energy Policy 2017, 108, 474-486. Conference Papers:
Neaimeh M, Higgins C, Hill GA, Hübner Y, Blythe PT. “Investigating the Effects of Topology on the Driving Efficiency of Electric Vehicles to Better Inform Smart Navigation.” In: Road Traffic Information and Control (RTIC). 2012, London: The Institution of Engineering and Technology (IET).
Neaimeh M, Hill GA, Blythe P, Wardle R, Yi J, Taylor PC. “Integrating Smart Meter and Electric Vehicle Charging Data to Predict Distribution Network Impacts.” In: 4th European Innovative Smart Grid Technologies (ISGT) Conference. 2013, Copenhagen, Denmark: IEEE. Neaimeh M, Hill GA, Guo W, Wardle J, Bramich A, Blythe PT. “Understanding the role of a rapid charging infrastructure on urban and interurban mobility patterns.” In: Electric Vehicle Symposium (EVS29). 2016, Montréal, Québec, Canada.
Project Reports:
Neaimeh M, Blythe P, Serradilla J, Pinna C, Hill G, Guo A, “Rapid Charge Network Activity 6 Study Final Report”. 2015. http://rapidchargenetwork.com/resources.php
Blythe P, Huebner Y, Hill G, Neaimeh M, Higgins C, “SwitchEV Study Final Report”.2013. http://switchev.typepad.com/blog/
ii
Acknowledgments
I would like to thank Prof. Phil Taylor for guiding me through this challenging and rewarding PhD journey. Also, thank you Phil for creating an inclusive and supportive work environment where people can thrive.
I would like to thank my colleagues and papers’ co-authors who provided invaluable insight and support. Namely Graeme Hill, Neal Wade, Padraig Lyons, Jialiang Yi, Robin Wardle, Andrew Jenkins, Simon Blake, Amy Guo, Neil Thorpe, Yvonne Huebner, Stefano Utili, Laura Brown, Peter Bach Andersen, Francisco Carranza, Shawn Salisbury and Don Scofield. I would like to thank Josey Wardle and Phil Blythe for funding my PhD through the RCN and LC Transforms projects.
I couldn’t have done it without the support of my family and friends. Namely Charlotte, Sarah, Imane, Adrian, Nadine, Ben, Oliver, Kevin, Rony, Carla, Marwan, Ghassan, Samira and Michel. Antoinette, I'm where I am because of you!
I would also like to thank my examiners Prof. Ghanim Putris and Dr. Roberto Palacin for taking the time to examine my thesis and critically appraise it. Your comments made valuable points of note and the thesis has been strengthened with your suggested amendments.
Last and not least, I would like to thank the R and OpenDSS community who believe in the power of open source software.
iii
Abstract
Battery electric vehicles (BEVs) could break our dependence on fossil fuels by facilitating the transition to low carbon and efficient transport and power systems. Yet, BEV market share is under 1% and there are several barriers to adoption including the lack of charging infrastructure. This work revealed insights that could inform planning an appropriate charging infrastructure to support the transition towards BEVs. The insights were based on analysis of a comprehensive dataset collected from three early, real world demonstrators in the UK on BEVs and smart grids. The BEV participants had access and used home, work and public charging infrastructure including fast chargers (50 kW). Probabilistic methods were used to combine and analyse the datasets to ensure robustness of findings.
The findings confirm that it is essential to consider a new refuelling paradigm for BEV charging infrastructure and not replicate the liquid-fuel infrastructure where all demand is met at public fuelling stations in a very short period of time. BEVs could be charged where they are routinely parked for long periods of time (i.e. home, work) and meet most of the charging needs of drivers. Installing slow charging infrastructure at home and work would be less expensive and less complicated than rolling-out a ubiquitous fast charging infrastructure to meet all charging needs. In addition, ensuring that cars are connected most of the time to the electricity network allows proper management of BEV charging demand. This could support reliable and efficient operation of the power system to minimise network upgrade costs. Finally, when slow charging infrastructure is neither available nor practical to meet charging needs, fast chargers can be used to fill in this gap. Analysing data of BEV drivers with access to private charging locations, the findings show that fast chargers become more important than slow chargers for daily journeys above 240km and could help overcome perceived and actual range barriers.
An appropriate infrastructure takes an integrated approach encompassing BEV drivers’ requirements and the characteristics of the distribution networks where BEV charging
infrastructure is connected. A non-integrated approach to delivering a charging infrastructure could impede the transition towards BEVs. The findings of this work could support on-going policy development in the UK and are crucial to planning national charging infrastructure to support the adoption of BEVs in a cost-optimal manner.
iv
Highlights
• Analysis of a comprehensive dataset collected from three early, real world demonstrators in the UK on BEVs and smart grids.
• Data was collected from BEVs of several users, different types of charging infrastructure, at different locations, and for an extended period of time. Data was also collected from different types of electricity distribution networks.
• Analysis of 121,000 BEV trips and associated 25,000 charging events.
• Analysis of BEV usage patterns from users residing in urban areas and rural areas. • Charging events collected from home, workplace, and public charge infrastructure
including fast chargers (50kW). This resulted in charging profiles that are spatially and temporally diverse.
• The diverse charging profiles were considered in a probabilistic study examining electricity distribution impacts of BEV adoption. This diverse demand reduces the estimated impacts on distribution networks.
• For all 3 networks studied and for all BEV penetration levels considered (up to 60% penetration), voltage magnitude did not drop below statutory limit. In contrast to voltage, transformer loading issues were detected. For the case study urban network, load data (97th percentile) for 60% BEV penetration, loading limits (500 kVA) of the transformer were approached. Loading limits were exceeded at 30% BEV penetration for the urban generic network, and at 15% BEV penetration for the case study rural network. • Weather and real driving conditions affect the BEV achievable range, which is less than
the advertised range determined in laboratory conditions.
• Over 95% of daily driving is under 150 km and most of driving days can be met with an existing BEV model on one charge.
• Fast chargers start to become more important than slow chargers for journeys that are above 240km per day.
• Fast chargers enabled using BEVs on journeys above their single-charge range that would have been impractical using slow chargers.
• Fast chargers could help overcome perceived and actual range barriers, making BEVs more attractive to future users.
• Empirical evidence can be used to support on-going policy development in the UK, including the new Automated and Electric Vehicles Bill.
v
Table of Contents
Chapter 1. Introduction _____________________________________________________________ 1 1.1 Background _________________________________________________________________ 1 1.2 Justification Of This Work ______________________________________________________ 7 1.3 Thesis’ Aim and Objectives _____________________________________________________ 8 1.4 Overall Methodology _________________________________________________________ 10 1.5 Overview of Datasets Used in This Work _________________________________________ 10 1.6 Thesis Structure _____________________________________________________________ 14 1.7 Original Contribution to Knowledge _____________________________________________ 15 Chapter 2. Review of Electric Vehicle and Charging Infrastructure Initiatives _________________ 17 2.1 BEV and Charging Infrastructure Technology Overview ______________________________ 17 2.1.1 Emerging EV Charging Technology (ultra-fast chargers and bidirectional chargers) ___ 21 2.2 UK Government Support for Electric Vehicles _____________________________________ 22 2.2.1 UK Government charging infrastructure strategy ______________________________ 23 2.2.2 Automated and Electric Vehicles Bill _________________________________________ 24 2.2.3 Government support for efficient integration of EVs into the power system _________ 26 2.2.4 National Infrastructure Commission _________________________________________ 27 2.3 Review of Projects and Initiatives Providing Evidence to Support the Planning of National Charging Infrastructure _____________________________________________________________ 27
2.3.1 International projects, initiatives and studies on BEVs and charging infrastructure ____ 29 2.3.2 UK studies and projects on BEVs and charging infrastructure _____________________ 35 2.4 Identification of a Research Gap and Overall Contribution of this work _________________ 38 Chapter 3. BEV Demonstrators and Data Collection ______________________________________ 41 3.1 Introduction ________________________________________________________________ 41 3.2 Participants Selection ________________________________________________________ 42 3.3 Data Collection and Management ______________________________________________ 44 3.3.1 Data loggers ___________________________________________________________ 44 3.3.2 Data management ______________________________________________________ 46 3.4 Summary __________________________________________________________________ 48 Chapter 4. Analysing Driving and Charging Patterns of BEV Users using Data from Real World Demonstrators ___________________________________________________________________ 49 4.1 Analysis of Daily Driving Distances ______________________________________________ 49 4.2 Factors Impacting BEV Energy Consumption ______________________________________ 52 4.3 Analysis of Charging Patterns __________________________________________________ 59 4.4 Summary __________________________________________________________________ 62
vi
Chapter 5. A Probabilistic Approach to Combining Smart Meter and Electric Vehicle Charging Data to Investigate Distribution Network Impacts ___________________________________________ 63 5.1 Introduction and Related Work Within Area ______________________________________ 64 5.2 Technical Considerations of Distribution Networks _________________________________ 66 5.2.1 Voltage ________________________________________________________________ 66 5.2.1.1 Voltage quality standards _________________________________________________ 67 5.2.1.2 Voltage control _________________________________________________________ 68 5.2.1.3 The relationship between voltage and real and reactive power flows and the impact of BEVs charging on voltage drops. __________________________________________________ 68 5.2.2 Thermal loading limit of equipment _________________________________________ 71 5.3 Contribution of This Chapter ___________________________________________________ 71 5.4 Brief Overview of BEV Charging Control Methods __________________________________ 73 5.5 Data ______________________________________________________________________ 75 5.5.1 Battery electric vehicles trial - SwitchEV project ________________________________ 75 5.5.2 Smart meter data- Customer Led Network Revolution (CLNR) project _______________ 75 5.5.3 Network models _________________________________________________________ 77 5.5.3.1 Generic network model ___________________________________________________ 77 5.5.3.2 Case study real-world urban and rural networks _______________________________ 79 5.6 Analysis Methods ____________________________________________________________ 81 5.6.1 Monte Carlo simulations __________________________________________________ 81 5.6.2 Power flow analysis ______________________________________________________ 85 5.6.2.1 Power flow study in OpenDSS for a UK generic network _________________________ 85 5.6.2.2 Power flow study in IPSA2 for the urban and rural networks _____________________ 86 5.7 Results ____________________________________________________________________ 86 5.7.1 Transformer loading _____________________________________________________ 86 5.7.2 Voltage drops ___________________________________________________________ 89 5.8 Interpretation of Results- BEV Impact on LV Distribution Networks ____________________ 91 5.8.1 Urban vs rural study ______________________________________________________ 91 5.8.2 Urban vs generic study ___________________________________________________ 91 5.8.3 Spatial and temporal diversity of BEV charging demand. _________________________ 92 Chapter 6. Investigating the Importance of Fast Chargers for the Adoption of Battery Electric Vehicles. _________________________________________________________________________ 94 6.1 Introduction and Related Work Within Area ______________________________________ 94 6.1.1 Fast charging and battery degradation _______________________________________ 96 6.2 Contribution of This Chapter __________________________________________________ 100 6.3 Data _____________________________________________________________________ 100
vii
6.4 Analysis Methods __________________________________________________________ 101 6.5 Results ___________________________________________________________________ 104 6.5.1 Graphical exploration of driving distance and fast charging _____________________ 104 6.5.2 Evidencing the role of fast chargers in enabling driving distances above the single-charge range of BEVs. _________________________________________________________________ 106
6.5.2.1 OLS and robust linear regression results ____________________________________ 106 6.5.2.2 Overall fit of the model, cross validation and model parameters _________________ 108 6.5.2.3 Relative importance of fast and standard charge energy _______________________ 109 6.6 Interpretation of Results- a Network of Fast Chargers ______________________________ 111 Chapter 7. Discussion _____________________________________________________________ 114 7.1 Refuelling Paradigm Shift- Charging at Home and at Work __________________________ 114 7.2 A Network of Fast Chargers ___________________________________________________ 117 7.3 Slow Chargers at Home and at Work Complemented with a Network of Fast Chargers ___ 120 7.4 Evidence to Support On-Going EV Policy In The UK ________________________________ 121 Chapter 8. Conclusion _____________________________________________________________ 124 8.1 Key Findings _______________________________________________________________ 124 8.2 Fulfilment of Research Objectives _____________________________________________ 127 8.3 Further Research ___________________________________________________________ 130 References ____________________________________________________________________ 134 Appendices ___________________________________________________________________ 150 Appendix A- R code for Monte Carlo Simulation ________________________________________ 150 Appendix B- Description of the power flow solution in OpenDSS ___________________________ 153 Appendix C- Generic network modelling and simulation in OpenDSS ________________________ 158 Appendix D- Awards ______________________________________________________________ 164 Appendix E- Published Journal Papers ________________________________________________ 165
viii
List of Figures
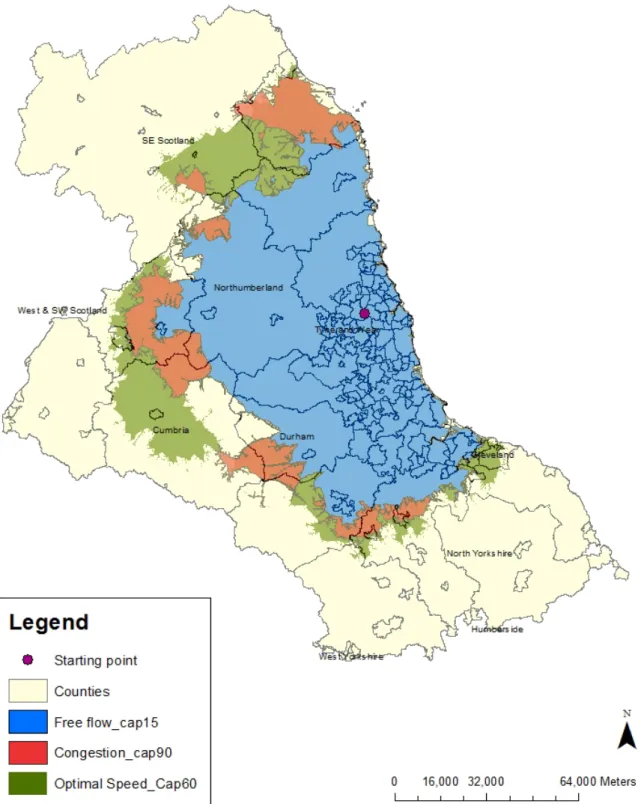
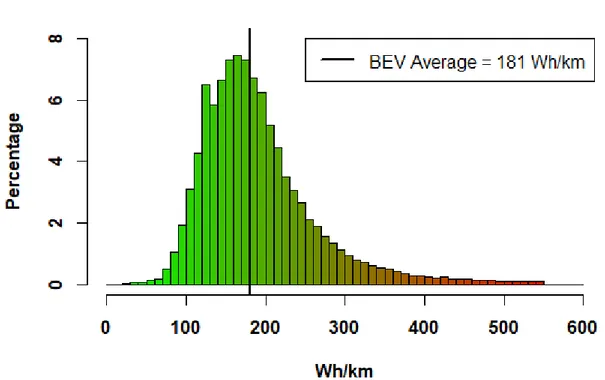
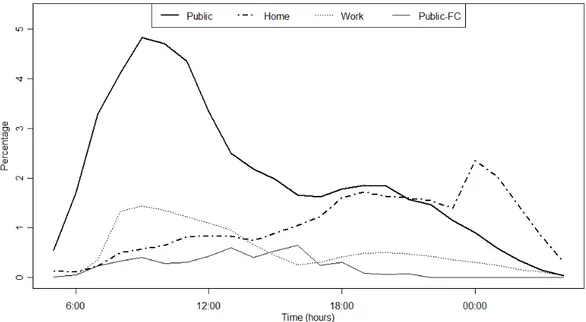
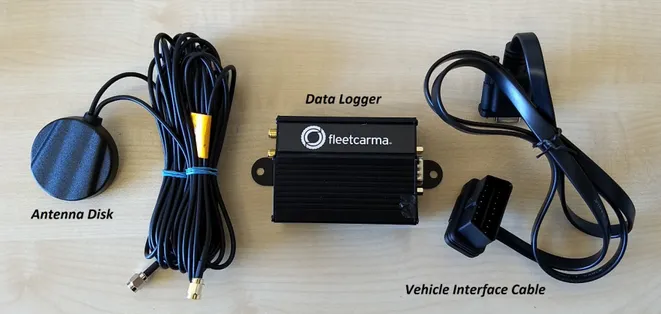
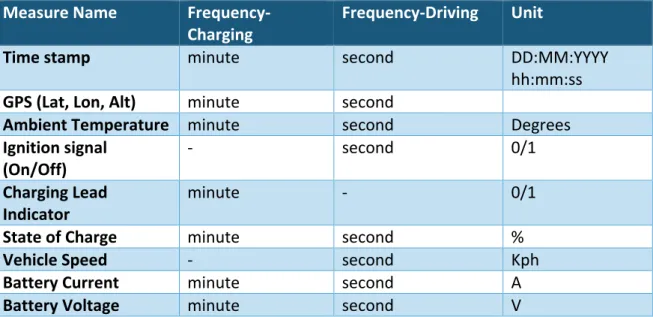
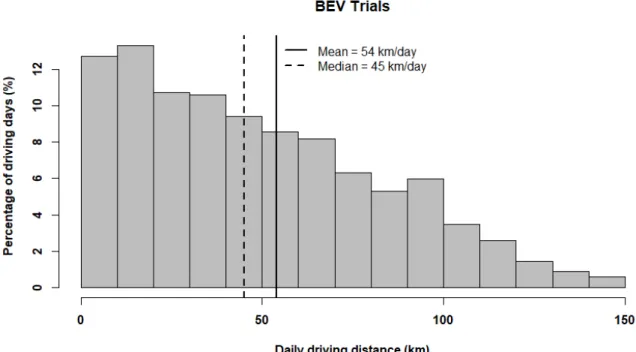
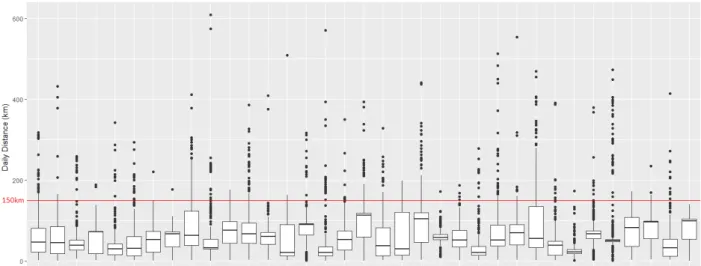
Figure 1: Breakdown of UK's Green House Gas Emissions in 2016 [32]. _________________________________ 4 Figure 2: Electric vehicles' market share in the UK between 2010 and 2016 [40]. _________________________ 6 Figure 3: Projects and datasets used in this work. ________________________________________________ 13 Figure 4: Thesis Overview. ___________________________________________________________________ 16 Figure 5: RCN network (red dots) and BEV drivers interested in the data collection trial (blue crosses)._______ 43 Figure 6: Antenna disk, data logger device and vehicle interface cable. _______________________________ 45 Figure 7: Vehicle's diagnostic port and logger interface cable. _______________________________________ 45 Figure 8: Data management diagram for the RCN BEV trial. ________________________________________ 47 Figure 9: Percentage of driving days on the UK NTS dataset. ________________________________________ 50 Figure 10: Distribution of daily distance travelled on the UK BEV trials (excluding pool vehicles). ___________ 51 Figure 11: Distribution of daily distance for each of the 35 BEV participants on the RCN trial. ______________ 52 Figure 12: Different road gradients and the related BEV energy consumption [72]. ______________________ 54 Figure 13: Driving range of a BEV for different levels of road network capacity. _________________________ 56 Figure 14: Variation of average energy consumption (Wh/km) with the variation of ambient temperature. ___ 57 Figure 15: Distribution of average driving energy consumption (Wh/km) on the BEV trials. ________________ 58 Figure 16: Boxplots of batteries' SoC at the beginning and end of charging events for private passenger cars on the BEV trials. _____________________________________________________________________________ 59 Figure 17: Energy used between two consecutive charging events. ___________________________________ 60 Figure 18: Percentage energy transferred at each hour of the day at different charging locations for urban users. Public refers to all public chargers except fast chargers (50 kW). _____________________________________ 61 Figure 19: Percentage energy transferred at each hour of the day at different charging locations for rural users. ________________________________________________________________________________________ 62 Figure 20: An overview of the power system (physical subsystem). The transmission network is shown in blue and the distribution network is shown in green [220]. _____________________________________________ 67 Figure 21: Illustration of a simple MV/LV feeder and load. __________________________________________ 69 Figure 22: Power transfer between source and load. ______________________________________________ 69 Figure 23: UK generic network used in steady-state OpenDSS and IPSA2 studies [17]. ____________________ 78 Figure 24: Detailed modelling of a LV feeder. Adapted from [239]. ___________________________________ 79 Figure 25: Diagram of the 6.6kV case-study urban network used in steady-state IPSA2 study [17]. __________ 80 Figure 26: Diagram of the 20kV case-study rural network used in steady-state IPSA2 study [17]. ___________ 81 Figure 27: Example of peak day load profiles for 2 customers (#1 and #73) on the network for 2 different MCS runs (run #1 and 1000). _____________________________________________________________________ 83 Figure 28: Remote end of longest feeder-Urban 60% EV penetration. Average load values (dots) and 95% data bound (Grey area). _________________________________________________________________________ 84 Figure 29: Methodology process diagram. ______________________________________________________ 84 Figure 30: LV transformer loading for the generic network at different BEV% levels. _____________________ 87 Figure 31: LV transformers loading for the urban (left) and rural (right) networks[17]. ___________________ 88 Figure 32: Voltage levels at 19:00 for different BEV % - voltage drop along one of the phases of the feeder and at customer connection point (example for a customer at the end the end of the feeder). _________________ 89 Figure 33: Voltage variation at the beginning (seg1) and at the remote end (seg4) of the feeder for 60% BEV penetration. ______________________________________________________________________________ 90 Figure 34: Spatial and temporal diversity of BEV charging demand. __________________________________ 92 Figure 35: capacity decrease versus number of cycles and charge rate [265]. ___________________________ 97 Figure 36: Median daily distance and proportion of fast charge energy for the 35 BEV users. _____________ 101 Figure 37: Relationship between daily distance travelled and fast charge events. ______________________ 105 Figure 38: Weekly driving distance and weekly number of fast charge events. _________________________ 105 Figure 39: Predicted values of the OLS regression and predicted values of the robust regression. __________ 107 Figure 40: Proportionate contribution to R2 for fast and standard charge energy predictors. ______________ 110
Figure 41. Yprim of a line model [240]. ________________________________________________________ 154 Figure 42: Modelling of most power conversion elements (e.g. loads) in OpenDSS as Norton Equivalent. ____ 155 Figure 43: Representation of the circuit elements [240]. __________________________________________ 155 Figure 44: Power flow solution in OpenDSS [241]. _______________________________________________ 157
ix
List of Tables
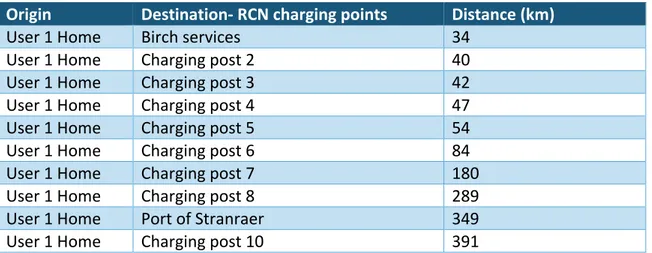
Table 1: Information on selected BEV models available in the UK [76]–[79]. ____________________________ 18 Table 2: Information on typical charging points used by light duty BEVs (circa 2018). _____________________ 20 Table 3. BEV Trial details. ____________________________________________________________________ 42 Table 4: An example of the distances between the home address of one of the selected participants and 10 RCN chargers. _________________________________________________________________________________ 43 Table 5. Key measures collected by the data loggers on the SwitchEV and RCN BEV trials. _________________ 46 Table 6: Summary of LV network and population parameters [17]. ___________________________________ 76 Table 7: Maximum voltage drop on the generic network calculated using OpenDSS and IPSA2. _____________ 90 Table 8: Maximum voltage drop on the urban network. ____________________________________________ 90 Table 9: Maximum voltage drop on the rural network. _____________________________________________ 90 Table 10: Comparison between linear and robust linear models. ____________________________________ 107 Table 11: Multiple Regression Report. _________________________________________________________ 109
1
Chapter 1. Introduction
1.1BackgroundIt is essential to decarbonise and improve the efficiency of the main sectors of the economy, namely the industry, buildings, transport and power sectors [1]. While decarbonisation is defined as displacing the use of fossil fuels by low carbon technologies, efficiency is making the most effective use of resources.
Battery electric vehicles (BEVs)1 for road transport are a disruptive new technology with the potential to support the transition of both the transport and power sectors to low carbon and more efficient systems. Compared to a conventional liquid-fuel vehicle, a BEV uses an electric motor and electricity stored in an on-board battery, instead of an internal
combustion engine (ICE) and fossil fuel to transport people and light goods around.
From the perspective of transport, BEVs recharge using electricity that has the potential to be produced from low-carbon renewable sources such as wind and solar; in contrast to conventional vehicles that use carbon intensive and non-renewable fossil fuels. In addition, an electric motor transforms electric energy into mechanical energy more efficiently than an internal combustion engine converts thermal energy into mechanical energy. The efficiency of internal combustion engines range between 15 and 30 percent while the efficiency of electric motors can range between 75 and 98 percent [2]. Consequently, driving a BEV uses energy much more efficiently than driving a conventional vehicle [3].
From the perspective of the electric power system, a large number of BEVs have the
potential to become a source of flexibility that would facilitate efficient operation of a power system with a high share of low carbon generation [4]–[7]. Flexibility in power systems refers to the ability to quickly respond to changes in electricity demand and generation to maintain the balance that is necessary for reliable operation of the power system [8], [9]. Flexibility is particularly important for power systems that integrate high levels of renewable energy such as solar and wind. This is because the power output of renewable energy can be variable and uncertain, creating a fluctuating power supply. This fluctuating supply increases the
complexity and the cost of operating a reliable power system [10]. The decarbonisation of
1 In this work, the term “electric vehicles” (EVs) encompasses hybrid, plug-in hybrid,
2
the UK power system is underway with high levels of renewable energy already on the system comprising 34% of the installed generating capacity in 2016 [11]. While the 2016 generation emission intensity was 286gCO2/kWh, further low-carbon generation growth is needed to meet the 100gCO2/kWh 2030 target set by the UK Committee for Climate Change [1]. Flexibility resources, such as BEVs, can support reliable and cost effective operation of the UK power system containing a high share of renewable energy [5]–[7], [12], [13]. As well as meeting transportation needs, BEVs have an untapped potential to support the operation of the electric power system. Automobiles are an asset with a low level of
utilisation [14]. This applies particularly to private passenger cars, which are the focus of this thesis. A car is typically used for no more than a couple of hours in a day and parked for the majority of the time. A US study analysing one year of driving data from a sample of
representative ICE passenger cars found that even during the weekday rush hour, on average, approximately 85% of the vehicles are parked [15]. Similarly, a UK study analysing the National Travel Survey (NTS) dataset, which monitors household personal travel, found that cars are stationary more than 80% of the day, and during travel peak hours (morning and afternoon commuting hours) non-stationary cars only occasionally exceed 20% [6]. Furthermore, these studies show that the majority of daily driving is under 50 miles (80 kilometres). This indicates that daily driving requirements would not exceed half of the vehicle battery capacity, which is advertised at 200 km for typical BEV models currently available on the market (circa 2017). These findings on daily distance and energy
requirements have been corroborated using data collected from real world demonstrators of BEVs in the UK and the US [16], [17]. As such, the long parking time of the car, and the surplus battery capacity could allow flexibility in the time, duration and rate of charging and discharging of the car that could support the operation of the power system while still respecting the transportation needs of the drivers [18]–[23].
Customers could potentially offer their BEVs to support the power system in exchange for lower bills. For example, flexible BEV load can reduce the need to curtail available wind output by shifting demand towards periods of surplus energy [5]. The flexible BEV demand can also be shifted out of peak demand periods to avoid congestion on transmission and distribution electricity networks. Furthermore, BEVs can provide grid balancing services (e.g. frequency regulation) and reduce the need for carbon intensive conventional generators to
3
provide these services. This results in cost savings given that balancing services using conventional generators reduce the operational efficiency of these generators due to part-loaded operation [6].
As described above, BEVs would facilitate the transition to low carbon and efficient transport and power systems. To further emphasise the importance of transport
electrification, the next paragraphs describe how this transition could boost the economy, improve air quality and mitigate anthropogenic climate change.
The following examples illustrate some of the potential savings to the UK economy from moving away from fossil fuels. Fossil fuels remain the dominant source of the energy supply in the UK, accounting for 82% in 2016. 19% of this energy supply was dissipated in
conversion losses in coal and gas power stations [24], [25]. A transition to renewable energy sources, facilitated by a flexible power system, could reduce the reliance on carbon intensive fossil fuels, and consequently minimise the waste of resources. Moreover, the transport sector remains the largest consumer of energy since 1988. Of the total final expenditure on energy in 2016 (£111 billion), the transport sector, which is almost entirely fuelled by
petroleum products, accounted for the biggest share at 50 per cent [25]. Approximately half (48%) of the final energy consumption in the transport sector was for road passenger vehicles [26]. So, a shift towards BEVs will see demand for traditional road transport fossil fuels replaced with demand for electricity, which could be met with renewable energy sources and could decrease the energy bill of the UK [27], [28].
Poor air quality is the largest environmental risk to public health in the UK and could reduce life expectancy by increasing deaths from lung, heart and circulatory conditions [29]. The most immediate action required to improve air quality is reducing the Nitrogen Dioxide (NO2) concentrations- the only statutory air quality limit that the UK currently fails to meet [29]. The latest (2015) DEFRA national statistics of air pollutants’ emissions by source in the UK show that road transport and the energy industries (combustion in power plants and energy production) are responsible for the majority of national nitrogen oxides (NOx) emissions, with road transport accounting for 34% and the energy industries 29% of NOx emissions [30]. BEVs could improve air quality by minimising the use of fossil fuels in the
4
transport sector by displacing it with electricity; and in the power sector by supporting the integration of renewable energy sources.
As with air pollution, BEVs could help reduce Greenhouse Gas (GHG) emissions from the combustion of fossil fuels in both transport and power sectors and help meet the UK’s
emission reduction targets. The latest figures for the UK show that the transport sector is the largest GHG emitter with 27% of total UK GHG emissions (in MtCO2e), with passenger cars and light vans accounting for the largest share of these emissions (Figure 1) [31]. Following the transport sector, the power sector accounted for 26% of total UK GHG emissions (Figure 1) [31].
5
The UK government recognises the significant benefits of a transition to low carbon and efficient power and transport sectors to the environment and the economy. The UK is developing its modern industrial strategy to improve the country’s living standards and economic growth. At the core of the strategy is upgrading the UK’s infrastructure such as the electric power system, and supporting businesses such as the automotive industry to
position the UK as a global leader in the transition to cleaner and more efficient technologies [32]. An important part of the industrial strategy is the plan to upgrade the electric power system by increasing its flexibility to integrate a high share of low carbon generation. The plan highlights the role of energy storage, such as from BEVs, to achieve this aim [33]. To help realise the strategy and its plans, the government announced the Industrial Strategy Challenge Fund investments- for example the £246m Faraday Challenge fund is focusing on the design and manufacture of improved (i.e. cost effective, high performing and recyclable) batteries for electric vehicles [34], [35].
In parallel, the government made available £600m between 2015 and 2020 supplemented by a further £270m announced at the 2016 Autumn Statement to support electric vehicles. These funds helped launch the national Go Ultra Low (GUL) campaign to raise awareness on EVs, provided funding for research and development projects, grants for car subsidies and support for the infrastructure needed for EVs [28], [36], [37]. The 2017 Autumn Statement included the announcement of a new £400m EV Charging Infrastructure Investment Fund (CIIF), with £200m investment from the government to be matched by private investors. In 2018, the government published “The Road to Zero” strategy laying out government support and actions required (including from industry) to deliver zero emission road transport [31]. These efforts could help overcome the barriers to adoption of electric vehicles and achieve the government target of having all new cars zero emission by 2040 with BEVs playing an important role in meeting this target. This is an ambitious increase from a total of 90,000 EVs and a market share of 1.4% in 2016 (Figure 2) [28], [38], [39].
6
Figure 2: Electric vehicles' market share in the UK between 2010 and 2016 [39].
This low market share could be explained by several barriers to adoption such as high purchasing cost compared to an equivalent liquid-fuel vehicle, limited driving range and the lack of an appropriate charging infrastructure to support the adoption of BEVs [40]–[43]. For example, the results on public attitudes to electric vehicles from the Office for National Statistics Opinions and Lifestyle survey in 2016 showed that the most important factor deterring people from buying an electric vehicle was the lack of a charging infrastructure [40].
If the number of BEVs increase to millions to meet the government’s target, the charging demand of these vehicles could create detrimental effects on the power system. The charging infrastructure of BEVs will be mainly connected to low voltage (LV) electricity distribution networks, therefore, it is likely that this part of the power system would face the first impacts of a large scale introduction of electric vehicles, namely voltage and thermal constraints [44], [45]. 0.01% 0.06% 0.13% 0.17% 0.60% 1.11% 1.41% 2010 2011 2012 2013 2014 2015 2016
7
The average daily electricity use of a BEV is around 8kWh [17], [46], [47], which could almost double the average daily electricity consumption of a household-currently at around
10.8kWh [48]. Problems are more likely to arise if charging of cars coincide with each other or coincide with the existing peak electricity demand, which is at late afternoon until early evening in the UK [44], [49], [50]. The constraints from charging a large number of BEVs at the same time can create the need for costly grid reinforcement to allow the electricity network to host a large number of BEVs and their charging infrastructure.
1.2Justification Of This Work
While the market share of BEVs is low and before electric cars enter the mass market, there is a window of opportunity to shape the charging infrastructure, norms and regulations so that BEVs can meet the needs of both the consumer and the power system. An integrated approach to shaping the BEV charging infrastructure that takes into account both the transport requirements and the power system characteristics is essential. A non-integrated approach to delivering a charging infrastructure could impede the transition towards electric cars.
An appropriate charging infrastructure would meet the charging demand of BEV users so that they can use the electric car for all their journeys. To design an appropriate charging infrastructure for BEVs, it is necessary to take into account the BEV characteristics that are different to conventional liquid-fuel cars. Unlike conventional cars, BEVs can be charged at locations where cars are naturally parked for long periods of time (e.g. home, work) and most of the charging demand could be met at these locations [15], [51]. Consequently, rolling-out a BEV infrastructure should not mimic the existing refuelling infrastructure of conventional cars where all the refuelling demand of a car is met quickly at public fuelling stations. The benefits of considering a new refuelling paradigm for BEVs charging
infrastructure are two-fold. First, installing low power-rate (slow) charging infrastructure at locations where cars are parked for long periods of time is less expensive and less
complicated than developing a ubiquitous public high-power rate (fast) charging
8
infrastructure to meet all charging demand would lock away the charging flexibility potential of BEVs, which can support the power system [4], [19].
Furthermore, an appropriate BEV charging infrastructure would minimise its impact on the electricity network and the subsequent costly reinforcement that could slow down the transition to mass BEV adoption. It is essential to take into account actual BEV driving and charging requirements to robustly investigate their impact on the electricity networks. Previous studies using simulated data and assumptions of charging behaviour overestimated the impacts on distribution networks and the requirements for grid reinforcement [45], [53]–[60]. One of the studies that focused on British distribution networks found that a 12.5% uptake would cause severe impacts on the transformer and the LV underground cable supplying the households [44]. While that previous study used a probabilistic approach to address uncertainties associated with residential loads and BEV user behaviour, it noted that real-world data of BEV usage could improve the probabilistic methods used [44]. When actual BEV usage patterns were used, the impact studies revealed that networks have a greater capability than previously suggested to accommodate a larger number of BEVs [16], [61].
Therefore, it is clear that we must take an integrated approach to planning an appropriate charging infrastructure to support BEV adoption and minimise the impact on electricity networks. This work is focusing on private passenger cars. The analysis and
recommendations apply to charging infrastructure installed at locations where cars are parked for long periods of time (i.e. slow chargers at home and work), complemented by a network of public fast chargers (referred as rapid chargers in the UK).
1.3Thesis’ Aim and Objectives
The aim of this thesis is to propose charging infrastructure, integrating both transport requirements and power system characteristics, to ensure successful and cost effective BEV transition. At the heart of the integrated approach is the need to understand the
characteristics and actual usage patterns of BEVs, and similarly grid characteristics and existing electricity usage patterns.
9
To meet the aim of the thesis, the following research questions and objectives are investigated:
Research Question 1 (RQ1): What are the learnings from existing projects and initiatives that could support future charging infrastructure roll-out and what are the gaps in current
knowledge?
• Objective 1: Establish current state of the art on the provision of BEV charging infrastructure.
RQ2: How do people use battery electric vehicles? i.e. driving behaviour and charging behaviour such as energy transferred at charging events at different times and locations.
• Objective 2: Design a real-world BEV demonstrator and collect BEV usage data from the demonstrator
• Objective 3: Analyse charging and driving patterns of BEVs using data from two real world BEV demonstrators.
RQ3: What is the impact of BEV charging, using low power-rate chargers (i.e. 3.8 kW), on LV electricity distribution networks? And do realistic charging and driving patterns change the expected impact on these networks?
• Objective 4: Investigate the impact of residential BEV charging using low-rate power chargers (i.e. 3.8 kW) and actual charging data on LV electricity distribution networks. RQ4: How does BEV usage impact the requirement for charging infrastructure (i.e. low
power-rate (slow) and high power-rate (fast) charge infrastructure)?
• Objective 5: Investigate the role and importance of fast chargers (i.e. 50 kW) for the adoption of BEVs.
10 1.4Overall Methodology
The overall method to meet the objectives of this work involves the following steps:
• Review UK Government policy to support the roll-out of charging infrastructure; and international and national projects and initiatives on BEV charging
infrastructure.
• Collect data from existing and new BEV demonstrators, national travel survey data and existing smart grid project.
• Conduct graphical exploration and descriptive statistics analysis of driving and charging usage data.
• Produce insights on actual BEV usage behaviour.
• Couple BEV data with smart meter data using Monte Carlo Simulation, then undertake power flow analysis to assess the impact of slow charge (3.8kW) on LV residential electricity distribution networks.
• Couple driving and charging data using multiple linear regression to assess the importance of fast chargers (50 kW) for the adoption of BEVs.
1.5Overview of Datasets Used in This Work
To gather evidence that can help shape the roll-out of the required BEV charging infrastructure, the government and the private sector funded several real world
demonstrators measuring actual usage of BEVs, charging infrastructure and their impact on the electricity networks [62]–[68].
The work in this thesis is based on data collected from three early, real world demonstrators in the UK on electric vehicles and smart grids, namely SwitchEV, RCN and CLNR projects [47], [63], [69]. More detail on the SwitchEV and RCN projects can be found in chapter 3, while detail on the CLNR project can be found in chapter 5.
The BEV charging data on these trials was collected from 3.8 kW and 50 kW unidirectional chargers. These are typical and commonly used charging posts (circa 2018) and consequently the focus of this work. Low power-rate (slow) charging stations (e.g. 3.8 kW charging station) could take hours to recharge a vehicle and high-power rate (fast) chargers (e.g. 50kW
11
charging station) can recharge a BEV from an empty battery to about 80% of full state of charge (SoC) in approximately 30 minutes [70].
Figure 3 shows an overview of the data collection and analysis on the aforementioned 3 projects. The design of the BEV trial on the RCN project was carried out by the author. For SwitchEV and RCN BEV trials, data loggers allowing detailed monitoring of vehicles’ usage were installed in the participating BEVs. Data loggers collected up to minute-by-minute data during charging events and second-by-second data during driving events. This high resolution dataset required cleaning and subsequently pre-processing into event-based logs. Unlike raw data (e.g. minute-by-minute charging information), the event-based logs contained summary measures of an event (for example, total energy used during a charge event or total energy used during a driving event).
Some of the cleaning and pre-processing steps included ensuring that the data was
chronological; separating mixed driving data and charging data into two separate datasets; ensuring that the loggers are continuously collecting data; creating an automated
notification when a logger had not sent data in 48 hours; liaising with participant to
troubleshoot the logger, etc. For the SwitchEV project, as indicated in Figure 3, a colleague carried out the data cleaning and pre-processing steps described above. For the RCN project, the company providing the data logging solution carried out the data cleaning and pre-processing activities. As part of the RCN BEV demonstrator design, the author assessed several data loggers’ manufacturers and prepared technical specifications to tender for loggers. This exercise was carried out to identify companies who developed data logging solutions that minimised data loss, data errors and provided data cleaning and
pre-processing as part of their product. The event-based logs (i.e. event-based summaries) for both the SwitchEV and RCN projects were used for this work. Additional detail on data loggers and data management are presented in chapter 3.
For Customer Led Network Revolution, network monitoring equipment was installed in selected case-studies networks to collect network data (e.g. voltage). In addition, network characteristics’ information (e.g. number of customer per LV feeder on the case-study networks) required for network modelling were obtained directly from Northern Powergrid (electricity distribution network operator involved in the smart grid project). In addition to
12
the CLNR urban and rural network models, the characteristics of a commonly used UK generic urban network are publicly available and were used to model a generic network. Smart meters were installed in thousands of selected households as part of CLNR. The data collection and processing of the smart meter dataset was carried out by a colleague (Figure 3). The processing of the smart meter data included separating it into datasets following socio-economic characteristics (e.g. annual income). More detail on the smart meter data can be found in chapter 5. For this work, the processed smart meter datasets were used by the author for further analysis as detailed in chapter 5.
To summarise, the datasets used for this work are event-based charging and driving data collected from the SwitchEV and RCN BEV trials. To compare daily driving distance of BEVs and ICE vehicles, publicly available UK National Travel Survey data was used. CLNR smart meter datasets, network data and case-study urban and rural network models were used. Finally, publicly available generic network characteristics were used to model the network and compare it to the CLNR urban and rural case study networks.
13
14 1.6Thesis Structure
The background to the research (section 1.1), justification of this work (section 1.2), aim and objectives (section 1.3), overall method (section 1.4), datasets used (section 1.5), thesis’ structure (section 1.6, Figure 4), and original contribution to knowledge (section 1.7) are presented in chapter 1.
A literature review on national and international charging infrastructure projects and initiatives, and a review of UK government policy is presented in chapter 2. Further, specific literature reviews on BEV network impact studies and fast charging research are conducted at the beginning of chapters 5 and 6 respectively.
The description of the BEV demonstrators with a focus on the RCN BEV trial design that was carried out by the author, as well as data collection and management is presented in chapter 3.
The analysis of SwitchEV and RCN datasets on BEV driving and charging usage is presented in chapter 4. The analysis revealed usage patterns’ insights that informed the input into studies in the following chapters. Some of the findings are also published in [1]–[3] and [7]. Data from the UK National Travel Survey was analysed to compare daily driving distances between BEVs and ICE vehicles (chapter 4).
In chapter 5, the SwitchEV BEV dataset, CLNR smart meter data, CLNR network models and a UK generic network model were used to investigate the impact of BEVs on residential LV electricity distribution networks. A probabilistic method based on a Monte Carlo Simulation (carried out in the R programming language) was used to combine BEV charging patterns and smart meter data to provide load input to generic, urban and rural power (load) flow studies. The generic network modelling and power flow analysis were carried out in OpenDSS, an open source electric power distribution system simulation (DSS). The urban and rural case-study networks were previously modelled as part of the CLNR project and the power flow studies were carried out in IPSA2 by a colleague using the input load data
obtained by the probabilistic method developed by the author. The probabilistic method, results, discussion and conclusions of chapter 5 are published in [2] and [5].
15
The comprehensive RCN dataset of BEVs and fast chargers usage is used in chapter 6 to investigate the role and importance of fast chargers for the adoption of BEVs. This investigation was undertaken by developing a statistical model using multiple regression analysis and determining relative importance of predictors. The modelling was carried out in R and the work is published in [17] and [72].
The overall discussion of the findings and the conclusion are presented in chapter 7 and 8 respectively. The Monte Carlo Simulation model is presented in Appendix A. Descriptions of power flow analysis, distribution network modelling and power flow simulation in OpenDSS are presented in Appendices B and C. The list of awards obtained for presenting parts of this work is shown in Appendix D. Parts of this work have been published in peer-reviewed journal papers, which are included in Appendix E.
This work is based on UK projects and used private passenger vehicles data; however, the methods developed can be applied to other geographical locations and to the analysis of commercial vehicles (e.g. fleet and company cars).
1.7Original Contribution to Knowledge
• Reveal insights on BEV usage patterns by analysing data collected from real world trials.
• Develop a probabilistic method combining real BEV, smart meter and network data, to investigate LV distribution network impacts of BEV uptake.
• Provide recommendations to Distribution Network Operators (DNOs) for preliminary demand management strategy of BEV demand.
• Develop a statistical method combining real driving and charging data including fast charge events to examine the impact of fast chargers on driving patterns and investigate their role for the adoption of BEVs.
• Provide recommendations to private and public stakeholders planning the roll-out of BEV charging infrastructure.
16
17
Chapter 2. Review of Electric Vehicle and Charging Infrastructure Initiatives
A brief overview of BEV and charging infrastructure technology is presented in section 2.1. This is followed by a description of the latest UK policy and initiatives to support EV uptake, including support for charging infrastructure in section 2.2. A review of international and national projects and studies are described in section 2.3. Section 2.4 identifies a research gap and the contribution of this work to support the development of EV policy and charging infrastructure roll-out in the UK.2.1BEV and Charging Infrastructure Technology Overview
Battery electric vehicles (BEVs) were introduced to the mass market in 2010 [42]. A BEV does not have an internal combustion engine and it is propelled using an electric motor and electricity stored in an on-board battery. A common BEV model in the UK (circa 2010- 2016) has a 24 kilowatt-hour (kWh) Lithium-ion battery2 capacity and an advertised driving range of 200 km. A selected number of BEV models available in the UK are shown in Table 1. The typical cost of a BEV is at least £20,000 after government purchase subsidy. BEV high purchasing cost, mainly due to the expensive battery pack, is one of the main barriers to adoption [40], [41]. However, battery cost is falling [74]. While the purchasing cost of BEVs has remained steady for the past 6 years since their introduction, it can be noticed from Table 1 that battery capacity is increasing. For example, the Nissan LEAF was first introduced with a 24 kWh battery in 2010 and the new 2018 model has a 40 kWh battery for a similar price range. Car manufacturers are introducing bigger battery capacities to make BEVs more attractive by increasing their limited driving range compared to liquid-fuel vehicles.
2 A lithium-ion battery is a family of rechargeable battery types in which lithium ions move
from the negative electrode to the positive electrode during discharge and back when charging. Lithium-ion battery technology have high energy and power densities making it suitable for automotive applications. Current BEV models almost exclusively use lithium-ion traction batteries [73].
18
Make Model Country of Origin Year
Introduced Battery Capacity Advertised Range
BMW i3 Germany 2014 22 kWh 190 km
Mitsubishi iMiev3 Japan 2010 16 kWh 160 km
Nissan LEAF Japan 2010 24 kWh 200 km
Nissan LEAF Japan 2016 30 kWh 250 km
Nissan (new) LEAF Japan 2018 40 kWh 375 km
Nissan e-NV200 Japan 2012 24 kWh 170 km
Renault ZOE France 2013 22 kWh 240 km
Renault ZOE France 2016 41 kWh 400 km
Tesla Model 3 US 2019 50-75 kWh 350-500 km
Table 1: Information on selected BEV models available in the UK [75]–[78].
There are 3 options for charging a BEV: conductive, inductive (also called wireless) and battery swapping methods.
Battery swapping could take few minutes which is comparable to refuelling a conventional ICE vehicle; however, the early initiatives for battery-swapping have failed. Better Place was the main commercial company providing battery swapping. With approximately $1 billion in funding and partnerships with major BEV manufacturers, Better Place constructed battery-swapping stations and partnered with a major BEV manufacturer to develop battery swap-capable cars. The company launched in 2007 and declared bankruptcy in 2013. The capital cost for BEVs was still high and consequently the demand was low, which is one of the main reasons for the failure of the company [79].
With inductive charging, no wires are used and energy is transferred to the vehicle using an electromagnetic field. Prototype inductive charging pads have been showcased by
Qualcomm Technologies [80]; however, BEV capable of inductive charging and inductive chargers are not yet commercially available. While there are still barriers to
commercialisation, inductive charging could increase the availability of BEVs to support the power system by overcoming the requirement to make sure the cars are always plugged when parked. To support the development of inductive charging, the UK government announced in 2018 a multi-million R&D programme to develop and trial low cost wireless charging [31].Conductive charging (i.e. wired) is currently the de facto charging method and conducive charging equipment is commercially available.
19
Alternating current (AC) and direct current (DC) are used for wired charging. AC charging is typically used with low-rate power chargers (e.g. 3.8 kW, 7.7 kW) and these chargers are typically installed at home, work and in public parking places. Charging a BEV battery from empty to full state of charge using these low-rate power chargers would take several hours. BEV batteries require DC power to be charged and the electricity network delivers AC power. Consequently, an AC/DC converter is installed on-board of the vehicle to allow battery charging. While 23kW AC chargers exist, the on-board charger of most current EV models don’t accept this charging rate. For example, the Nissan LEAF is fitted with a 3.3 kW on-board charger and it could be fitted with an optional 6.6 kW. This means that a LEAF plugged to a 22kW AC charger would be charging at a maximum rate of 6.6 kW. The BMW i3 is fitted with a 11kW on-board charger, Tesla model S is fitted with a 23kW on-board charger and the Renault ZOE is fitted with a 43kW on-board charger [81].
Charging at higher rates (e.g. 50kW, 120 kW) is typically carried out using publicly available DC charging stations. With these higher power levels, the converter is bigger and more expensive and consequently it is installed in the charging station instead of the car [75], [82], [83]. Charging a 24kWh/30kWh BEV battery from empty to 80% of full state of charge using 50kW chargers would take approximately 30 minutes.
Different charging standards and connectors for conductive charging have emerged since the introduction of BEVs to mass market. The different standards could be contributed to industrial competition and diverging interests. For AC, the most common plug is the type 2 connector [83]–[85]. The 2014/94/EU Directive stated that charge points should adopt at least the Type 2 “Mennekes” connector (EN 62196-2) [86]. The UK adopted this requirement as stated in the Alternative Fuels Infrastructure Regulations 2017 [87]. For DC, there are 3 main charging standards and associated connectors. The Combined Charging System (CCS) standard is supported mainly by European and US automakers. The CCS connector on DC charge points is required by the EU Directive EN 62196-3 and UK regulation [86], [87]. The CHAdeMO standard is supported by the Japanese automakers, and TESLA developed its own proprietary DC Supercharger network (120 kW) [75]. In the UK, multi-standard DC fast chargers with both CHAdeMO and CCS plugs are common [64].
20
Typical charging points power rating (circa 2010- 2018) and locations are summarised in Table 2.
Typical charging power rating (kW) Typical location AC/DC
Up to 3.8 kW Home, work, public AC
>3.8kW to <= 22kW Work, public AC
50 kW, 120kW ( for TESLAs) Public (e.g. at motorway service stations) DC
Table 2: Information on typical charging points used by light duty BEVs (circa 2018).
Several companies developed low power charge points that can be readily installed at home and work locations. The starting cost of a home charge point is approximately £300 after government subsidy (circa 2018) [88]. There were approximately over 14,000 public charging points in the UK at the beginning of 2018, funded by the government and the private sector (e.g. car companies, charge network operators) [89], [90]. These charging points form a fragmented public charge network, which is run by over 20 charging network operators. Some operators provide national coverage (e.g. Charge Your Car, Ecotricity) while others provide regional coverage (e.g. Plugged-In Midlands, Greater Manchester EV). Some charge points can be accessed with a Radio-frequency identification (RFID) card; phone application or simply using a contactless bank card. RFID and a phone application are still specific to individual network operators meaning that several identification and access cards might be required to access more than one charge network. Moreover, some charge points are free to use while other points are accessible with fees such as price per time, price per energy used or a combination. There are several websites that provide information on charge points such as location, power rating, and access and payment methods [90], [91].
21
2.1.1 Emerging EV Charging Technology (ultra-fast chargers and bidirectional chargers)
With the continuous growth of the EV market new charging technology is being developed, namely ultra-fast chargers and bidirectional chargers.
The associated charging time using a common 50kW fast charger is approximately 30 minutes. In contrast, higher power-rate charging (150-350 kW) called extreme-fast chargers in the US and ultra-fast chargers in Europe are being developed to reduce EV charging time significantly, making it comparable to refuelling a conventional vehicle. This could become particularly relevant with the increase in vehicles’ battery size. Currently (circa 2018), no BEV on the market can charge using a 350 kW charger [92], [93].
There are many technological and economic barriers facing the deployment of ultra-fast chargers. The US DOE assigned a team of researchers from Idaho National Lab, Argonne National Laboratory and the National Renewable Energy Laboratory to assess the feasibility of high rate charging up to 350 kW. The study, published in a series of papers, identified barriers preventing the implementation of extreme-fast charging with regards to battery technology; battery cell and pack design and thermal considerations; vehicle design
considerations including progress in power electronics design; infrastructure and economic feasibility. For example, the EV battery pack must be able to accommodate the
electrochemical and thermal demands of extreme-fast charging and the on-board
electronics must be capable of handling high charging power. Power electronics would need to handle up to 1200V, up from 600V or less in most of current vehicle models, and this would add cost and complexity to vehicles’ development. The study also identified potential research, development and deployment activities to address the gaps [94], [95]. Some examples of early deployment of ultra-fast chargers are mentioned in section 2.3.1.
22
Bidirectional chargers allow vehicles to be charged and discharged in response to a control signal. The control of charging rate and the reverse power flow aim to optimise the
operation of the power system [7], [96], [97]. In the case of discharging (i.e. reverse power flow), the car is considered as a generator and the charger or the car (depending on where the export inverter is installed) would need to comply with relevant distribution grid codes to ensure the bidirectional system meets safety and power quality standards. Bidirectional chargers are an emerging new technology with very few models currently available for purchase (circa 2018). In addition, only few EV models allow bidirectional charging (i.e. Nissan LEAF, Nissan eNV200 and the Mitsubishi Outlander PHEV). Many technical, economic and regulatory barriers still face mass deployment of bidirectional chargers. The UK
government has recently invested £30M in 21 projects including large scale real world demonstrators to support the development of bidirectional chargers, also referred as vehicle-to-grid (V2G) chargers. Most of the announced projects are developing bidirectional DC chargers with power ratings ranging between 6 and 15 kW. For these DC chargers, the export inverter (i.e. DC to AC inverter) would be installed inside the charger. In contrast, for an AC charger the export inverter would be installed in the vehicle.
2.2UK Government Support for Electric Vehicles
The UK government’s ambition is that by 2050 almost every car and van will be
zero-emission, with BEVs playing a key role in achieving this target. Replacing liquid-fuel vehicles by EVs could improve air quality, reduce GHG emissions and deliver economic benefits to the UK. For example, one in five BEVs sold in Europe in 2016 was made in the UK [98].
Recognising the benefits of electric transport, the government is investing over £1 billion between 2015 and 2021 to boost the number of EVs on UK roads. The funding is used to launch awareness campaigns, support vehicle demonstrator trials, provide car-subsidies grants, invest in R&D projects such as the latest Faraday Challenge Fund to improve the design and manufacture of batteries for the automotive sector, and deploy charging infrastructure [35], [37], [99]–[104].
23
2.2.1 UK Government charging infrastructure strategy
The UK government acknowledges that having adequate charging infrastructure is
fundamental to adoption of EVs. In 2011, the government’s Office for Low Emission Vehicles (OLEV) published its initial vision for the development of charging infrastructure to support EV adoption in the UK. The Strategy included the steps needed to be undertaken by the government and industry to ensure a successful provision of national charging
infrastructure. The Strategy identified home charging as the primary charging location, followed by workplace for whom charging at home is not practical or sufficient. In addition, the charging infrastructure would be complemented with a targeted amount of public infrastructure, including on-street chargers and fast chargers [105].
To this end, grant schemes were put in place to support the installation of charge points at private and public locations.
OLEV implemented the Plugged-in Places (PiP) scheme between 2010 and 2013 that
accelerated the roll-out of charging infrastructure in the UK. The scheme made available up to £30 million to eight regions to install charging infrastructure. OLEV offered match-funding to businesses and public sector organisations and over 5,500 charging points were installed by June 2013 [106]. Additionally, OLEV offered funding to install charge points at public sector estate (e.g. city councils). It also made available funding to train operating companies to cover up to 75% of the capital costs of procuring and installing charging infrastructure at train station parking spaces between 2013 and 2015 [107].
OLEV’s EV HomeCharge and Worplace Charging schemes currently provide support towards the up-front costs of the purchase and installation of charging points. Up to £500 including VAT is granted towards the total capital costs of a domestic charge point. For the workplace, the contribution is limited to £300 for each socket up to a maximum of 20 across all sites for each application. In addition, OLEV currently provides grants to local authorities to install on-street residential charge points. The funding covers 75% of the capital costs of procuring and installation charge points and associated dedicated parking bay (where applicable) [100].
24
The ‘Go Ultra Low (GUL) cities’ is a joint partnership between the government and several car manufacturers. Four cities were granted £35 million in 2016 to raise awareness on EVs and the funding included grants to install charging infrastructure. For example, car-charging street lighting would be installed in Hackney-London; Bristol would install up to 80 charge points across the city including fast chargers (50+kW); 230 charge points would be installed in Nottinghamshire and Derby. An additional £5 million of development funding was
awarded at the same time for specific initiatives in Dundee, Oxford, York and the north east regions. For example, Newcastle is installing a fast charger filling station in the middle of the city including up to 8 chargers [37].
Highways England (known as Highways Agency before April 2015) is a government owned company which manages the Strategic Road Network (SRN) in the UK (motorway and major A roads). Highways England presented to Parliament its road investment strategy for the 2015-2020 period. The company stated that it is committed to installing charging points every 20 miles on the SRN; and that wherever it is possible, these charge points would be typically fast chargers that would allow the car to be charged in less than 30 minutes [108]. The Clean Growth Strategy published by the Department for Business, Energy and Industrial Strategy in 2017 mentioned that the Highways England allocated £15 million for the roll-out of fast charge points [109].
The 2017 Autumn Budget- an economic statement made by the government every year identifying spending- announced further measures to support EVs including investing £200 million, to be matched by private investment into a new £400 million Charging Investment Infrastructure Fund to further develop and expand the UK’s EV charging infrastructure [110].
2.2.2 Automated and Electric Vehicles Bill
A key enabler in delivering the charging infrastructure to support the anticipated uptake of EVs is the government’s new “Automated and Electric Vehicles Bill”[98].
25
At the time of writing of this thesis, the government is currently legislating the “Automated and Electric Vehicles Bill”. This Bill proposes a regulatory framework to prepare for the expected increase in the presence of automated and electric vehicles in the UK. The Bill would empower the government to set standards and to regulate some aspects of the EV industry if necessary in future years. This Bill supplements existing legislation on electric charging points in the UK (i.e. EU Directive 2014/94/EU, known as the ‘Alternative Fuels Infrastructure Directive’) [98].
A consultation process was put in place to seek views on what measures should be included in the Bill to support the uptake of EVs. The consultation ran for one month in 2016 and collected input from car manufacturers, charging infrastructure manufacturers and operators, associations, public bodies, electricity network operators, etc. Answers and summaries are published online [28].
Based on the answers receiving from the consultation process, the government made a decision on what to include in the Bill, which is proposing regulatory change to expand and improve the network of charge points in the UK. This include improving consumer
experience when locating, accessing and paying for the usage of public charging. The Bill also includes powers to mandate the provision of sufficient infrastructure at strategic sites to cater for longer journeys, including motorway service areas. In addition, the Bill provides powers to require future charge points to be responsive and enable demand management to support the electricity network [98].
There are several stages that a proposed bill needs to pass before it becomes law. A
proposed bill needs to complete all the parliamentary stages in both the House of Commons and the House of Lords. The parliamentary stages include several readings of the proposed bill and the invitation of experts and stakeholders to share their insights to explore how the bill could be improved to make a greater impact. Once these stages are completed in both Houses, the bill is ready to receive royal asset, which is when the Queen formally agrees to make the bill into an Act of Parliament (law). The practical implementation of an Act is the responsibility of the appropriate government department, not Parliament [111].
![Figure 2: Electric vehicles' market share in the UK between 2010 and 2016 [39].](https://thumb-us.123doks.com/thumbv2/123dok_us/1226306.2665194/18.892.86.751.82.453/figure-electric-vehicles-market-share-uk.webp)
![Figure 12: Different road gradients and the related BEV energy consumption [71].](https://thumb-us.123doks.com/thumbv2/123dok_us/1226306.2665194/66.892.94.658.639.1092/figure-different-road-gradients-related-bev-energy-consumption.webp)