442 The Open Cybernetics & Systemics Journal, 2014, 8, 442-447
1874-110X/14 2014 Bentham Open
Open Access
Meter Data Management Design Based on Big Data Technologies
Yuanbin Xu
1,*, Huafei Yang
2, Baoping Zou
1, Wensi Huang
1, Donghua Li
2and Ming Cheng
21Great Power Science and Technology Stock Co., LTD, Fuzhou Software Park Area B, Gulou District, Fujian Province, China; 2NARI Accenture Information Technology Center Co., LTD, Building NO. 29 Zhongguancun Software Park, Haidian District, Beijing, China
Abstract: Smart meter management system is intended for user information collection, processing and real-time monitor-ing. To deal with the huge amount of data obtained by the system with the smart meter in large-scale is a very important issue. This article conducts system architecture design reference and store and read performance testing based on the analysis of the current system status and business needs. It gives an optimization design for the future development of the smart meter management system.
Keywords: Big data, meter data management system, optimization design, smart grid, smart meter.
1. INTRODUCTION
Along with the construction of smart grid and the com-prehensive application of the smart meter management sys-tem pilot projects, a lot of smart meters and sensing devices are centralized which produce a large amount of data. These data’s are valuable to the State Grid Corporation of China (SGCC) [1, 2]. Storing and managing these vast amounts of data through the big data management platform, and to pro-vide technical support for the smart grid analysis application is very important [3-5].
According to the smart meter management system’s de-mand for data storage and access, the optimization of large-scale smart meter data storage [6] and reading should be de-signed in order to meet the demand of data management analysis applications for the SGCC.
The effective management of the increasing amount of data has become a huge challenge for scientific research, engineering and information services [6]. Huge amounts of data propose the huge demand of large-scale network storage environment, and the existing large-scale network storage technology is insufficient to meet the needs of the distribu-tion of big data management applicadistribu-tions in high perform-ance, concurrent, comprehensive efficiency, distribution management, safety and availability, data consistency, scal-ability and reliscal-ability [7-9]. Therefore, research on large-scale network storage technology is of great significance. The current situation and future performance and business requirements of the system involved the big data storage and are expounded in detail in this paper [10]. A rational optimi-zation design is carried out on the system configuration of software and hardware in data storage and reading optimiza-tion view. At the same time, the effective soluoptimiza-tion is put forward [11-13].
2. STATUS OF THE SMART METER MANAGEMENT SYSTEM
2.1. The Big Data Characteristics of Smart Meter Man-agement
Variety: Four types of data which include structured data, unstructured data, spatial geographic information and huge amounts of real time data about customers, revenue and marketing equipment.
Volume: Huge amounts of data (500 t), large number of users (230 million), 365 days a year non-stop running, high frequency and large amount of data access. Taking a prov-ince as an example, the number of customers is about 20 million, collecting electricity information once per hour, and the amount of data a day is 480 million. If this data capture is expands after every 1 to 2 months, there are at least 10 mil-lion times more information each month. The customer serv-ice centre calls are about 150000 a year.
Velocity: Electricity information collection frequency is high, the quantity is large, need timely processing, process-ing vast amounts of real-time data management services.
Value: The big data technology can enhance marketing management ability, to improve customer satisfaction, to find electricity theft behavior, to reduce the management line losses, to provide usage strategy services, to increase the profit of the grid companies, to enhance their ability to inter-act with customers, and to promote the orderly power utiliza-tion management.
2.2. System Application Condition and Requirement
The key point of the application is the storage/query, par-allel analysis and deep mining of huge amount of data, re-ceipt of real-time and high frequency data from mass end-points [1]. During the 12th five-year period, the number of smart meters will reach 230 million, acquisition frequency would be once per day for ordinary users and 96 times per
day for designed and variable load, data acquisition flow develops from one-way to two-way interaction.
The exponential growth of the size and frequency of the electricity information collection, storage, query, and analy-sis puts forward the pressing needs of the handling ability of the whole life cycle of data.
1) User data and smart meter reading data storage and query: user can customize data acquisition task to collect user data and smart meter reading data regularly, and store them to corresponding database table according to the cate-gories. The system provides the data query function accord-ing to query conditions such as the user, watt-hour meter, wiring, terminal, measurement point, area, units and cus-tomer groups to conduct statistical analysis of data acquisi-tion for a period of time. By completing the acquisiacquisi-tion and calculation of electricity data from the previous and none from the current day before 8 am, The system can respond to users’ statistical analysis requests in a relatively short time.
2) User power calculation statistics: The system supports manual and automatic power calculation functions. Manual power calculation supports capacity calculation according to measurement point and according to the user type. In addi-tion the system provides statistical power informaaddi-tion of the peak, flat and valley according to the area and measuring points. Power analysis can provide statistical analysis func-tions such as electricity peak-valley analysis, comparative analysis, mutation analysis, sequential analysis, and trend analysis. Moreover it can rank the electricity consumption of the users. Completing the electricity statistics calculation of the previous day before 8am can make the system respond to users’ statistical analysis such as peak valley analysis and comparative analysis.
3) Area line loss calculation analysis: Users can custom-ize area loss model. The area line loss can be carried out according to the time. The system can query the information of evaluation unit such as power loss and attrition rate ac-cording to the unit and the evaluation number during a cer-tain period of time. You can click to view points of the loss curve of the inspection unit and measuring power details. Completing the area loss calculation of the previous day be-fore 8am can accurately and quickly provide a loss model of the user including attrition rate, power loss and loss details.
4) Packet data analysis: The system provides inquiry function of terminal data frame according to the terminal source. The results of the analysis include the terminal code, data frame of time, the main address, transmission direction and content of data frame and so on. It can help users ana-lyze problems arising from the communication process. When there is fault in the terminal communication, it can help to quickly find the terminal communication message for users to analyze, to solve the problem as soon as possible.
5) Complete data acquisition rate calculation analysis: The system can provide inquiry function of users’ complete hourly unit statistical data for a whole day according to the data collection condition. Acquiring the electricity data of the previous day before 8amand enable faster statistical data acquisition of the whole range can help the user to analyze the data collection condition.
6) File class data ETL: The province system supports data extraction function around the city, for the whole prov-ince's statistical analysis. In addition, the acquisition system supports files synchronization from marketing library. Up-dates the collection system in a timely manner according to the marketing files’ transformation, and guarantees the ac-quisition system files stay the same with marketing files.
7) Abnormal matter handling: Record the system abnor-mal events that appear in the system running process into the database. The system provides the query analysis function to find the abnormal events in a certain period of time accord-ing to the abnormal events type and the object types, so that it can analyze the operation of the equipment. The abnormal events appeared in the system running process are timely monitored, users can find and solve problems in time accord-ing to the results of statistical analysis, to ensure the normal order of the collecting process.
8) Power load analysis: The system supports relevant sta-tistical analysis function according to the load information collected. The load analysis supports statistical load curve information according to the unit, area, users, terminals, ter-minal groups and customer groups, to show the load change trend. In addition it can also provide statistical analysis of monitoring load depending on the type of unit and measure-ment points. The system can quickly provide users electricity load changes, to help the user have a better analysis of the load curve trend.
9) Power theft analysis: The system can comprehensively analyze the information when power differential is out-of-limit, or the phase is out-of-out-of-limit, or abnormal events hap-pen. The comprehensive analysis of the information of volt-age, power and abnormal items for the user can provide more accurate analysis on power theft, and to help users to find power theft timely, reducing the loss of the user.
2.3. Improve Directions
As the terminal numbers rapidly increase, and sampling frequency surges, and more requirements on business system are imposed, and the increase of the complexity of the busi-ness, the provincial power companies face the bottleneck pressure of shortage of database performance in different levels. Some optimization technology such as table partition-ing, materialized views, data compression and SQL can re-lieve the stress moderately. Oracle RAC adopts Share (Share Disk) structure, as a result, it loses extensible advantages and has read and write I/O bottlenecks, all of this make it diffi-cult to perfectly solve the bottleneck problems of storage and computational statistics and query of the mass electricity acquisition data. Considering Oracle has a strong advantage in transactional consistency processing, the transaction in-tensive tasks (such as data source file management, etc.) should be supported by the Oracle database; And a lot of statistics, analysis, calculation and query processing needs to adopt a more effective method, to form a complementary and compatible architecture.
Each company has realized the basic function in accor-dance with its standard requirements, and developed charac-teristic applications according to the requirements. The ap-plication effect is generally well. Through investigation, the
companies have universal performance improvement needs in nine aspects such as data storage and query, electricity consumption statistics, area line loss calculation and analy-sis.
The comprehensive present situation of the provincial companies can help support marketing system construction. Technical architecture should be optimized and performance should be improved gradually in aspects such as mass data storage, query, analysis, and data exchanged between other related applications.
3. MASS DATA STORAGE AND READING PER-FORMANCE TESTING
3.1. Platform Architecture Suggested
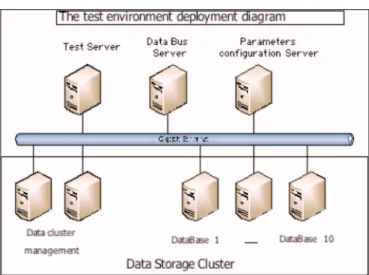
Data Cluster management (DCM): Receive the request of storage and read request from the bus, then decompose the task to multiple databases based on parallel execution en-gine, and finally send the summarized results back to the bus, Oracle Enterprise 10g (64-bit) or above (Fig. 1).
Database instance: storage of the real-time/historical data of the database. In this testing task, the real-time data-base is installed. Single instance is a real-time datadata-base of 4 million station capacity (64-bit).
Data bus server: Install bus software products as the test bus. Tibco ems 6.1 (64 - bit)
Parameters configuration server: Store data cluster management configuration parameters and install the rela-tional database.
The test server: The test program of simulation of the storage and reading runs on this server.
3.2. Data Environment
The scale of the test is 4 million smart meters, each sam-ple is 10 points (as shown in the Table), the total scale of the test is 40 million points.
Fig. (1). Reference architecture.
3.3. Storage and Reading Performance Testing 3.3.1. Test Indicators
Take provincial grid companies’ electricity information collection for example, the installation scale of the smart meters is 18 million, sampling frequency is 15 minutes. As request, data storage capacity at second level is not lower than 22000 meters.
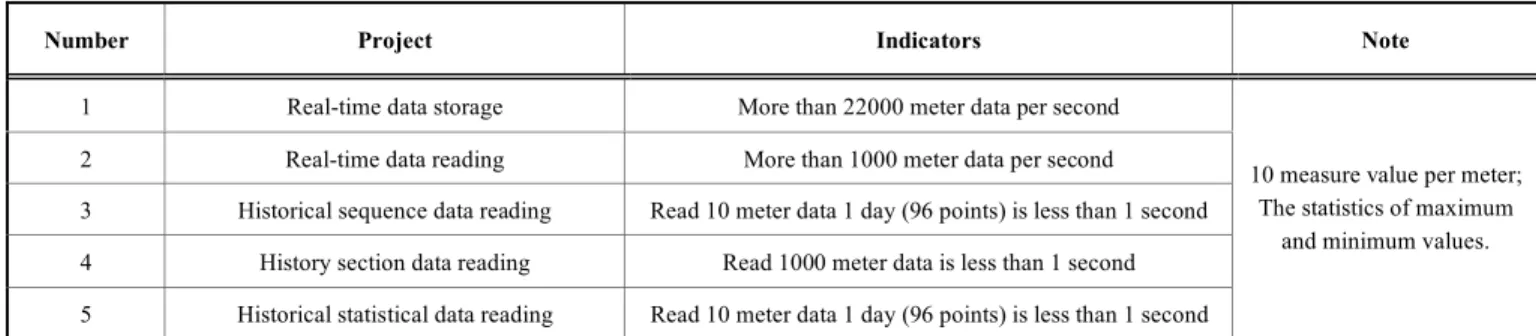
In view of the above requirements, formulated the main indicators of the test shown in the Tables 1 and 2:
3.3.2. Test Tools and Test Methods
Performance monitor: Performance monitoring tools integrated by operating system, for the system resources monitoring.
Data simulator: Simulation testing tools of data storage and reading self-developed by laboratory.
Java Visual VM performance monitor: Used to moni-tor the resource utilization of Java process.
Table 1. The scale of the smart meters.
Number Data Type Unit Frequency
1 AB line voltage kV 15 min
2 BC line voltage kV 15 min
3 CA line voltage kV 15 min
4 A phase current A 15 min
5 B phase current A 15 min
6 C phase current A 15 min
7 The current total active power kW 15 min
8 The current total active power kVar 15 min
9 The current positive active power value kWh 15 min
3.3.3. Test Methods
Through the test program simulates smart meters which produce data every 15 minutes and store the data to database. Simultaneously access the test procedure to simulate multi-ple clients who concurrently access to read the data. Ana-lyzed the reliability of data reading and writing and access request response time. Monitor the process of CPU and memory utilization and operating system network load by the operating system performance monitor and JVM per-formance monitor during the test.
The test logic is shown in the Fig. (2):
Data Storage Performance Test Procedure Data Read Performance Test Procedure
Data Cluster Management Simulation
Data Data Model
Database
Instance 1 __ Database Instance 10
The Test Logic Diagram
Fig. (2). The test logic diagram.
3.3.4. Data Simulation Method
1) Simulation method of data storage test
Test program simulate data writing from multiple data sources, such as simulate 10 data sources, each data source produces 400000 meters data. Storage test program simulate the data obtained at the same time from multiple city bureau collection server and tested the performance of parallel storage.
2) Simulation method of data read test
Simulated the time of different applications to read part of the data.
3.3.5. Performance Statistics Method 1) Data storage time statistics
The time for data sending simulated in the test program is T1, the time when DCM finishes the last packet of data is T2, the storage time sum = T2 - T1. Storage time can be bro-ken down into several stages:
• Upload data by bus takes t3
• Downloaded data from the bus takes t4.
• Conversion data by DCM takes t5.
• Database storage time takes t6. Data storage time = t3+t4+ t5 +t6.
Synchronize the multiple server clocks through NTP be-fore the test.
2) Data reading time statistic
The time for the test program to send reading requests is T1, the time for the test program to receive requests is T2, the reading time is T2 - T1. Storage time can be broken down into several stages:
• Request commands transmission via the data bus takes t3.
• Conversion command by DCM takes t4.
• Reading data from the database takes t5.
• Processing data by DCM takes t6.
• DCM data bus transmission time takes t7.
• Client download data time takes t8. Data reading time = t3+ t4 +t5 + t6+t7 + t8. 3) Storage performance calculation method
Storage performance = meter data storage size/storage time, unit: meter data/ second.
4) Reading performance calculation method
Reading performance = meter reading data size/read time, unit: meter data/ second or measured value/ second. 3.4. Test Conclusion and Optimization Suggestions
Smart meter data mass storage and reading performance test work is accomplished in a test environment set up in Accenture Beijing technology institute. This test simulates 4 million meters data, each meter simulates 10 measuring points, and it has 40 million points and 13 test cases. These test cases include: data storage, query, statistics, inquiry and test data cluster management extensibility. The test results show that the scheme designed by Accenture Beijing tech-nology institute can meet the provincial grid companies’
Table 2. The main indicators of the test.
Number Project Indicators Note
1 Real-time data storage More than 22000 meter data per second 2 Real-time data reading More than 1000 meter data per second 3 Historical sequence data reading Read 10 meter data 1 day (96 points) is less than 1 second 4 History section data reading Read 1000 meter data is less than 1 second 5 Historical statistical data reading Read 10 meter data 1 day (96 points) is less than 1 second
10 measure value per meter; The statistics of maximum
requirements on large-scale smart meter data storage and reading performance successfully (Table 3).
1) The big data management platform developed by Ac-centure can meet the needs of large-scale smart meter data management successfully.
• Data storage performance greatly surpassed the re-quirements, such as single client data reading rate is 170000 meter per second, more than the indicator of 22000 meter per second;
• Real-time data query performance can meet the re-quirements of the indicators successfully, such as single client minimum query speed is 6000 meter per second, significantly higher than the indicator of 1000 meter per second;
• Statistical data query performance is significantly higher than the index requirements, such as query 10 meters statistical data a day takes 0.13 seconds, significantly better than the index requirement of 1 second;
• Through database instance extension (from one instance gradually expanded to 10) and the expansion of the da-tabase types (including NoSql, relational dada-tabase and a variety of real-time database products) test, shows that big data platform has good expansibility.
2) Analysis on the main influencing factors of the storage and reading performance and optimization suggestions
In the current data clustering software and hardware en-vironment, the test data of the data storage and reading per-formance shows that:
• When writing data, packet size has an impact on per-formance, so choosing the appropriate packet size ac-cording to the hardware and software environment can promote writing performance. In this test, the best data packet is 20000 meters. With the increase of data size and the configuration changes of corresponding system, the best packet size should be determined by the test.
• The size of the data query (such as: the size of the meter query or the time range of the historical data) has an im-pact on query performance. According the size of the business application the data query can design the best way to query, for example: decompose a mission of que-rying 100,000 meters into 10,000 meters, query 10 times in sequence or in parallel to improve query efficiency;
• Using the statistical computing functions built-in data-base as much as possible, to improve the efficiency of data query;
• Multi-client concurrent reading and writing can improve performance. For example: break 4 million writing data down to 10 parallel for the client, to reduce the time needed for writing, and improving writing speed.
• The main bottleneck is network bandwidth from the analysis of hardware usage data. CPU and memory utili-zation rate is relatively low, and improving the network bandwidth can improve data storage and reading per-formance.
3) Configuration scheme recommended for the typical provincial grid companies smart meter data management platform
The scale of the current test is 4 million meters and each meter has 10 measurement points. The actual scale of pro-vincial grid corporation electricity information acquisition may be between 1000 and 20 million meters. Based on the characteristics of big data management platform extensibil-ity, increasing the database instance or extension cluster scale can meet the needs of actual production. By analyzing the test result, the configuration advice is given targeted at 18 million meters data management platform.
CONCLUSION
The storage and processing platform designed in this pa-per is built on cheap server cluster, both as a distributed
stor-Table 3. The test result.
Category Name Configuration Requirements Running Instance
Data cluster management (DCM) server CPU : >32 core; memory : >128G; hard disk : >1TB; 5 Database server CPU : >32 core; memory : >128G; hard disk : >3TB; 60
Data bus server
CPU : >32 core; memory : >128G; hard disk : >1TB;
2 hardware
Switchboard Gigabit and above 2
Real-time database A single instance of 10 million station capacity 60
Data bus High performance data bus products 2
software
age of data and a data parallel computing process. It does not need additional purchase of expensive storage devices. Moreover it can make full use of currently existing hard-ware, thus can improve the utilization ratio of equipment and at the same time reduce the duplication of investment of the project. So the project cost can be controlled effectively.
At the same time, the platform has good horizontal scal-ability. Dynamic expansion can be done according to the business needs. It makes the cluster storage capacity and computing power achieve nearly linear growth. And cluster expansion is entirely operated online, business application system can realize data migration automatically and fast without downtime.
CONFLICT OF INTEREST
The authors confirm that this article content has no con-flict of interest.
ACKNOWLEDGEMENTS
Declared none.
REFERENCES
[1] China Smart Meter Industry Report, 10, 1-11, 2011.
[2] Smart Meter Roll Out: Market Model Definition & Evaluation Project. 7, 1-79, 2009.
[3] M. Brantner, D. Florescuy, D. Graf, D. Kossmann and T. Kraska, “Building a database on S3//ACM,” In: Proceedings of the SIG-MOD, Jun 9-12, Vancouver, BC. USA: ACM SIGMOD/PODS, 2008, pp. 251-263.
[4] R. Buyya, C. S. Yeo and S. Venugopal, “Market-oriented cloud computing: vision, hype, and reality for delivering IT service as computing utilities,” In: Proceedings of the 10th IEEE International Conference on High Performance Computing and Communications, Sept 25-27, Dalian, China. Los Alamitos, CA, USA: IEEE CS Press, 2008, pp.13-19.
[5] X.Q. Gong, C.Q. Jin, X.L. Wang, R. Zhang and A.Y. Zhou, “Data-intensive science and engineering: requirements and challenges”, Chin. J. Comput., vol. 35, no. 8, pp. 1563-1578, 2012.
[6] X. Meng and X. Ci, “Big data management: concepts, techniques and challenges”, J. Comput. Res. Dev., vol. 50, no. 1, pp. 146-169, 2013.
[7] R. Grossman and Y. Gu, “Data mining using high performance data clouds: experients studies using sector and sphere//ACM,” In: Pro-ceedings of the 14th ACM SIGKDD International Conference on Knowledge Discovery and Data Mining, New York. USA: ACM SIGKDD, 2008, pp. 920-927.
[8] M. Gen and Y. Yun, “Soft computing approach for reliability opti-mization: state-of-the-art survey”, Reliab. Eng. Syst. Safe., vol. 91, pp. 1008-1026, 2006.
[9] M. Kafil and I. Ahmed, “Optimal task assignment in heterogeneous distributed computing systems”, IEEE Concurr., vol. 6, 42-51, 1998.
[10] Big Data the Next Frontier for Innovation Competition and Produc-tivity, Jun 9-12, 2008, Vancouver, BC. USA: ACM SIG-MOD/PODS, 2008, 251-263.
[11] R. Buyya, C.S. Yeo and S. Venugopal, “Market-oriented cloud computing: vision, hype, and reality for delivering IT service as computing utilities,” In: Proceedings of the 10th IEEE International Conference on High Performance Computing and Communications, Sept 25-27, Dalian, China. Los Alamitos, CA, USA: IEEE CS Press, 2008, pp. 25-34.
[12] X.Q. Gong, C. Q. Jin, X.L. Wang, R. Zhang and A.Y. Zhou. “Data-intensive science and engineering: requirements and challenges”, Chin. J. Comput., vol. 35, no. 8, pp. 1563-1578, 2012.
[13] C. Kang and Z. Weimin, “Cloud computing: system instances and current research”, J. Softw., vol. 20, no. 5, pp. 1337-1348, 2009. Received: November 07, 2014 Revised: December 09, 2014 Accepted: December 11, 2014 © Xu et al.; Licensee Bentham Open.
This is an open access article licensed under the terms of the Creative Commons Attribution Non-Commercial License (http://creativecommons.org/-licenses/by-nc/3.0/) which permits unrestricted, non-commercial use, distribution and reproduction in any medium, provided the work is properly cited.
![Di μ sulfato κ4O:O′ bis[diaqua(1H imidazo[4,5 f][1,10]phenanthroline)manganese(II)] dihydrate](data:image/gif;base64,R0lGODlhAQABAIAAAP///wAAACH5BAEAAAAALAAAAAABAAEAAAICRAEAOw==)