CZECH TECHNICAL UNIVERSITY IN PRAGUE
FACULTY OF BIOMEDICAL ENGINEERING
Department of Biomedical Technology
Master Thesis
ČESKÉ VYSOKÉ UČENÍ TECHNICKÉ V PRAZE
FAKULTA BIOMEDICÍNSKÉHO INŽENÝRSTVÍ
Katedra biomedicínské techniky
Bridging the gap between rat and human
EEG-fMRI epilepsy studies
Master thesis
Study programme:
Biomedical and Clinical Technology
Field of study:
Biomedical Engineering
Author of master thesis:
B.Sc. Jihyeon Seo
Supervisor of master thesis: Ir. Willeke Staljanssens
Declaration
I hereby declare that I have completed this thesis with the topic “
Bridging the gap between rat
and human EEG-fMRI epilepsy studies
” independently, and that I have attached an
exhaustive list of citations of the employed sources to the Master thesis.
I do not have a compelling reason against the use of the thesis within the meaning of Section
60 of the Act No.121 / 2000 Coll., on copyright, rights related to copyright and amending
some laws (Copyright Act).
Acknowledgements
First of all, I would like to express my deepest gratitude to my supervisor, Willeke
Staljanssens for her consistent guidance and practical help on thesis work. Also, I want to
thank prof. Robrecht Raedt for verification of seizure detection and also for some advice on
EEG analysis. Other thanks go to Nathalie Van den Berge for her advice on fMRI data
analysis. Thanks to all of them, I was able to finish this Master thesis.
Also, I would like to thank Benedicte Descamps, prof. Christian Vanhove for their practical
support during the experiments. Without them, I could not have done the experiments as
planned.
Most importantly, I would like to express how grateful I am towards my family. They have
always supported me for whatever I wanted to do. Due to their unconditional love and support,
I could have the privilege doing my Masters in two beautiful European countries, Czech
Republic and Belgium and I was able to complete my Master thesis. Plus, I want to thank all
my close friends who were always ready to cheer myself up during the thesis writing period.
Without all these people, I could not have become who I am today. This master thesis period
has been extremely challenging but also enjoyable and worthwhile. I believe that this
experience will prepare me better for whatever it comes during the next stages of my life.
Thank you.
Bridging the gap between rat and human EEG-fMRI
epilepsy studies
Jihyeon Seo
Abstract
Scalp EEG-fMRI has been widely used in clinical epilepsy studies to accurately localize and delineate the epileptogenic zone. On the other hand, in rat epilepsy studies, a pair of implanted electrodes in hippocampus has been used instead of scalp electroencephalogram (EEG) since the EEG signal can be directly measured from the seizure onset zone. However, the invasiveness of this EEG method is a major drawback. In our study, we introduced the Magnetic Resonance (MR) compatible scalp EEG cap that is designed in our lab to simultaneous scalp EEG-fMRI rat epilepsy studies. The aim of the thesis was to examine whether the scalp EEG cap could effectively record seizures and whether it could aid simultaneous EEG-fMRI studies to study functional connectivity of the brain in resting state and in seizures. For this purpose, we performed standalone EEG recording in resting state, standalone functional Magnetic Resonance Imaging (fMRI) scanning in resting state and simultaneous EEG-fMRI in resting state and in evoked seizures. Kainic acid (KA) was injected to rats intraperitoneally to induce seizures. The EEG recordings were analyzed whether they could capture seizure activity. In addition, we analyzed fMRI datasets using three different methods which were 10x10 Region of Interest (ROI) correlation analysis, General Linear Model (GLM) analysis and Independent Component Analysis (ICA). The EEG recordings were able to show the seizures which were seen with repeated sharp waves and peaks in delta and theta frequency region. Next, the ROI correlation analysis result of the seizure datasets showed increased correlation coefficients but also decreased coefficients compared to the ones of the resting state dataset of the same rat. In addition, we carried out GLM analysis with the seizure scans that are confirmed by EEG recording. The GLM analysis of a seizure dataset resulted in showing the functionally connected brain regions during evoked seizures such as neocortex, cingulate cortex, striatum, corpus callosum and hippocampus. Besides, ICA showed the similar brain regions that were functionally connected for the dataset. Also, when the GLM analysis could not show any significant functionally connected brain region for another seizure dataset, ICA could extract the voxels of which their time series were highly correlated. These findings suggest that the MR compatible scalp EEG cap could be used as a valuable tool in rat EEG-fMRI epilepsy studies and could play a role as an experimental platform to bridge the gap between preclinical epilepsy studies and clinical epilepsy studies.
Contents
Contents List of Figures List of Tables 1 Introduction 1 2 Literature Review 3 2.1 The brain . . . 3 2.1.1 The neurons . . . 32.1.2 The anatomy of the brain . . . 5
2.1.3 Brain connectivity . . . 7
2.2 Electroencephalogram (EEG) and functional Magnetic Resonance Imaging (fMRI) . . . 7
2.2.1 Electroencephalogram (EEG) . . . 7
2.2.2 functional Magnetic Resonance Imaging (fMRI) . . . 9
2.2.3 Simultaneous EEG-fMRI . . . 11
2.3 Epilepsy . . . 12
2.3.1 Definition of Epilepsy . . . 12
2.3.2 Definition of epileptic seizure . . . 12
2.3.3 The classification of epilepsy . . . 12
2.3.4 Treatments . . . 13
2.4 Animal models of temporal lobe epilepsy (TLE) . . . 14
2.4.1 Kainic Acid model (KA) . . . 14
2.4.2 Pilocarpine model (PILO) . . . 15
2.4.3 Electric kindling model . . . 16
3 Materials and methods 17 3.1 Overview of the experiments . . . 17
3.2 Animal preparation and handling . . . 18
3.2.1 Preparation to EEG recording . . . 18
3.2.2 Preparation to MRI acquisition . . . 18
3.3 Seizure induction by KA (Kanic Acid) . . . 18
3.4 EEG recording . . . 19
3.5 MRI acquisition . . . 21
3.6 Processing of the EEG data . . . 23
3.7 Processing of the fMRI data . . . 23
3.7.1 Preprocessing . . . 23
3.7.2 Postprocessing . . . 26
4 Results 29 4.1 EEG data analysis . . . 29 4.1.1 Simultaneous EEG-fMRI measurement when seizure induced, 21/03/2016, Rat 3 29
4.1.2 Simultaneous EEG-fMRI measurement when seizure induced, 22/03/2016, Rat 3 34
4.2 10 x 10 ROI correlation analysis . . . 39
4.2.1 fMRI standalone scanning in resting state, 26/11/2015, Rat 2 . . . 39
4.2.2 Simultaneous EEG-fMRI measurement in resting state, 27/11/2015, Rat 2 . . . . 40
4.2.3 fMRI standalone scanning in resting state, 03/03/2016, Rat L1R0 and Rat L1R1 . 41 4.2.4 Simultaneous EEG-fMRI measurement in resting state, 04/03/2016, Rat L1R0 and Rat L1R1 . . . 43
4.2.5 fMRI standalone scanning in resting state, 21/03/2016, Rat 3 . . . 45
4.2.6 Simultaneous EEG-fMRI measurement when seizure induced, 21/03/2016, Rat 3 46 4.2.7 Simultaneous EEG-fMRI measurement when seizure induced, 22/03/2016, Rat 3 47 4.3 GLM analysis . . . 48
4.3.1 Simultaneous EEG-fMRI measurement with seizure induced, 21/03/2016 . . . . 48
4.3.2 Simultaneous EEG-fMRI measurement with seizure induced, 22/03/2016 . . . . 50
4.4 ICA analysis . . . 52
4.4.1 Simultaneous EEG-fMRI measurement when seizure induced, 21/03/2016 . . . . 52
4.4.2 Simultaneous EEG-fMRI measurement with seizure induced, 22/03/2016 . . . . 53
5 Discussion 55 5.1 EEG data analysis . . . 55
5.2 fMRI data analysis . . . 55
5.2.1 10 x 10 ROI correlation analysis . . . 56
5.2.2 GLM analysis and ICA analysis of the seizure datasets . . . 57
5.3 Limitations of the current work and possible future works . . . 57
6 Conclusion 59
List of Figures
2.1 The neuron [1] . . . 4
2.2 The structural types of neurons [1] . . . 5
2.3 The whole structure of the brain [1] . . . 6
2.4 The lobes of the brain [2] . . . 6
2.5 The different types of EEG depending on the invasiveness [3] . . . 8
2.6 The pyramidal neurons that majorly contribute to the EEG signal [4] . . . 8
2.7 The international 10-20 EEG system seen (A) from the left side and (B) from above the head [5] . . . 9
2.8 The structure of the MRI scanner [6] . . . 10
2.9 BOLD signal shows initial dip and then a more prolonged positive signal [7] . . . 11
2.10 Epileptiform patterns represented on EEG after intrahippocampal injection of KA (adapted from [8]) . . . 15
3.1 Timeline of the medetomidine sedation during MR acquisition . . . 19
3.2 The scalp EEG system for rats [9] . . . 20
3.3 Demonstration of EEG standalone recording setup . . . 20
3.4 Spatial distribution of the electrodes of the EEC cap . . . 21
3.5 Fixation way of the cap on the rats [9] . . . 21
3.6 The demonstration of EEG-fMRI setup on a rat . . . 22
3.7 MRI rat head volume coil used with 7T MRI scanner [9] . . . 23
3.8 ROI drawing of the rat 2 of 26/11/2015 and 27/11/2015 dataset . . . 26
3.9 ROI drawing of the rat L1R0 of 03/03/2016 and 04/03/2016 dataset . . . 27
3.10 ROI drawing of the rat L1R1 of 03/03/2016 and 04/03/2016 dataset . . . 27
3.11 ROI drawing of the rat 3 of 21/03/2016 and 22/03/2016 Seizure dataset . . . 27
4.1 Resting state before fMRI EPI session was started . . . 30
4.2 Seizure started before fMRI EPI session was started . . . 31
4.3 Seizure shown during the first fMRI EPI session . . . 32
4.4 Seizure shown during the second fMRI EPI session . . . 33
4.5 Residual seizure activity shown at the beginning of EEG before fMRI EPI session started 34 4.6 After 50 minutes more pronounced seizure shown before fMRI EPI session started . . . 35
4.7 Seizure shown during the first fMRI EPI session . . . 36
4.8 Seizure shown during the second fMRI EPI session . . . 37
4.9 Seizure shown during the third fMRI EPI session . . . 38
4.10 ROI correlation matrix of fMRI standalone scanning in resting state, 26/11/2015, Rat 2 . 39 4.11 ROI correlation matrix of simultaneous EEG-fMRI measurement in resting state, 27/11/2015, Rat 2 . . . 40
4.12 ROI correlation matrix of the fMRI standalone scanning in resting state, 03/03/2016, Rat L1R0 . . . 41
4.13 ROI correlation matrix of the fMRI standalone scanning in resting state, 03/03/2016, Rat L1R1 . . . 42
4.14 ROI correlation matrix of the simultaneous EEG-fMRI measurement in resting state, 04/03/2016, Rat L1R0 . . . 43 4.15 ROI correlation matrix of the simultaneous EEG-fMRI measurement in resting state,
04/03/2016, Rat L1R1 . . . 44 4.16 ROI correlation matrix of the fMRI standalone scanning in resting state, 21/03/2016, Rat 3 45 4.17 ROI correlation matrix of the simultaneous EEG-fMRI measurement when seizure
in-duced, 21/03/2016, Rat 3 . . . 46 4.18 ROI correlation matrix of the simultaneous EEG-fMRI measurement when seizure
in-duced, 22/03/2016, Rat 3 . . . 47 4.19 The 40sec-20sec-40sec design matrix of the simultaneous EEG-fMRI measurement when
seizure induced dataset, 21/03/2016 . . . 48 4.20 GLM result of the 40sec-20sec-40sec model of the simultaneous EEG-fMRI
measure-ment when seizure induced dataset, 21/03/2016 . . . 49 4.21 The 20sec-40sec-20sec design matrix of the simultaneous EEG-fMRI measurement when
seizure induced dataset, 21/03/2016 . . . 49 4.22 GLM result of the 20sec-40sec-20sec model of the simultaneous EEG-fMRI
measure-ment when seizure induced dataset, 21/03/2016 . . . 50 4.23 The 40sec-20sec-40sec design matrix of the simultaneous EEG-fMRI measurement when
seizure induced dataset, 22/03/2016 . . . 51 4.24 GLM result of the 40sec-20sec-40sec model of the simultaneous EEG-fMRI
measure-ment when seizure induced dataset, 22/03/2016 . . . 51 4.25 The 20sec-40sec-20sec design matrix of the simultaneous EEG-fMRI measurement when
seizure induced dataset, 22/03/2016 . . . 51 4.26 GLM result of the 20sec-40sec-20sec model of the simultaneous EEG-fMRI
measure-ment when seizure induced dataset, 22/03/2016 . . . 52 4.27 BOLD fMRI response map of the simultaneous EEG-fMRI measurement when seizure
induced dataset, 21/03/2016 . . . 52 4.28 BOLD fMRI response map of the simultaneous EEG-fMRI measurement when seizure
List of Tables
3.1 The overview of the experiments that were performed . . . 17
3.2 Parameters of each fMRI EPI dataset . . . 24
3.3 Parameters of each anatomical T2 dataset . . . 25
3.4 The order and the region of the brain of ROIs . . . 26
4.1 The regions that showed high correlation bilaterally, fMRI standalone scanning on 26/11/2015, Rat 2 . . . 39
4.2 Inter-regional high correlation value of fMRI standalone scanning on 26/11/2015, Rat2 . 40 4.3 The regions that showed high correlation bilaterally, simultaneous EEG-fMRI measure-ment in resting state, 27/11/2015, Rat 2 . . . 40
4.4 Inter-regional high correlation value of Simultaneous EEG-fMRI measurement in resting state, 27/11/2015, Rat 2 . . . 41
4.5 The regions that showed high correlation bilaterally, the fMRI standalone scanning in resting state, 03/03/2016, Rat L1R0 . . . 41
4.6 Inter-regional high correlation value of the fMRI standalone scanning in resting state, 03/03/2016, Rat L1R0 . . . 42
4.7 The regions that showed high correlation bilaterally, the fMRI standalone scanning in resting state, 03/03/2016, Rat L1R1 . . . 42
4.8 Inter-regional high correlation value of the fMRI standalone scanning in resting state, 03/03/2016, Rat L1R1 . . . 43
4.9 The regions that showed high correlation bilaterally, the simultaneous EEG-fMRI mea-surement in resting state, 04/03/2016, Rat L1R0 . . . 43
4.10 Inter-regional high correlation value of the simultaneous EEG-fMRI measurement in resting state, 04/03/2016, Rat L1R0 . . . 44
4.11 The regions that showed high correlation bilaterally, the simultaneous EEG-fMRI mea-surement in resting state, 04/03/2016, Rat L1R1 . . . 44
4.12 Inter-regional high correlation value of the simultaneous EEG-fMRI measurement in resting state, 04/03/2016, Rat L1R1 . . . 45
4.13 The regions that showed high correlation bilaterally, fMRI standalone scanning in resting state, 21/03/2016, Rat 3 . . . 45
4.14 Inter-regional high correlation value of fMRI standalone scanning in resting state, 21/03/2016, Rat 3 . . . 46
4.15 The regions that showed high correlation bilaterally, simultaneous EEG-fMRI measure-ment when seizure induced, 21/03/2016, Rat 3 . . . 46
4.16 Inter-regional high correlation value of simultaneous EEG-fMRI measurement when seizure induced, 21/03/2016, Rat 3 . . . 47
4.17 The regions that showed high correlation bilaterally, simultaneous EEG-fMRI measure-ment when seizure induced, 22/03/2016, Rat 3 . . . 47
List of Abbreviations
CNS = Central Nervous System PNS = Peripheral Nervous System
fMRI = functional Magnetic Resonance Imaging EEG = electroencephalogram
ECG = electrocardiogram ECoG = electrocorticogram
iEEG = intracranial electroencephalogram SNR = Signal to Noise Ratio
A/D = Analog/Digital
MRI = Magnetic Resonance Imaging RF = radiofrequency
BOLD = Blood Oxygen Level Dependent MR = Magnetic Resonance
ILAE = International League Against Epilepsy IBE = International Bureau for Epilepsy AED = Anti-Epileptic Drug
TMS = Transcranial Magnetic Stimulation VNS = Vagus Nerve Stimulation
DBS = Deep Brain Stimulation TLE = Temporal Lobe Epilepsy KA = Kainic Acid
PILO = pilocarpine SE = Status Epilepticus ROI = Region Of Interest GLM = General Linear Model
ICA = Independent Component Analysis MAPSHIM = Multi Angle Projection SHIM GE-EPI = Gradient Echo – Echo Planar Imaging FOV = Field Of View
TR = Time to Repeat TE = Time to Echo
FWHM = Full Width Half Maximum RS = Resting State
FFT = Fast Fourier Transformation SPM = Statistical Parametric Mapping HRF = Hemodynamic Response Function FWE = Family Wise Error
Chapter 1
Introduction
Background
Epilepsy is one of the major chronic neurological diseases and it affects approximately 65 million people worldwide [10]. Anti-epileptic drugs (AEDs) are prescribed to the patients as a treatment. How-ever, it is known that 20-30 percent of the patients cannot achieve seizure freedom with AEDs and they are referred to as refractory epileptic patients [11]. Often, these patients go through resective surgery to remove the onset region of the seizures. Nevertheless, not all refractory epileptic patients are good candidates for the surgery. Patients who have an unclear seizure onset region or multiple seizure onset regions may not achieve seizure freedom after surgery and may have post-operative functional deficits in language and memory [12]. Therefore, the pre-surgical evaluation of epilepsy patients is crucial to delineate epileptogenic zone and to predict possible surgical outcome.
For precise localization and delineation of the epileptogenic zone, scalp EEG-fMRI has been a widely used approach in clinics. Electroencephalogram (EEG) measures the electrophysiological signals from the brain with high temporal resolution and functional Magnetic Resonance Imaging (fMRI) measures BOLD (Blood Oxygen Level Dependent) signals that tell us the hemodynamic response in the brain with high spatial resolution. Therefore, scalp EEG-fMRI has been used as a complementary, non-invasive, pre-surgical evaluation tool in clinical epilepsy studies [13]. On the other hand, preclinical rat EEG-fMRI epilepsy studies are usually done with implanted electrodes [14, 15]. However, the invasiveness of the method is a major drawback and to our knowledge, there has been no scalp EEG-fMRI epilepsy studies on rats. Therefore, we introduce a Magnetic Resonance (MR) compatible scalp EEG cap for rats that was designed in our lab last year [9] not only in standalone EEG recording but also in simultaneous EEG-fMRI measurements to provide a non-invasive experimental platform that is compatible with clinical EEG-fMRI epilepsy studies.
Aim of the thesis
The aim of the thesis is to test whether the scalp EEG could correctly record seizures and moreover facilitate EEG-fMRI studies to study functional connectivity in resting state and also in evoked seizures. Through this, we evaluate the potential usefulness of the MR compatible scalp EEG cap for rats in bridging the gap between preclinical epilepsy studies and clinical epilepsy studies. For this purpose, we analyzed EEG recordings and utilized three different data analysis methods for fMRI data which are 10 x 10 Region Of Interest (ROI) correlation analysis, General Linear Model (GLM) analysis and Independent Component Analysis (ICA).
Overview of the thesis
In chapter 2, we discuss the theoretical background to understand the topic of the thesis. In chapter 3, we describe all the experimental procedures in detail that we carried out ranging from the animal prepa-ration, seizure induction, EEG recording, fMRI scanning, processing of EEG data to the processing of fMRI data. In chapter 4, we show the results of the data analysis. Afterwards in chapter 5, we interpret the results and discuss implications that they might have and also limitations of the current work and possible future works. Lastly in chapter 6, we draw a conclusion whether the MR compatible scalp EEG cap for rat would be useful in bridging the gap between rat and human EEG-fMRI epilepsy studies.
Chapter 2
Literature Review
2.1
The brain
In our body, there are two types of nervous system. One is the Central Nervous System (CNS) which consists of brain and spinal cord. The other is Peripheral Nervous System (PNS) which consists of cranial nerves and spinal nerves that connect CNS to the other body parts. The brain is the central organ in the CNS which controls a variety of bodily functions which will be discussed later. There has been a lot of research on the question how the brain regions are connected for its complex functions. The brain has been observed as a complex network-like organ and it is known that different regions of the brain communicate with each other even though they are distant away from each other. This is due to the functional connectivity which represents the similarities in patterns of activity in the regions of brain. The functional connectivity between different brain regions has been of one of the greatest interest in neuroscience along with advances in neuro imaging modalities such as functional Magnetic Resonance Imaging (fMRI) [16]. In this section, we will first discuss the neuron which is the basis form of the brain, the anatomy of the brain and the functional connectivity of the brain.
2.1.1 The neurons
The components of the neurons
Neurons are cells which are the core element of the brain. Neurons respond to electrochemical changes in the adjacent area. They are able to deliver the information to other neurons. This is possible due to their three components which are axon, dendrites and cell body. The cell body contains nucleus and cytoplasm. The dendrites acquire the input and then the axons send away the bioelectrical signals. The neurons may have several dendrites but they have only one axon. These three components of the neuron can be seen in figure 2.1. The ends of axons create the contact point with dendrites of other neurons and this is called synapse. The neurons communicate by sending and receiving electrochemical information at synapses. This information is carried by biological molecules called neurotransmitters [1].
Figure 2.1:The neuron [1]
The classification of the neurons
The neurons can be classified by two different ways. One is by structural differences and the other is by functional differences.
The classification of the neurons by structural differences
The neurons can be classified into three groups by structural differences. First, thebipolar neurons
are the neurons that have two processes branching from the cell body. One is axon and the other is dendrite. This type of neurons is found in eyes, nose and ears. The second type isunipolar neurons. Unipolar neurons have a single process from its cell body. This process is divided into two branches. One branch includes the dendrites and the other branch is the axon which enters the brain or the spinal cord. The cell bodies of the unipolar neurons accumulate outside of the CNS and this is called ganglia. The last type ismultipolar neurons. The multipolar neurons have multiple processes extending from the cell body. Among these processes, only one process is axon and the others are dendrites. Most of the neurons whose cell bodies are located within the CNS are multipolar neurons. The three different structural types of neurons can be seen in figure 2.2 [1].
The classification of the neurons by functional differences
The neurons can also be classified into three groups that are determined by whether they transfer information into the CNS, within the CNS or out of the CNS. The first type issensory neuronswhich are also called as afferent neurons. They carry information from peripheral body parts into the CNS. Most sensory neurons are unipolar but some are bipolar structurally. The second type isinterneurons
which are also called as association neurons. They are located within the CNS and they transport in-formation from one part of the brain or the spinal cord to another part. Structural characteristic of the interneurons is multipolar. The last type ismotor neuronswhich are also called efferent neurons. They carry information from the CNS to the effectors such as muscle or gland. Also they are multipolar [1].
Figure 2.2:The structural types of neurons [1]
Trigger zone is a sensitive region of the axon where the nerve impulse is originated.
2.1.2 The anatomy of the brain
The major components of the brain are the cerebrum, the cerebellum and the brain stem. The whole structure of the brain can be found in figure 2.3. The cerebrumis the largest component of the brain. It is divided into left and right hemispheres. There is a structure of nerve fibers called corpus callosum that connects these two hemispheres. The cerebral hemispheres are divided into lobes. The name of the lobes is taken from the name of the skull bones that are overlying the lobes. There are frontal lobe, parietal lobe, temporal lobe and occipital lobe. The lobes of the cerebral hemispheres can be seen in figure 2.4. The outermost part of the cerebrum consists of thin layer of gray matter called cerebral cortex. Approximately 75% of all neuron cell bodies in the nervous system are in the cerebral cortex. There is a bulk of white matter that constitutes major part of the cerebrum under the cerebral cortex. This is made of stacks of nerve fibers which unite neuron cell bodies in the cerebral cortex with other parts of the nervous system. This white matter connects different parts of the cerebrum to each other [1].
The lobes of the cerebrum have different functions. First, the frontal lobes are responsible for con-trolling movements of voluntary skeletal muscles and higher intellectual processes. Second, the parietal lobes are responsible for sensation of touch, pressure, pain and temperature and verbal abilities. Third, the temporal lobes are in charge of hearing, remembering and interpreting sensory experiences. Lastly, the occipital lobes are responsible for vision and associating visual images with other sensory experi-ences.
Figure 2.3:The whole structure of the brain [1]
Figure 2.4:The lobes of the brain [2]
The second major component of the brain is the brain stem. The brain stem links the brain and the spinal cord. It is composed of the midbrain, pons and medulla oblongata. It contains several bundles of nerve fibers and loads of gray matter which are called nuclei. The last major component of the brain is the cerebellum. The functions of the brain stem include transporting impulses between the brain and spinal cord and reflexes. The cerebellum is located under the occipital lobe of the cerebrum and behind the pons and medulla oblongata of the brain stem. The major part of the cerebellum is white matter with a thin layer of gray matter which is called cerebellar cortex. The functions of the cerebellum are controlling muscle activities and posture and communicating with other parts of the CNS by nerve tracts [1].
2.1.3 Brain connectivity
The brain is believed to be a network-like organ which means that regions of the brain are connected to other regions of the brain. There are three types of connectivity of the brain that are widely discussed in neuroscience which are structural connectivity, functional connectivity and effective connectivity.The structural connectivity refers to the anatomical connections of brain regions by white matter. On the other hand, functional connectivity and effective connectivity are statistical concepts and these concepts can be used to find out brain regions that are connected even though they may not be structurally con-nected. The functional connectivity looks at the similarities in patterns of activity of different brain regions. While functional connectivity is not able to show directional relationship of the connectivity,
the effective connectivitycan reveal directional effect of one brain region over another [17].
2.2
Electroencephalogram (EEG) and functional Magnetic Resonance
Imag-ing (fMRI)
2.2.1 Electroencephalogram (EEG)
Different types of EEG
Electroencephalogram (EEG) is a commonly used method in brain research that measures electro-physiological signals from brain. There are different types of EEG based on invasiveness such as scalp EEG, electrocorticogram (ECoG) and intracranial EEG (iEEG). The brief description of these three types of EEG is shown in figure 2.5. Scalp EEG is completely non-invasive and it is placed on the scalp of the subject so that it does not require surgical process which is an advantage. But since the EEG signal has to pass through the skull which has low conductivity, the signal to noise ratio (SNR) is very poor. Next, ECoG is partially invasive and it is placed on the surface of the brain which necessitates the surgery. However, it provides better SNR than scalp EEG since the signal is not captured after passing through the skull. Lastly, the intracranial EEG (iEEG) is invasive since it is implanted into the gray matter of the cerebral cortex. The advantage of iEEG is that the EEG signal is directly measured from the cerebral cortex which leads to higher SNR. Nevertheless, the surgical process to implant the electrodes is neces-sary and there is a risk that it could lead to some damage in brain functions. Therefore, in human studies, scalp EEG is preferred over the two EEG methods.
The source of the EEG signal
There is an abundant amount of specialized neurons called, apical pyramidal neurons, in the cerebral cortex. They are positioned parallel to each other and perpendicular to the surface of the brain. This can be seen in figure 2.6. As we discussed previously, neurons communicate with each other by means of neurotransmitter at synapses. This neurotransmitter crosses the synaptic cleft that binds to the post-synaptic membrane which is the membrane of the neuron located after the synapses. This induces the ion channel to open up the membrane and positively charged ions flow into the cells. As a result, the extra-cellular space around the neurons becomes relatively negatively-charged. In a remote part of the neuron, the ions leave the cells which makes the outside of the neurons positively charged. The combination of these processes creates electrical dipoles between different parts of the neuron. However, a single neuron is very small. Also, there is the thick skull as well as other layer of soft tissues. Therefore, the dipole of a single neuron is not detectable individually. Fortunately, there are so many pyramidal cells in the cerebral cortex, all lined up parallel to each other. Moreover, many of these cells often get stimulated at the same time. This way, the individually small dipoles summate to the dipole that is detectable on the scalp [18].
Figure 2.5: The different types of EEG depending on the invasiveness [3]
The scalp EEG (The highest bullet), the ECoG (The middle bullet) and the iEEG (The lowest bullet)
Figure 2.6:The pyramidal neurons that majorly contribute to the EEG signal [4]
The EEG recording system
The EEG recording system consists of electrodes with conductive gel, amplifiers with filters, A/D converter and a recording device (e.g. laptop). In human EEG system, if it is a routine checkup, only 6 to 8 electrodes are used. But when a more accurate test is required, 32 or 64 electrodes are used. In the case of high density EEG system, the number of electrodes even reaches 128 or 256. The human EEG system follows the standard 10-20 electrode system which was adopted by the International Federation in Electroencephalography and Clinical Neurophysiology in 1958 [19]. The system is named as 10-20 system because of the proportional distance of electrodes in percentage between Nasion and Inion. Elec-trodes are marked as F (Frontal), C (Central), T (Temporal), P (Parietal), O (Occipital). The elecElec-trodes are named this way because of the brain region that is underlying. However, note that C (Central) is only for geometrical identification but there is no central lobe in the brain. Odd numbers are assigned to the electrodes which are on the left side and even numbers are assigned to the ones on the right side. This standard 10-20 electrode system can be seen in figure 2.7.
Figure 2.7:The international 10-20 EEG system seen (A) from the left side and (B) from above the head [5]
2.2.2 functional Magnetic Resonance Imaging (fMRI)
fMRI has been widely used to study brain functions. In this section, we will discuss the principle of the Magnetic Resonance Imaging (MRI) and also the physiological background which is measured by fMRI technique.
Principle of Magnetic Resonance Imaging (MRI)
MRI utilizes the inherent magnetic properties in the body to create medical images. The hydrogen nucleus which is a single proton is what is used for imaging because of its wealth in water and fat. MRI scanner consists of magnets with a field strength specified by the unit Tesla, gradient coils which produces a change in field strength from one point to another in the patient’s body during the imaging process and radiofrequency (RF) coils which transmits radio wave to the tissue and receives radio wave from the tissue. When the human body is within the magnetic field, the hydrogenous protons are aligned with that magnetic field. But when the RF coil sends the radiofrequency pulse, the alignment of the protons is altered. Afterwards, when the RF pulse is switched off, the protons realign to its original state and this leads to emission of a signal which is also a radio wave. The time that it takes for protons to be realigned and the intensity of the signal that is emitted is dependent on the environment and the types of tissues. With the information, the MRI images are produced [20, 21].
Figure 2.8: The structure of the MRI scanner [6]
Physiological background of the fMRI signal
The conventional MRI technique provides high spatial resolution anatomical images which is 1 mm or better. In the conventional MRI imaging, the difference primarily in the density of water inside tissues and in the way how the water interact with macromolecules such as phospholipids, proteins and fat that is present in tissues produces the contrast in images. However, in the functional MRI imaging (fMRI), it uses the same equipment as the conventional MRI imaging but the contrast within images is generated because of Blood Oxygen Level Dependent (BOLD) changes in the MRI signal. The fMRI images can be obtained while the patient is performing some tasks such as finger tapping, viewing pictures and listening to speech. But they can also be obtained in resting state when the patient is lying on the scanner bed with both eyes closed and not thinking something in particular. fMRI has been widely used to study brain functions because it is non-invasive and safe [22].
fMRI is based on BOLD contrast as mentioned above. There is increased need in oxygen when the neurons are more activated. Therefore, the different ratio of oxyhemoglobin and deoxyhemoglobin in the brain region produces contributes to contrast in BOLD signal [23]. The reason why blood oxygenation level makes BOLD contrast is because of their magnetic properties. Oxygenated hemoglobin is diamag-netic which means that it only reacts with the magdiamag-netic field weakly and deoxygenated hemoglobin is paramagnetic which means that it reacts with the magnetic field strongly [24]. The part of the hemoglobin that determines its magnetic properties resides in the ferrous iron ion [25]. The ferrous iron ion is in para-magnetic high-spin state in deoxygenated hemoglobin because the 4 out of 5 electrons in outer shell are not paired. On the other hand, the ferrous iron ion is in diamagnetic low-spin state because the electrons in outer shell are paired with oxygen [26].
In the activated neurons, metabolic demand (oxygen consumption) is increased so that oxygen is taken out from the blood and the amount of deoxygenated hemoglobin in that neuronal area is increased. This causes distortion in the magnetic field because of the paramagnetic characteristic of deoxygenated hemoglobin. That is shown as decreased BOLD signal that you can see in figure 2.9 as ‘initial dip’ [7]. Afterwards, blood vessels are dilated and the ratio of oxygenated hemoblogin and deoxygenated hemoglobin increases [27]. As a consequence, the BOLD signal increases in that local area [28]. The peak of the BOLD signal is reached in 5-8 s after activation of neurons [29].
Figure 2.9:BOLD signal shows initial dip and then a more prolonged positive signal [7] 2.2.3 Simultaneous EEG-fMRI
Simultaneous EEG-fMRI has been getting a lot of attention in clinical neuroscience studies as well as in preclinical neuroscience studies. fMRI has high spatial resolution which is millimeter scale but low temporal resolution which is few seconds scale. EEG has low spatial resolution which is centimeter scale but with high temporal resolution of millisecond scale. Due to these characteristics, EEG and fMRI complement each other when used simultaneously.
With high temporal resolution of EEG, it is easy to derive the starting point of pathological brain activities. However, the inverse problem which tries to find the source area of the signal in brain is not straightforward if EEG is used alone. Also only with fMRI, one cannot easily derive when the neuronal activation was started because of the few seconds of delay before BOLD signal reaches its peak. The simultaneous measurement of EEG and fMRI allow us to examine how the epileptic seizure initiates and propagates to other areas [30, 31, 32]. However, there are still some artifacts that are caused to when they are used simultaneously.
We will first discuss the artifacts that are generated on EEG recording due to the fMRI scanning. One example of the artifacts is ballistocardiogram. This is caused by the movement of the body and electrodes because of the cardiac pulse. This artifact is shown at around 10 Hz or below [33, 34]. The ballistocardiogram artifact increases when the magnetic field strength is increased. However, this artifact can be reduced significantly by fixing the EEG electrodes firmly. Another example is the gradient artifacts. This artifact is caused by the gradient switching. They are shown with high amplitudes in the millivolt scale and they are present in the normal EEG frequency range which makes removing the artifacts complicated.
of EEG system should be MR compatible to be used simultaneously with fMRI. However, there is still some interference of magnetic field by the MR compatible electrodes during MR image acquisition and this deteriorates signal to some extent in the brain regions that are close to the EEG electrodes [35].
2.3
Epilepsy
2.3.1 Definition of Epilepsy
The practical (operational) definition of epilepsy aids clinicians for easier communication and di-agnosis of epilepsy. This definition was mainly excerpted from the official document of International League Against Epilepsy (ILAE) [36].
“Epilepsy is a disease of the brain defined by any of the following conditions: 1. At least two unprovoked (or reflex) seizures occurring more than 24 h apart 2. One unprovoked (or reflex) seizure and a probability of further seizures similar to the general recurrence risk (at least 60%) after two unprovoked seizures, occurring over the next 10 years 3. Diagnosis of an epilepsy syndrome”
2.3.2 Definition of epileptic seizure
Epileptic seizures are defined below by International League Against Epilepsy (ILAE) and the Inter-national Bureau for Epilepsy (IBE) [37].
“An epileptic seizure is a transient occurrence of signs and/or symptoms due to abnormal excessive or synchronous neuronal activity in the brain.”
Mode of onset and termination
The beginning and the end of the seizures are clear for the period of seizures. However, it does not always meet this standard. There is also an exceptional condition called status epilepticus where the seizures are continued for more than 5 minutes. These can be easily monitored by EEG recording [37].
Clinical manifestations
Clinical manifestations of seizures can be depicted in a variety of ways. They are relied on sev-eral factors such as the position of onset in the brain, patterns of propagation, maturity of the brain, sleep–wake cycle, medical prescriptions, and several other factors. There is a wide range of bodily func-tions that are affected by seizures such as sensory, motor, and consciousness, emotional state, memory, cognition or behavior [37].
2.3.3 The classification of epilepsy
The classification of epilepsy is highly ambiguous and it is still evolving and being refined con-stantly. However, for the better clinical assessment and diagnosis, it is worthwhile to have such standard.
Generalized epilepsyrefers to epilepsy with generalized seizures that shows generalized epileptiform EEG patterns. However, they can also involve focal epileptiform EEG patterns too. The focal epilepsy
refers to epilepsy with focal seizures that are associated with focal EEG epileptiform patterns. The focal seizures can be unifocal or multifocal. It is important to note here that the clear distinction between generalized and focal epilepsy does not exist. Many patients do not belong to just one group [38].
2.3.4 Treatments
Anti-epileptic drugs (AEDs)
Generally, longterm treatment with AEDs is needed for patients with epilepsy and very often, com-bination of different types of medication is prescribed to those with drug resistant epilepsy [39]. Ap-proximately 25 to 30 % of the epilepsy patients are reported to be drug resistant [39]. It can also be described as pharmacoresistant, medically intractable or refractory. However, the definition of drug re-sistant epilepsy is perceived intuitively. Therefore, there has been no agreement on definition before the International League Against Epilepsy (ILAE) issued a suggestion. The definition is valuable for medi-cal practitioners, clinimedi-cal researchers, neurologists, and other people working in this field. ILAE defines drug resistant epilepsy as below [40].
“Failure of adequate trials of two tolerated and appropriately chosen and used AED schedules (whether as monotherapies or in combination) to achieve sustained seizure freedom”
Surgery
Refractory epilepsy patients often undergo resective surgery. The surgery is to remove the seizure onset zone in which seizures are initiated. 60 to 80 percent of patients with temporal epilepsy have been reported to become seizure-free after undergoing the surgery in which the seizure onset zone in the tem-poral lobe is resected [41, 42, 43]. The safest cases of the surgery are temtem-poral lobe resections. The serious complication rate is no more than 5 percent. The possible complications are cognitive impair-ment, psychosis, visual field impairment and decrease in verbal abilities [43, 44].
There are different factors that affect surgical outcome. Multiple epileptogenic zones are one of the major factors. The poor surgical outcome of the patients with multifocal seizures could be attributed to these multiple epileptogenic zones. The seizures of these patients have multiple seizure onset zones or they have broader onset zones compared to other patients. Another case that brings poor surgical outcome is when patients have bilateral brain abnormalities [45]. In these cases, surgery in one specific region would not result in seizure freedom. Accordingly, it is of utmost importance to do pre-operative measurements to test the likelihood of successful surgical outcome and to delineate the zone for resection.
Neurostimulation
Neurostimulation is another type of treatment for epilepsy patients who are drug-resistant and are not good candidates for the surgery. We will discuss three different neurostimulation methods which are transcranial magnetic stimulation (TMS), vagus nerve stimulation (VNS) and deep brain stimulation (DBS). First, TMS is the simplest and non-invasive approach. It uses a coil that produces small electric currents within the brain just beneath the coil through electromagnetic induction. This way the targeted regions of brain become stimulated. However, the most common epileptogenic areas are located too deep below the scalp to have successful result with TMS [46]. Second, the direct VNS requires surgical implantation of the stimulator device. The generator of the device is implanted and it sends electric im-pulses directly to the vagus nerve at certain frequencies [47]. Nevertheless, the effectiveness of the VNS in terms of reducing the frequency and intensity of the seizures is quite different between individuals [46]. Lastly, DBS is the invasive method which requires implantation of the neurostimulator to send electrical impulses via the electrodes to the specific regions in the brain. The DBS is not only used in epilepsy but also on Parkinson’s disease, Tourette syndrome and depression for the patients who do not respond to the conventional treatments [48].
Ketogenic diet
The ketogenic diet is a diet which contains high amount of fat and low amount of carbohydrates and proteins. By restricting the consumption of carbohydrates and proteins, the body is forced to use ketone bodies as the main fuel. The ratio of the fat and carbohydrate in the ketogenic diet is 4 to 1. Also the amount of protein is restricted in the diet which leads to the proportion of the amount of fat in the diet as high as 90 %. This treatment option is usually used for children who are drug-resistant [49].
2.4
Animal models of temporal lobe epilepsy (TLE)
There are animal models of epilepsy available. We will discuss temporal lobe epilepsy (TLE) models in this section since it is the most common type of epilepsy in adults. What are the standards of good animal models of epilepsy? First of all, the animal models need to generate corresponding electrophys-iological signals as they appear in epileptic human patients. Second, the causes of epilepsies should be similar. Therefore, the animal models of epilepsy should comprise a wide range of human conditions that resulted from injury, genetic inclination, etc. Third, the animal models should also manifest pathological changes such as hippocampal sclerosis. Lastly, the behavioral manifestations in the short and long term should also be similar [50].
Although there is no animal model that possesses all the characteristics of TLE, the Kainic Acid (KA) that was discovered by Ben-Ari et al. [51, 52] and Pilocarpine (PILO) are the two most common animal temporal lobe epilepsy models that have been used for research. On top of that, an electric kindling model is also available. We will take a look at each of these models. But more focus will be given on the KA model which we used in this thesis.
2.4.1 Kainic Acid model (KA)
Kainic Acid (KA) is a neuro-excitatory amino acid that is obtained from a red algae (Digenea sim-plex) in the beginning of 1950s [8, 53]. There are two different ways of administration of KA which are intracerebral administration and systemic administration. We will discuss each of these ways of administration.
Intracerebral administration of KA
Nadler et al. [54] reported a study presenting the effect of KA on hippocampal neurons. It was proven that pyramidal cells in the hippocampus were degenerated after intraventricular injection of KA at 0.5 nmol in Sprague-Dawley rats. These studies indicated that intracerebral injections of KA, either in hippocampus or in amygdala, could serve as a model of TLE considering that it had resulted in common histopathological characteristic of epileptic patients [52, 55].
0.4-2 µgof KA by intra-hippocampal administration is commonly efficient enough to provoke con-vulsive seizures in rats [56, 57, 58, 59, 60]. Behavioral manifestations of these seizures are as following; Facial clonus (stage 1), masticatory movements and head nodding (stage 2), wet dog shakes (stage 3), forelimb clonus (stage 4), and rearing and falling (stage 5) are also other subsequent behavioral manifes-tations [61, 62, 63, 64, 8]. Similar symptoms can be achieved by intra-amygdaloidal injections of KA at 0.4-2 µgin rats. Yet some additional symptoms such as salivation and exophthalmos are present as well [52, 65].
Electrophysiological changes are seen in the KA administered hippocampus prior to the onset of seizures [66, 67, 68]. It was suggested that even when the administration of KA was executed in different areas of brain that are far away from hippocampus, hippocampal formation is vital in the onset and propagation of KA-induced epileptiform activities [69, 8]. However, intra-amygdaloidal injections of
KA do not always result in histopathological alterations in the hippocampus [70, 8]. The epileptiform patterns recorded on EEG after intrahippocampal injection of KA can be seen in figure 2.10.
Figure 2.10:Epileptiform patterns represented on EEG after intrahippocampal injection of KA (adapted from [8])
The onset of the seizure is shown by arrow.
Systemic administration of KA
When KA is administered systemically, surgical procedures are not necessary so it shortens the time required for experiments. In addition to them, animals’ health does not have to be affected by possible complications that could happen after surgical procedures. But there are also disadvantages that probably several systemic injections may be needed to achieve Status Epilepticus (SE) [8]. Generally, also the clinical manifestations can be spotted in KA treated rats by systemic administration [71].
After 30 min of systemic injection of KA (intraperitoneally, intravenously, subcutaneously), epileptic electrophysiological signals become visible on EEG recordings. It was reported that epileptiform patterns were first observed in the hippocampus in rats who were administered KA systemically [72]. It was found that hippocampus plays a major role in initiating seizure activities which were provoked by KA [73]. Accordingly, these studies indicate that hippocampus holds a principal function in initiation of seizures when KA is administered systemically as well [74, 69].
2.4.2 Pilocarpine model (PILO)
Almost similar epileptic characteristics can be achieved with the pilocarpine model (PILO). However, compared to the KA model, more substantial damages are caused onto the thalamus, dentate hilus, cere-bral cortex, olfactory corticles, substantia nigra and the amygdalas [75]. Because of this, the KA model was preferred over the PILO model [76]. An advantage of the PILO model is that it is more reliable than the KA model. It was reported that almost all rats administered with pilocarpine at the amount of 380 mg/kg intraperitoneally began to have acute seizures [77, 78]. PILO model occupies similar behavioral manifestations as in the KA model such as myoclonic twitching, head wobbling and facial automatism (e.g. chewing and eye blinking) [50].
2.4.3 Electric kindling model
In this model, electrical stimulation is iterated for some days and this induces neurons to be chron-ically excited [79]. It eventually generates severe partial and generalized convulsive seizures [80, 79]. Kindling is superior over other models in the aspect that experimenters can target a certain region of the brain as the seizure onset region and the parameters of stimulation protocols are readily modifiable [81]. On the other hand, the disadvantage of this model is that it does not create similar lesions as in the temporal lobe epileptic patients [82]. Also, since it involves a surgical procedure, it takes more time to experiment and there could be post-surgical damages in the animals.
Chapter 3
Materials and methods
3.1
Overview of the experiments
The overview of all the experiments and rats that were used is shown in table 3.1. In total, 6 rats were used in this thesis work but the rats that died during the experiments were excluded from data analysis. Therefore only the data from 4 rats which are rat 2, rat L1R0, rat L1R1 and rat 3 was analyzed.
Date What experiment was performed Rats that were used
23/11/2015 EEG standalone recording in resting state Rat1, Rat2 26/11/2015 fMRI standalone scanning in resting state Rat1, Rat2 27/11/2015 Simultaneous EEG-fMRI measurement in
resting state
Rat2 (Rat1 died during the fMRI scanning on 26/11/2015)
02/03/2016 EEG standalone recording in resting state Rat L1R0, Rat L0R1, Rat L1R1 (Rats were identified by getting their earlobe(s) punched. e.g. Rat L1R0 has only its left earlobe punched)
03/03/2016 fMRI standalone scanning in resting state Rat L1R0, Rat L0R1, Rat L1R1 04/03/2016 Simultaneous EEG-fMRI measurement in
resting state
Rat L1R0, Rat L1R1 (Rat L0R1 died during the fMRI scanning on 03/03/2016)
21/03/2016 fMRI standalone scanning in resting state, Simultaneous EEG-fMRI measurement when seizure induced
Rat3 (Note that this was the only rat used for this session but it was numbered as 3 to be distinguished from the rats of 23/11/2015 dataset)
22/03/2016 Simultaneous EEG-fMRI measurement when seizure induced
Rat3
Table 3.1:The overview of the experiments that were performed
All rats were treated according to guidelines approved by the European Ethics Committee (decree 2010/63/EU). All experimental procedures were approved by the Animal Experimental Ethical Commit-tee of Ghent University Hospital (ECD 13/14). The animals were kept under environmentally controlled conditions (12h normal light/dark cycles, 20–23°C and 40–60 % relative humidity) with food and water ad libitum.
3.2
Animal preparation and handling
3.2.1 Preparation to EEG recording
Before the recording, anesthesia with a mixture of medicalO2and Isoflurane with a concentration of
5 % was performed on rats in a plastic box. When the rats were fully under anesthesia, they were moved onto the table to prepare for EEG recording. During this, the anesthesia was continued using an air mask. Isoflurane anesthesia was continued with a rate between 1 % and 2 % depending on the breathing rate (between 900 and 1200 ms is the normal range) or the status of the rats. The electrocardiogram (ECG) electrode (Rapid Biomedical, Germany) was placed underneath the chest region of the rats to monitor breathing rate. A heating pad with water of 40°C circulating inside was kept underneath the rats or above the back region of the rats to sustain their normal body temperature. For EEG standalone recording on 23/11/2015, an infrared heating lamp (Philips, Eindhoven, Netherlands) was used instead of the heating pad. The head region of the rats was carefully shaved to decrease impedance between the scalp and electrodes. For the EEG recording on 02/03/2016 and 21/03/2016, depilatory cream (Veet, Reckitt Benckiser, U.S.A.) was also used to lower the impedance further. Afterwards, the region was degreased with 70 % alcohol. Vidisic gel (Bausch and lomb, U.S.A.) was also applied on both eyes of rats to keep them moisturized.
3.2.2 Preparation to MRI acquisition
Anesthesia with a mixture of medicalO2 and isoflurane with a concentration of 5 % was performed
on rats in a plastic box. The ECG electrode (Rapid Biomedical, Germany) was positioned underneath the chest region of the rats to keep track of breathing rate. A water-circulating heating pad was placed under the rats to maintain their normal body temperature. The anesthesia by isoflurane was sustained at the rate between 1 % and 2 % through air tubes which are located directly at the head region of rats.
When the rat was fully under anesthesia, it was moved to the bed of 7 T MRI system (Pharmascan 70/16, Bruker, Ettlingen, Germany). During this, the anesthesia was continued using an air mask. Af-terwards, sedation by medetomidine was performed. It is known that medetomidine does not suppress brain activities that much unlike isoflurane [83]. The timeline of this sedation protocol [83] can be found in figure 3.1. When the scanning was completed, the rat was injected with atipamezole (0.03 mg/kg) to counter the effect of the medetomidine sedation.
3.3
Seizure induction by KA (Kanic Acid)
Seizures were induced by injecting KA intraperitoneally using a syringe for EEG-fMRI simultaneous measurements on 21/03/2016 and on 22/03/2016. The KA was injected at 5 mg/kg according to the protocol of Hellier et al. [84] just before we put on the EEG cap on the rat.
Figure 3.1: Timeline of the medetomidine sedation during MR acquisition S.c. stands for subcutaneous.
3.4
EEG recording
The EEG cap (length: 36 mm and width: 28 mm) designed by Joachim Ally et al. [9] was connected to an adapter head box which was connected by a flat cable to the MR compatible human EEG system (Brainproducts, Germany) which consisted of a power supply, an amplifier and an USB adapter which was connected to a laptop. The whole system of the EEG recording is described in figure 3.2. The setup of the EEG standalone recording when applied on a rat can be seen in figure 3.3. The spatial distribution of the electrodes of EEG cap on the rat brain can be found in figure 3.4. We found that the spatial distribution suggested by Joachim Ally et al. [9] should be modified since the region of the brain in rats already starts from the nose region. Therefore, considering the approximate location of the hippocampus which is indicated by the red arrow in figure 3.4, 13, 14, 16 and 17 were electrodes of our interest when we analyzed EEG signals since hippocampus is known to be the onset region of the seizures which are induced by KA. In the case of simultaneous EEG-fMRI measurement, the EEG cap, adapter head box, amplifier and power supply were placed in the magnetic shielding room where MRI acquisition was performed. A long optical cable connected the amplifier with the USB adapter and the laptop outside the shielding room.
Next, electrolyte gel which contains 8% of salt (Abralyte 2000, Easycap) was applied using a blunt needle on each electrode of the EEG cap. Then the cap was placed onto the scalp of the rat and then fixed with tape. The fixation way of the EEG cap can be seen in figure 3.5. First, the impedance between the scalp and electrodes was checked. Then the EEG was recorded with sampling frequency of 5000 Hz using the EEG recording software (Brainvision Recorder, Brainproducts, Germany).
Figure 3.2:The scalp EEG system for rats [9]
Figure 3.4:Spatial distribution of the electrodes of the EEC cap The rat brain image was obtained from [85].
Figure 3.5:Fixation way of the cap on the rats [9] The end of the EEG cap was placed over the region of ears.
3.5
MRI acquisition
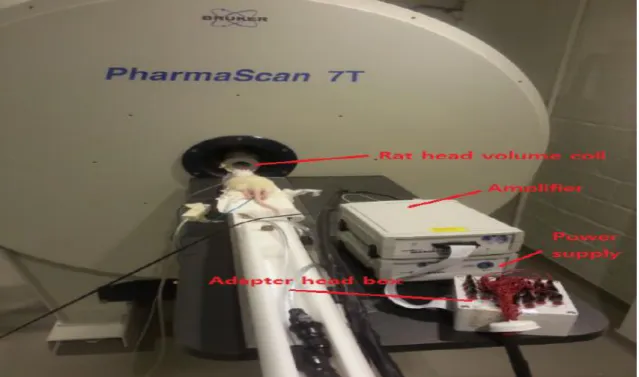
The rat was positioned on the bed corresponding to the plane of the rat for imaging. A biting bar (Bruker, Germany) was also used to make it easier to adjust the position of the rat when there was a slight tilt. Before starting MR acquisition, the EEG cap was placed onto the scalp of the rat in the case of simultaneous EEG-fMRI measurements. The demonstration of the EEG-fMRI setup is shown in figure 3.6. Afterwards, a rat head volume coil (Bruker, Germany) was placed around the head of the rat to be
able to image the brain, especially subcortical regions such as the hippocampus. The rat head volume coil can be seen in figure 3.7. Then the acquisition was prepared with the MRI acquisition software Paravision (Bruker, Germany). Before starting the MR acquisition, the first and second order global shimming were performed and then a local first order shimming (MAPSHIM; Multi Angle Projection SHIM) was followed to achieve a homogeneous magnetic field. Afterwards, BOLD fMRI images were acquired making use of a gradient echo echo-planar-imaging sequence (GE-EPI).
The parameters for each fMRI EPI session; number of slices, slice thickness, matrix size, Field Of View (FOV) and voxel size are described in table 3.2. All the fMRI sessions were taken with repetition number of 300 and Time to Repeat (TR) of 2000 ms, so each scan took 10 minutes in total. As an anatomical reference, T2 weighted images were acquired using the Turbo RARE T2 sequence. The parameters for each T2 scan; number of slices, TR, Time to Echo (TE), slice thickness, matrix size, FOV and voxel size are described in table 3.3.
Figure 3.6:The demonstration of EEG-fMRI setup on a rat This was taken before EEG cap was applied on the rat.
Figure 3.7:MRI rat head volume coil used with 7T MRI scanner [9]
3.6
Processing of the EEG data
Processing of the EEG data was done using the software Brainvision Analyzer (Brain products, Germany). Each EEG recording dataset was processed separately. First, we filtered the data using the Butterworth zero phase filters (Infinite Impulse Response filters) with a low cutoff of 2 Hz, 48 dB/oct and a high cutoff of 25 Hz, 48 dB/oct. Also a notch filter at the frequency of 50 Hz was used to remove the powerline noise. For the manual seizure detection, the power spectrum of the electrodes that is shown by Fast Fourier Transformation (FFT) was investigated to find out when the seizures were evoked. Afterwards, they were checked by a neurology expert, prof. Robrecht Raedt to confirm whether they actually represented seizures.
3.7
Processing of the fMRI data
3.7.1 Preprocessing
Preprocessing of the fMRI data was done using the software DPABI (DPARSF 4.0 (for Rat Data)) [86] for each dataset. It is a pipeline fMRI analysis toolbox and it also provides a module specifically for rat data. First, all datasets went through voxel augmentation which augments voxel size to 10 times using the function ‘Voxel Size Augmentor’ on DPABI. This has been done only because most available fMRI analysis toolkits are designed for human data and the voxel size for rat MRI data is too small for using those toolkits [86]. The voxel augmentation does not change the data but only augment the voxel size. All datasets were first realigned to remove motion-related artifacts using a least squares approach and a 6 parameter (rigid body) spatial transformations. All the functional EPI images were coregistered to the anatomical T2 weighted images. Note that the functional images of all simultaneous EEG-fMRI datasets were coregistered to the anatomical T2 weighted scan of the fMRI standalone scanning dataset of the corresponding rat for a clear anatomical reference. Afterwards, smoothing was performed using the Full Width Half Maximum (FWHM) of 6 x 6 x 6 mm3. This was chosen as twice the size as the augmented voxel size of rat data which was between 2.5 mm and 3 mm [87]. No masks were applied to any of MRI images. Lastly, a band pass filter between 0.01-0.1 Hz was applied on all fMRI EPI images to reduce physiological noise mainly coming from cardiac pulses and breathing.
EPI Sessions Number of slices Slice thick-ness [mm] Matrix size [cm2] FO V [cm2] V oxel size [mm3] 26/11/2015, RS, Rat1 12 1 96 x 96 2.56 x 2.56 0.267 x 0.267 x 1 26/11/2015, RS, Rat2 12 1 96 x 96 2.56 x 2.56 0.267 x 0.267 x 1 27/11/2015, RS, w/EEG, Rat2 12 1.1 96 x 96 4 x 4 0.267 x 0.267 x 1 03/03/2016, RS, Rat L0R1 16 1 96 x 96 2.56 x 2.56 0.267 x 0.267 x 1 03/03/2016, RS, Rat L1R1 16 1 96 x 96 3 x 3 0.312 x 0.312 x 1 03/03/2016, RS, Rat L1R0 12 1 96 x 96 3 x 3 0.313 x 0.313 x 1 04/03/2016, RS, w/EEG, Rat L1R1 16 1 96 x 96 3 x 3 0.313 x 0.313 x 1 04/03/2016, RS, w/EEG, Rat L1R0 17 1 96 x 96 3 x 3 0.313 x 0.313 x 1 21/03/2016, RS, Rat3 12 1 96 x 96 2.56 x 2.56 0.267 x 0.267 x 1 21/03/2016, Seizur e, w/EEG, Rat3 12 1 96 x 96 3 x 3 0.313 x 0.313 x 1 22/03/2016, Seizur e, w/EEG, Rat3 16 1 96 x 96 3 x 3 0.313 x 0.313 x 1 T able 3.2: P arameters of each fMRI EPI dataset RS stands for Resting State. Also we used ‘Seizure’ in the first column to indicate the y are the EPI sessions which are tak en when the seizure w as induced. ‘w/EEG’ indicates that the EPI session w as performed simultaneously with EEG recording.
T2-weighted anatomical sessions Number of slices TR [ms] TE [ms] Slice thick-ness [mm] Matrix size [cm2] FO V(Field Of V iew) [cm2] V oxel size [mm3] 26/11/2015, RS, Rat1 16 2500 11 1 256 x 256 4 x 4 0.117 x 0.117 x 1 26/11/2015, RS, Rat2 16 2500 11 1 256 x 256 4 x 2.56 0.1 x 0.156 x 1 27/11/2015, RS, w/EEG, Rat2 17 2500 11 0.95 256 x 256 4 x 4 0.156 x 0.156 x 0.95 03/03/2016, RS, Rat L0R1 16 2866.1 33 1 256 x 256 2.56 x 2.56 0.1 x 0.1 x 1 03/03/2016, RS, Rat L1R1 16 2500 33 1 256 x 256 3 x 3 0.117 x 0.117 x 1 03/03/2016, RS, Rat L1R0 17 2500 11 0.938 256 x 256 3 x 3 0.117 x 0.117 x 0.938 04/03/2016, RS, w/EEG, Rat L1R1 17 2500 11 0.938 256 x 256 3 x 3 0.117 x 0.117 x 0.938 04/03/2016, RS, w/EEG, Rat L1R0 16 2500 11 1 256 x 256 3 x 3 0.117 x 0,117 x 1 21/03/2016, RS, Rat3 16 2500 33 1 256 x 256 2.56 x 2.56 0.1x 0.1 x 1 21/03/2016, Seizur e, w/EEG, Rat3 12 2500 33 1 256 x 256 3 x 3 0.117 x 0.117 x 1 22/03/2016, Seizur e, w/EEG, Rat3 16 2500 33 1 256 x 256 3 x 3 0.117 x 0.117 x 1 T able 3.3: P arameters of each anatomical T2 dataset RS stands for Resting State. Also we used ‘Seizure’ in the first column to indicate the y are the T2 sessions which are tak en when the seizure w as induced. ‘w/EEG’ indicates that the T2 session w as performed simultaneously with EEG recording.
3.7.2 Postprocessing
Region Of Interest (ROI) drawing
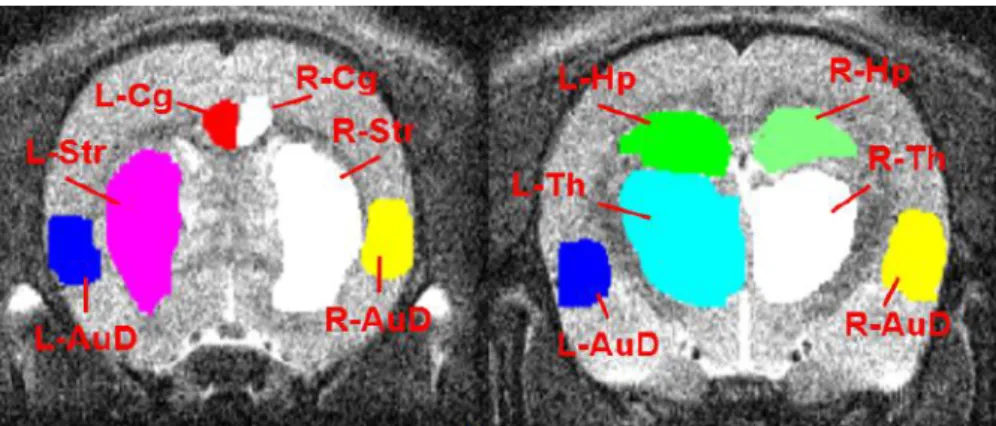
ROIs were drawn manually using the software MRIcron (NeuroDebian, McCausland Center for Brain Imaging, University of South Carolina, U.S.A.) on coregistered structural T2 images for the ROI correlation analysis. The atlas of the brain regions was referred to the Waxholm Space Sprague Dawley rat atlas [88, 89, 90]. All ROIs were drawn right side and left side to see bi-laterality. In total, 10 ROIs were drawn for each rat that was used in this thesis work. The list of ROIs can be found in table 3.4. After the drawing was done, each ROI was saved into a NIfTI file (.nii). All ROIs that are overlaid on the structural T2 image for each rat can be found in figure 3.8, 3.9, 3.10, 3.11. Note that ROIs were drawn on multiple slices where the region was located.
The order of ROIs The region of the brain Abbreviation
1 L-Auditory cortex L-AuD 2 R-Auditory cortex R-AuD 3 L-Cingulate cortex L-Cg 4 R-Cingulate cortex R-Cg 5 L-Hippocampus L-Hp 6 R-Hippocampus R-Hp 7 L-Striatum L-Str 8 R-Striatum R-Str 9 L-Thalamus L-Th 10 R-Thalamus R-Th
Table 3.4: The order and the region of the brain of ROIs
ROI 1-6 were chosen because they are the regions which are believed to be the regions that are activated in the resting state in rats [91]. ROI 7-10 were chosen since they are located near the hippocampus.
Figure 3.9:ROI drawing of the rat L1R0 of 03/03/2016 and 04/03/2016 dataset
Figure 3.10:ROI drawing of the rat L1R1 of 03/03/2016 and 04/03/2016 dataset
Figure 3.11:ROI drawing of the rat 3 of 21/03/2016 and 22/03/2016 Seizure dataset
10 x 10 ROI correlation analysis
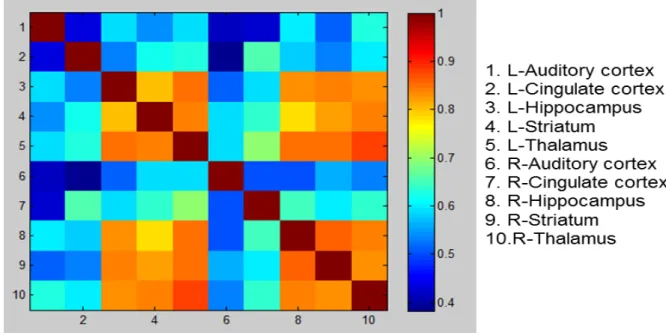
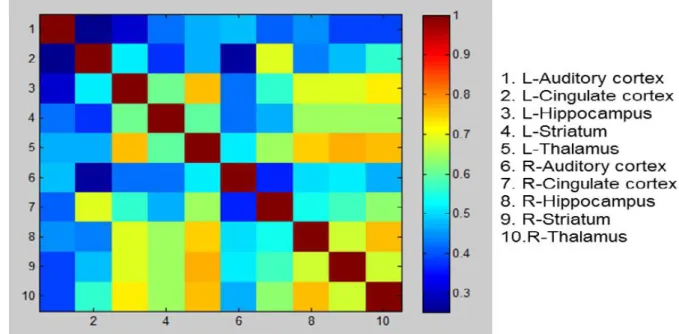
The 10 x 10 ROI correlation analysis was performed using the software DPABI (DPARSF 4.0 (for Rat Data)) [86] for all resting state and seizure fMRI dataset. All ROI files (.nii) that were drawn before were loaded as seed series and the timecourse from the ROIs were extracted from the functional images. Then the 10 x 10 matrix that consists of correlation coefficient between all ROIs was created. For visualization, the correlation matrix that was created previously was loaded in Matlab (R2010b, MathWorks, Natick, MA, U.S.A.) and a color correlation matrix was created with a legend added.
GLM analysis
For the seizure fMRI dataset, GLM analysis was performed using the software SPM 12 (Statistical Parametric Mapping, Wellcome Trust Centre for Neuroimaging, London, UK). Since the seizures were induced by KA which leads to the status epilepticus, it was not possible to have discrete seizures within the seizure fMRI EPI sessions. Therefore, we incorporated some scans of seizure fMRI EPI sessions into the scans of the resting state fMRI EPI session to make a block design in the design matrix. To do so, the seizure fMRI EPI scans were resliced to be compatible with the resting state fMRI EPI scans. The seizure fMRI EPI scans were defined as a condition of seizure with onset and duration specified. The design matrix of GLM was built in seconds option instead of in scans option. In SPM, the timepoint of the first scan in GLM design is regarded as 0 instead of 1. Therefore, the onset was set at 18 instead of 20 for 20 seconds resting - 40 seconds seizure – 20 seconds resting designs and at 38 instead of 40 for 40 seconds resting – 20 seizure – 40 seconds resting designs. The condition of the seizure was convolved with Hemodynamic Response Function (HRF) basis function. The realignment parameter for the scans in the design was added as multiple regressors. Afterwards, the model was estimated. For visualization of the statistical map, a t-contrast of 1 was applied on the column of seizure condition and the p-value was Family Wise Error (FWE) corrected and the threshold was set at the conventional value of 0.05. Then the result was overlaid on the mean functional image of the resting state fMRI scanning dataset.
ICA analysis
ICA was performed for the seizure fMRI datasets of using GIFT v 3.0a (Group ICA of fMRI toolbox). Unlike the model-driven GLM analysis, ICA analysis is not dependent on HRF and it is data-driven. The infomax algorithm was selected to set up the ICA analysis. For visualization, the Z-threshold value was set at 4.0 to have the clear separation of the activation clusters and also to reduce noise. Negative Z value was also chosen to be seen. The result of GLM analysis served as a guidance to select the correct independent component that showed activation on the brain regions. Result was overlaid on the coregistered anatomical scan of the resting state fMRI standalone dataset on 21/03/2016.
Chapter 4
Results
4.1
EEG data analysis
We analyzed EEG recording of simultaneous EEG-fMRI sessions on 21/03/2016 and on 22/03/2016 to see if the scalp EEG cap was able to show seizure activity. The same rat (rat 3) was used for both sessions and KA was injected just before we put on the scalp EEG cap. As can be seen in figure 3.4 and as we knew the hippocampus would be the onset region of the seizure which is induced by KA, the signal from electrodes 13, 14, 16 and 17 that were located over the region of hippocampus was particularly within our interest. Therefore, these electrodes were shown in power spectrum on the right side of the figures. In the power spectrum, the orange color represents the delta frequency region (0.5-4 Hz), yellow color represents the theta frequency region (4-8 Hz), green color represents the alpha frequency region (8-13 Hz) and blue color represents the beta frequency region (13-30 Hz). Epileptic activities are characterized by spikes and sharp waves with high amplitude, approximately at 1-2 Hz in delta frequency region and at 5-8 Hz in theta frequency region [92, 93, 94].
4.1.1 Simultaneous EEG-fMRI measurement when seizure induced, 21/03/2016, Rat 3
First, figure 4.1 shows the EEG data in resting state before fMRI EPI session started. There were breathing artifacts shown approximately at 1 Hz. They are clearly visible especially on the electrode 7 and they are marked by red circles in the figure. Only the normal EEG signal was shown here that represented normal neuronal activity. On the other hand, in figure 4.2 which shows the EEG data before the first fMRI EPI session began, we could clearly see the seizure activity started. When we looked at the power spectrum on the right side, we could observe the sharp highest peak in the delta frequency region at around 2 Hz. This was more pronounced on electrodes 16 and 17. Also, in figure 4.3 which shows the EEG data during the first fMRI EPI session, the seizure activities were more intense since these were observed with higher amplitude in the power spectrum. In addition to this, also in figure 4.4 which shows the EEG data during the second fMRI EPI session, the seizure activities were spotted as well. The seizure activities were manifested with spikes and sharp waves. During the EEG recording, the artifact from fMRI scanning was not discernable so it was not marked in the figure.
4.1.2 Simultaneous EEG-fMRI measurement when seizure induced, 22/03/2016, Rat 3
Figure 4.5 shows EEG data at the very beginning of the EEG recording. It can be seen that seizure activity from the KA injection which was performed the day before (21/03/2016) was still present. The seizures were more pronounced after another KA injection which was executed before the start of EEG recording on that day (22/03/2016). This can be seen in figure 4.6. figure 4.7, figure 4.8 and figure 4.9 s
![Figure 2.6: The pyramidal neurons that majorly contribute to the EEG signal [4]](https://thumb-us.123doks.com/thumbv2/123dok_us/764817.2596752/21.892.137.739.480.786/figure-pyramidal-neurons-majorly-contribute-eeg-signal.webp)
![Figure 2.9: BOLD signal shows initial dip and then a more prolonged positive signal [7]](https://thumb-us.123doks.com/thumbv2/123dok_us/764817.2596752/24.892.114.742.264.567/figure-bold-signal-shows-initial-prolonged-positive-signal.webp)

![Figure 3.4: Spatial distribution of the electrodes of the EEC cap The rat brain image was obtained from [85].](https://thumb-us.123doks.com/thumbv2/123dok_us/764817.2596752/34.892.105.759.106.454/figure-spatial-distribution-electrodes-eec-brain-image-obtained.webp)
![Figure 3.7: MRI rat head volume coil used with 7T MRI scanner [9]](https://thumb-us.123doks.com/thumbv2/123dok_us/764817.2596752/36.892.157.566.127.432/figure-mri-head-volume-coil-used-mri-scanner.webp)