Eleventh USA/Europe Air Traffic Management Research and Development Seminar (ATM2015)
Pilot Evaluation of a UAS Detect-and-Avoid
System’s Effectiveness in Remaining Well Clear
Confesor Santiago and Eric R. Mueller
Aviation Systems Division NASA Ames Research Center
Moffett Field, CA, USA
Unmanned aircraft will equip with a detect-and-avoid (DAA) system that enables them to comply with the requirement to "see and avoid" other aircraft, an important layer in the overall set of procedural, strategic and tactical separation methods designed to prevent mid-air collisions. Regulators will establish minimum operating standards for DAA effectiveness, but different combinations of algorithms, displays and procedures could be used to meet those standards. The research presented in this paper indicates the effectiveness of the combined pilot-DAA system as a function of the DAA design requirements and provides data that may be used to model the behavior of pilots when employing such systems. Two simulations involving 21 professional unmanned aircraft system (UAS) pilots evaluated eight different DAA system designs in order to assess their ability to maintain the "well clear" separation standard, i.e., the state of maintaining a safe distance from other aircraft that would not normally cause the initiation of a collision avoidance maneuver on either aircraft. When the traffic display was integrated with the primary mission map directly in front of the pilot, there were fewer losses of well clear. Greater warning time provided to the pilot was strongly correlated with success in remaining well clear. Pilots' ability to separate from aircraft with cooperative and non-cooperative surveillance systems was nearly the same after accounting for the amount of alert time provided in each encounter, although the limited surveillance volume for the airborne-equipped aircraft meant alerts tended to occur later and therefore were more difficult to resolve.
Keywords-component; unmanned aircraft systems, detect and avoid, loss of well clear, pilot-in-the-loop simulation
I. INTRODUCTION
Regulations to establish operational and performance requirements for unmanned aircraft systems (UAS) are being developed by a consortium of government, industry and academic institutions [1]. Those requirements will apply to the new detect-and-avoid (DAA) systems and other equipment necessary to integrate UAS with the United States’ (U.S) National Airspace System (NAS) and will be determined according to their contribution to the overall safety case. That safety case requires demonstration that DAA-equipped UAS operating in the NAS meet an airspace safety threshold (AST). Several key gaps must be closed in order to link equipment requirements to an airspace safety case. Foremost among these is calculation of the system’s “risk ratio”—the degree to which a particular system mitigates violation of an aircraft separation
standard [2]. The risk ratio of a DAA system, in combination with risk ratios of other collision mitigation mechanisms, will determine the overall safety of the airspace measured in terms of the number of collisions per flight hour. It is not known what the effectiveness is of a pilot-in-the-loop DAA system or even what parameters of the DAA system most improve the pilot’s ability to maintain separation. The relationship between the DAA system design and the overall effectiveness of the DAA system that includes the pilot, expressed as a risk ratio, must be determined before DAA operational and performance requirements can be finalized.
Much research across the globe has been devoted to integrating UAS into non-segregated airspace [3], [4], [5], [6]. Several traffic displays intended for use as part of a DAA system have gone through human-in-the-loop simulation and flight-testing. Most of these evaluations were part of development programs to produce a deployable system, so it is unclear how to generalize particular aspects of those designs to general requirements for future traffic displays [7]. Other displays have undergone testing to collect data that may generalize to new displays, but have not been evaluated in the context of the development of an overall safety case for UAS equipped with DAA systems in the NAS [8]. Other research efforts focus on DAA surveillance performance and separation standards. Together with this work, they are expected to facilitate validation of the airspace safety case [9][10].
The contribution of the present work is to quantify the effectiveness of the pilot-automation system to remain well clear as a function of display and algorithm features. This quantification will allow selection of a minimum set of DAA design features that meets the AST, a set that may not be unique for all UAS platforms. A second objective is to collect and analyze pilot performance parameters that will improve the modeling of overall DAA system performance in non-human-in-the-loop simulations. Simulating the DAA-equipped UAS in such batch experiments will allow investigation of a much larger number of encounters than is possible in human simulations. This capability is necessary to demonstrate that a particular set of DAA requirements meets the AST under all foreseeable operational conditions. Moreover, results related to the performance of the pilots’ use of displays and the time they required to carry out different aspects of this task may be found in a companion paper [11].
This paper will provide some background about well clear for UAS DAA systems. It will then describe the methodology used in two human-in-the-loop simulations to evaluate eight different display variants with a variety of separation algorithms. Next, it presents the experiment results and concludes with a summary.
II. BACKGROUND
The self-separation (SS) function of a DAA system is a means of compliance with the regulatory requirements (14CFR Part 91, §91.111 and §91.113) to “see and avoid” and to remain well clear of other aircraft. The concept of well clear has been proposed as an airborne separation standard to which a DAA system must adhere, and performing SS correctly means remaining well clear of other aircraft [12]. In order to build a DAA system that helps the pilot remain well clear, a quantitative definition of well clear must be defined.
Well clear is defined as the state of maintaining a safe distance from other aircraft that would not normally cause the initiation of a collision avoidance (CA) maneuver by either aircraft [2]. A well clear separation standard should be large enough to (1) avoid corrective maneuvers by intruders (i.e., any aircraft detected in range of the UAS’s surveillance system) that are equipped with a CA system (e.g., Traffic Alert and Collision Avoidance System (TCAS)—or Airborne Collision Avoidance System (ACAS)), (2) minimize traffic alert issuances by air traffic control (ATC), and (3) avoid excessive concern for pilots of proximate piloted aircraft. However, a well clear separation standard also should be small enough to prevent the need for large deviations that potentially disrupt traffic flow and ATC separation management plans.
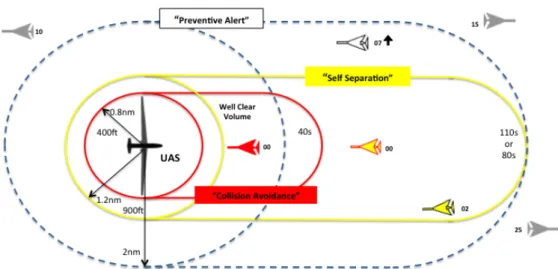
A distance-based separation minima proposed by EUROCONTROL was considered [13]; however, the lack of a time separation criterion creates interoperability issues with when an intruder’s collision avoidance system would activate. The definition of well clear used here predates the work performed in U.S. by the UAS Sense and Avoid Science and Research Panel [14], whose charter was to derive a DAA well clear separation standard. However, the two approaches share a similar heritage. The separation standard for well clear used here is based on logic that predicts the closest point of approach (CPA) between the UAS and other aircraft, and thresholds were selected to be conceptually outside the range at which TCAS will trigger a resolution advisory. For this study, a loss of well clear is defined to occur when the predicted CPA horizontal separation is less than 0.8 nmi, CPA altitude separation is less than 400 feet, and time-to-CPA is less than 40 seconds. The closest point of approach between two aircraft is an estimate of the future minimum slant range. Time-to-CPA is defined as the difference between the time at predicted CPA and current time.
III. METHODOLOGY
This research consisted of two experiments involving professional UAS pilots situated at a UAS ground-control station (GCS). The objective of the first experiment (Experiment 1) was to evaluate candidate DAA displays and algorithms for their effectiveness in helping pilots remain well clear of all traffic. More specifically, Experiment 1 investigated
(1) the appropriate alerting thresholds for self-separation, i.e., remaining well clear, (2) minimum information requirements for DAA displays, and (3) advanced display features that could potentially improve accuracy and expediency in pilot’s determining, negotiating, and executing maneuvers to maintain well clear. A follow-on experiment (Experiment 2) leveraged lessons learned from Experiment 1 to continue the evaluation of candidate displays and algorithms with respect to a pilot’s ability to remain well clear. Furthermore, communication latencies and limitations in surveillance detection range and field of regard were modeled to increase the fidelity of the overall DAA system.
A. Participants
A total of 21 pilot participants participated in these two studies. Participants were required to hold, at a minimum, an Instrument Rating or pilot certification through the military. The pilots were either members of the California Air National Guard (163rd Reconnaissance Squadron) or Beale Air Force Base, and all had experience flying the Global Hawk (RQ-4) or Reaper (MQ-9). Two retired air traffic controllers with experience at the Oakland Air Route Traffic Control Center (ZOA) and three pseudo-pilot confederates also participated in these studies.
B. Simulation Environment
The UAS pilot participants were positioned at a UAS GCS, either the Vigilant Spirit Control Station (VSCS) [15] (see Figure 1(a)) provided by the Air Force Research Laboratory, or the NASA-developed Cockpit Situation Display (CSD) (see Figure 1(b)). The Multi-Aircraft Control Station (MACS) [16] provided the ATC environment with pseudo-pilot stations for controlling simulated “manned” aircraft traffic within the airspace.
The CSD is an interactive 3D volumetric display designed to provide pilots with awareness of their surroundings [17]. In Experiment 1, it was used to display traffic, trajectory information, and loss-of-well-clear alerts, and it provided tools to aid the pilot in selecting maneuvers to prevent losses of well clear when necessary. The CSD served as a “standalone” display with relevant DAA information located next to the pilot’s primary command and control display, the VSCS. When co-located with the VSCS, the CSD was displayed in the bottom-left monitor in Figure 1(a). The CSD was not used in Experiment 2 for reasons explained in Section III.C.
The VSCS’s primary monitor contains a Tactical Situation Display (TSD, shown at the bottom-center of Figure 1(a)), which displayed the UAS ownship and mission route over a
(a) (b)
Figure 1: (a) Vigilant Spirit Control Station, (b) Cockpit Situation Display
moving map. All commands performed by the pilot participants were executed using editing and navigation windows within the TSD. A second monitor displayed VSCS’s simulated out-the-window nose-camera view (top-center of Figure 1(a)). This “soda straw” nose-camera view provided pilots with accurate terrain information and an integrated head-up display that contained current airspeed, altitude and heading information.
MACS is a simulation platform that instantiates small- or large-scale airspace environments. MACS also models the participation of other flights by simulating flight paths of individual aircraft based on their source and destination airports, flight plan, flight rules, and confederate pilot interactions. For these experiments, MACS was configured to provide confederate pilots an interface to control multiple aircraft as well as an emulation of the display system replacement (DSR) for the confederate air traffic controller.
For these simulations, sectors 40 and 41 from Oakland Air Route Traffic Control Center were used. The UAS pilots commanded a simulated unmanned aircraft with characteristics similar to a Predator-B. Realistic current-day traffic levels and flows were simulated within sectors 40 and 41.
C. Experiment Design
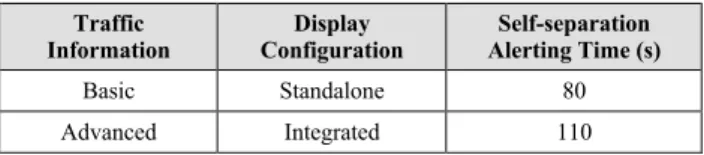
In Experiment 1, a mixed factorial, repeated measure design was used to study pilot response times, number of losses of well clear, separation at closest point of approach, and other DAA measures. A 2x2x2 experiment design matrix was used (see Table 1) involving three independent variables: display configuration, level of traffic information and resolution tools, and lead time for self-separation alerts.
The standalone display configurations provided traffic information via the CSD but required the pilot to command and control from the “separate” VSCS display. Conversely, the integrated display configurations provided traffic information within the VSCS itself; i.e., all information and controls were integrated into a single display.
The basic (minimum) traffic information configuration included a basic set of traffic information to aid the pilot in remaining well clear: intruder’s location, ground speed, relative altitude, vertical velocity indicator, heading, flight identifier (ID), range, and bearing. The advanced information configuration included all the basic elements, augmented with alerting indications on traffic that may cause a loss of well clear, graphical depiction of CPA location, time-to-CPA, a trial planner tool, and maneuver recommendations to resolve predicted losses of well clear.
The two self-separation alerting thresholds governed the self-separation alert lead time, the lead time an alert provides to a pilot in which to act to remain well clear. Like well clear, the alert lead time was based on time-to-CPA. It is important the alerting time of a DAA system be acceptable to air traffic
controllers. The larger value, 110 seconds prior to CPA, was based on playing back short traffic scenarios through MACS and having ATC participants assess when they would provide traffic advisories (TAs) for various encounters. The results revealed, on average, that ATC gave TAs at 110 seconds time-to-CPA. The smaller value, 80 seconds prior to CPA, was selected to study the effectiveness of pilots to remain well clear with relatively less alerting time.
As a follow-on to Experiment 1, four additional displays were evaluated in Experiment 2, for a total of eight display concepts. Since the integrated display configurations were more effective in aiding the pilot to remain well clear than the standalone display conditions, the focus in Experiment 2 was to evaluate differences between specific advanced display features from Experiment 1 using only the integrated display (i.e., the VSCS). As for Experiment 1, Experiment 2 also used a one-way repeated-measures factorial design to collect data on pilot measured response, number of losses of well clear, separation at closest point of approach (CPA), and other DAA measures. Four display configurations were used to create a simple four-cell experiment. All test configurations used the integrated display concept (dropped standalone) from Experiment 1, where traffic display information was co-located within the GCS. Display 1 augmented the “Basic Integrated” display configuration from Experiment 1 with (1) alerting indications on targets that may cause a loss of well clear and (2) graphical depiction of CPA location. This display was considered the baseline in Experiment 2. The second display configuration (Display 2) refined Display configuration 1 by introducing a trial planner tool, which allowed the pilot to use the display to interactively search for heading and altitude changes that are clear of all traffic when a predicted loss of well clear is presented. The third display configuration (Display 3) added to the basic information-only display an indication of a recommended maneuver from Autoresolver-AD (see Autoresolver Adaptor section of [18]) that a pilot could easily execute when a predicted loss of well clear is alerted. The final display configuration (Display 4) added to the basic information-only display the union of Displays 3 and 4. Also, a single self-separation alerting threshold of 110 seconds prior to CPA was employed; hence it was not an independent variable.
Every pilot participant was involved in four trials using each display configuration once. The order of display configurations for each pilot participant was counter-balanced. Also, for this experiment an embedded variable was added to simulate cooperative- and non-cooperative sensor performance. Details on how cooperative and non-cooperative were modeled are described in Section III.D. This embedded surveillance variable was not counter-balanced. Each pilot for each display configuration experienced scripted traffic encounters; approximately two-thirds of the encounters were detected using simulated non-cooperative sensors (i.e., no electronic means of identifying aircraft and exchanging state information) aboard the UAS, and one-third were detected using the simulated cooperative sensor (i.e., electronic means of identifying aircraft and exchanging of state information). This variable was not part of the experimental design, because the intent was to evaluate differences between the encounter types across the four display conditions in Experiment 2.
Table 1: Experiment 1 - Experiment Design Matrix
Traffic Information Display Configuration Self-separation Alerting Time (s) Basic Standalone 80 Advanced Integrated 110
D. Detect-and-avoid System
The DAA system was simulated using a software architecture called JADEM (Java Architecture for DAA Modeling and Extensibility) [18] that models various components of DAA systems, including the detect, track, evaluate, prioritize, declare, determine, and command functions. The modeling of these functions is described briefly below.
The detect and track function—or surveillance system— adapted for these simulations used spatial filtering that only displayed traffic within a range of 80 nmi of the cooperative sensor. This 80-nmi range is much larger than Automatic Dependent Surveillance–Broadcast (ADS-B) specifications; however, in order to nullify the potential effect of undetected cooperative traffic precisely at the self-separation alert ranges, a broader, notional range for a cooperative sensor was employed. A non-cooperative sensor—a state-of-the-art airborne radar—was simulated using a similar procedure; however, only traffic within six nmi range, +/- 110 degrees azimuth off the current heading of the UAS, and +/- 20 degrees elevation between the center mass of the UAS were depicted on the display. State estimation was “perfect” for all traffic; thus, no tracking algorithm was employed.
The evaluate, prioritize, and declare functions are responsible for evaluating each intruder detected by the surveillance system and determine its threat alerting level. To determine if a threat is predicted between a UAS and a given intruder, a reference trajectory is synthesized from the UAS’s known intent. A reference trajectory is also built for every intruder and modeled as a “dead-reckoned” extrapolation of the most recent intruder state (position and velocity). Time-synchronized progression along discretized projected states along the ownship’s and intruder’s trajectories are used to find the predicted CPA—the minimum slant range along the trajectories. The threats are classified using the predicted CPA, and they are prioritized based on their separation and urgency. The separation criteria, alerting time, and alert color-scheme are illustrated in Figure 1. The five alerting levels used in these simulations are as follows:
• Collision avoidance (CA) alert (red targets in Figure 2): The basis of this alert is to indicate to the pilot that s/he has lost well clear with another aircraft, and immediate action is required. Thus, the criteria for this alert are the same as the standard for well clear: predicted CPA horizontal separation is less than 0.8 nmi, CPA altitude separation is less than 400 feet, and time-to-CPA is less than 40 seconds. Pilot action: Immediate action is required to regain well clear; notify ATC as soon as practicable after taking action. • Self-separation (SS) alert (yellow targets with red
outline in Figure 2): This alert is similar to the CA alert above. It uses the same spatial separation; however, additional alert time is provided to give ample time for the pilot to take action. This alert level is the primary indication to the pilot that action is
necessary to remain well clear. Much of the pilot’s effectiveness in maintaining well clear will be evaluated as a function of the lead time with which the pilot was first presented a self-separation alert. The criteria for a self-separation alert are as follows: predicted CPA horizontal separation is less than 0.8 nmi, CPA altitude separation is less than 400 feet, and time-to-CPA is less than 80 or 110 seconds, depending on the test case. Pilot action: Action to remain well clear will be necessary if the encounter does not change; coordinate with ATC to determine an appropriate maneuver, if there is sufficient time to remain well clear.
• Self-separation “buffered” alert (yellow targets with black outline in Figure 2): This alert includes a spatial buffer to the SS alert criteria. Predicted CPA horizontal separation is less than 1.2 nmi, CPA altitude separation is less than 900 feet, and time-to-CPA is less than 80 or 110 seconds. Pilot action: Action to remain well clear will be necessary only if intruder suddenly makes a horizontal or vertical maneuver. • Preventive alert (white targets in Figure 2):
Predicted CPA horizontal separation is less than 2.0 nmi, CPA altitude separation is less than 900 feet, and time-to-CPA is less than 80 or 110 seconds. Pilot action: No action necessary to avoid this aircraft, but its presence should be considered when determining a resolution maneuver to avoid other aircraft.
• “No” alert (gray targets in Figure 2): Intruder is within surveillance detection range but does not satisfy the criteria for any of the above alert levels.
The determine function is the process by which the pilot determines a maneuver to resolve an alerted threat. If the pilot receives a SS alert, the concept is for the pilot to use the display and algorithms to select a maneuver, coordinate with ATC, and execute it prior to losing well clear. A conflict resolution algorithm, called GRACE [18], was used to simulate the collision avoidance function. Upon receiving a CA alert, GRACE computes a hypothesized “best” maneuver—a horizontal vector or altitude change—to execute in order to regain well clear. The maneuver is depicted on the display to trigger pilot action. In the case of a SS alert, depending on the display configuration, the pilot may use (a) his own judgment (basic condition), (b) a trial planner (advanced condition), or (c) Autoresolver-AD maneuver recommendations (advanced condition) to avoid losing well clear. Autoresolver-AD is adapted from the Autoresolver algorithm for conventional air traffic to enable UAS to remain well clear within the detect-and-avoid domain [19]. Key adaptations for DAA applications include contending with shorter look-ahead times, lack of trajectory intent information for intruder aircraft, smaller spatial separation standards, introduction of temporal separation requirements in addition to spatial, more frequent update rates, and single “ownship” point-of-view vs. centralized separation management of multiple aircraft.
E. Procedures
Pilot participants began with extensive training on the basic functionality of VSCS. Prior to each experiment trial, participants were trained on the distinct aspects of the display configuration for that trial and then completed a 20-minute practice scenario. Participants completed four experiment trials from the set of experiment configurations described in Section III.C. Experiment trials were approximately 38 minutes long. After each trial, participants completed a post-trial subjective questionnaire. At the end of the experiment, participants completed a post-simulation questionnaire.
During each trial, the pilot was responsible for flying a pre-filed mission route. The UAS mission was prescribed under Instrument Flight Rules, so the pilot was required to comply with ATC clearances. Furthermore, the pilot was responsible for monitoring traffic display alerts to maintain safety of flight. When a CA alert was presented, the pilot was required to expeditiously execute the prescribed collision avoidance maneuver presented on the display and notify ATC of their divergence from their clearance. Data for reaction times and maneuver types for collision avoidance were not recorded, as this information was not pertinent to the experiment objectives; these tasks were required only to add realism to the environment. The focus of the experiment was on the information and actions prior to losing well clear.
When a SS alert was presented, it was the pilot’s discretion to determine if/when a maneuver was necessary. If a maneuver was necessary the pilot was responsible for requesting a clearance from ATC based on their desired maneuver as time permitted in order to remain well clear. When uploading a resolution maneuver, the pilot modified a downstream waypoint on its route, or commanded a heading, altitude, and/or indicated airspeed through the UAS’s autopilot system. Also, in order to present the pilot with a realistic workload, besides using the traffic display and information the pilot was also required to monitor and respond to system health status tasks and chat sessions. These chat sessions would require the UAS pilots to engage dispatch to communicate information such as mission radio frequency changes, radial and distance checks, and fuel level remaining requests, however were
secondary to complying with ATC clearances and maintaining safety of flight. The pilot operated the UAS during the mission’s enroute portion only; no takeoff or landing was included in these simulations.
F. Scenarios
Pilots flew two different mission routes embedded within four trial conditions. The missions were based on realistic current-day routes allowed under special conditions (Certificate of Authorization or Waiver) in ZOA sectors 40 and 41. The first mission was a fire-monitoring mission, and the second was a coastal watch pattern. The traffic patterns and density were developed alongside an ATC subject matter expert and designed to represent a busy, current day in the chosen airspace.
Within each trial, approximately eight traffic encounters causing SS alerts were designed into the scenarios. The encounters’ characteristics were designed using a combination of encounter angles (e.g., head-on, crossing, or overtaking), relative velocities (0 or 20 knots), and relative vertical trajectories (level-level or level-transitioning). Confederate controllers facilitated the scripted encounters by issuing encounter-inducing clearances to specific pre-planned surrounding aircraft.
IV. RESULTS
Results are presented for Experiment 1 and Experiment 2 in terms of the primary metrics: the proportion of encounters that resulted in loss of well clear and the timing associated with these encounters.
A. Loss of Well Clear Proportions in Experiment 1
The most important metric related to the safety of the combined pilot-DAA system is the proportion of encounters for which it fails to maintain the well clear separation standard, referred to here as a loss of well clear (LoWC). This proportion depends on the lead time before the LoWC at which the alert is first issued, because, if the lead time is too short, there will not be adequate time for the pilot to determine a resolution maneuver, enter and upload it to the aircraft, and allow the aircraft to change its trajectory sufficiently to avoid a LoWC. If
a large amount of warning time is provided to the pilot, it is expected that the LoWC proportion would become insensitive to that parameter, because other factors, such as late-maneuvering intruders and air traffic constraints, would overwhelm the additional benefit of a few extra seconds of warning.
A histogram of the number of encounters experienced by the pilot participants as a function of the self-separation alert initial warning time is shown in Figure 3. This chart also shows the outcomes of those encounters: the number of encounters for which the pilot-DAA system prevented a loss of well clear with the intruder is shown in green for each time-to-CPA bin, while the number of encounters that resulted in a LoWC is shown in red. The left-most bin represents those encounters that were first alerted with less than 40 seconds to CPA, which corresponds to the LoWC threshold. So, all of those encounters were “popup” LoWCs, because the pilot was not alerted until well clear had been lost. The next bin represents encounters between 40 and 55 seconds time-to-CPA, which means the pilot had less than 20 seconds of warning before a LoWC occurred, and all but two of the 18 encounters resulted in LoWCs. The three bins on the right represent encounters with warning times between 55 and 110 seconds before predicted LoWC. Figure 4 presents the same data as a ratio of “red to green” for each time-to-CPA bin. The figure indicates that warnings less than 15 seconds prior to losing well clear nearly always resulted in a LoWC and warning times much greater than this number did not significantly (p>0.05) reduce the proportion of LoWC. Furthermore, the number of LoWCs did not significantly (p>0.05) decrease as a function of the number of trials performed by a test subject, suggesting that learning effects were negligible.
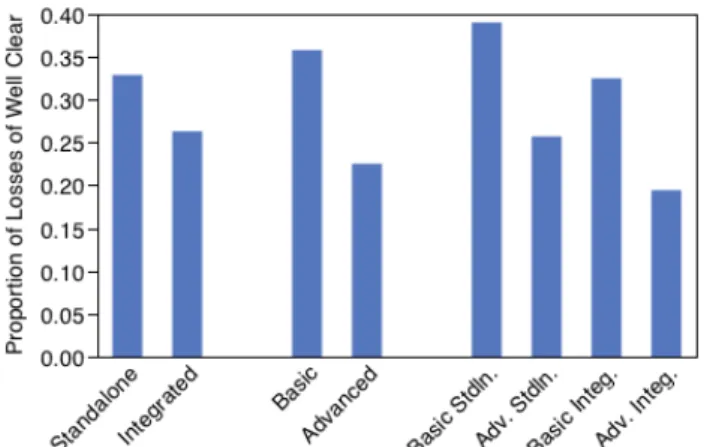
The proportion of encounters that became LoWCs was also calculated as a function of the display configuration. Additional display elements may help the pilot avoid LoWCs if they provide appropriate information in a logical manner for the task, but they may also take more time to use or distract the pilot and increase the LoWC rate. For this analysis,
“popup” LoWCs were filtered out, because they give little indication as to how effective the displays were at aiding the pilot to remain well clear. The overall proportion of LoWCs by display condition is shown in Figure 5.
Twenty percent fewer LoWCs were produced when pilots used the integrated display as compared to the standalone display, and 45% fewer LoWCs were produced when pilots used the advanced display as compared to the basic display. Although these differences are large, they are not statistically significant (p>0.05) because of the large variability in the number of LoWCs from scenario to scenario. The two basic displays performed poorly, with nearly twice the rate of LoWCs as any of their advanced display counterparts. The LoWC rate metric appears to be helpful in ruling out the use of a basic display, but it cannot differentiate between the other display types, because none of the differences are statistically (p>0.05). Additional safety and efficiency metrics are necessary to determine minimum requirements for a DAA algorithm and display system.
B. Maneuver Timing Results in Experiment 1
The final metrics related to the use and effectiveness of a DAA system are the amount of time required by the pilot from the first alert to upload of a resolution maneuver: i.e., pilot response time and the time-to-CPA at which maneuvers are uploaded to the aircraft. Each of these metrics can be further categorized by whether the pilot obtained an ATC clearance before s/he uploaded the maneuver, the standard procedure, or if they uploaded the maneuver without an amended clearance, a permissible but not preferable course of action. These metrics are important from a safety standpoint, because maneuvers executed without an ATC clearance can interfere with an air traffic controller’s plan for the traffic in their sector and contribute to secondary conflicts. Additional LoWCs can occur when longer times are required to determine and execute maneuvers and those maneuvers are executed more closely to the well clear boundary. In contrast to the previous section, all encounters in this section represent successful maneuvers for remaining well clear.
Figure 3: Outcome of encounters (actual losses of well clear vs. those that were prevented) by time to closest point of approach at which SST alert was
first provided.
Figure 4: Proportion of encounters that became losses of well clear by time to closest point of approach at which SS alert was first provided.
The time difference between the first SS alert and the first upload of a resolution maneuver is referred to here as pilot response time. As expected, ATC clearances were obtained under most circumstances, and the greater the time between the alert and upload, the greater the likelihood that an amended clearance was received. This suggests that additional time spent by the pilot in determining a course of action was rewarded by an improved approval rate from ATC. Figure 6 shows the mean response time (in terms of time-to-CPA) grouped by whether or not the pilot obtained an ATC clearance. In all time-to-CPA bins, mean response time is larger when obtaining a clearance, and—contradictory to the procedures for this experiment— there are instances where the pilot obtained a clearance from ATC prior to maneuvering when time-to-CPA was less than 40 seconds (i.e., well clear was already lost). As summarized in Table 2, median response times were significantly (p<0.05) shorter when an amended clearance was not obtained: 16 seconds without a clearance versus 27 seconds with a clearance. This difference illustrates that pilots were more likely to act without obtaining an ATC clearance when alerts occurred nearer to the well clear boundary.
The response-time values help to explain the results presented previously that showed a low probability of resolving a potential LoWC when the alert time is less than 20 seconds. Because it typically takes a pilot 16 seconds to determine and upload a resolution maneuver even without an ATC clearance, 20 seconds of warning leaves only a few seconds for the aircraft to maneuver to maintain well clear. This is rarely sufficient. The median response time with an ATC clearance of
27 seconds suggests that a reasonable nominal alert time before a LoWC should be at least 40 seconds in order to provide a buffer for more difficult encounter cases, and perhaps considerably more than this if intruders can be reliably identified at that horizon. Although somewhat counter- intuitive, the mean maneuver execution time is nearly identical for the two cases at 51.7 and 53.9 seconds (see Table 2) and the distributions are similar. This result suggests that pilots prefer to obtain clearances following the standard procedure, but that they will work to ensure they resolve a potential violation at a time appropriate for the given encounter, whether or not they have obtained a clearance.
C. Losses of Well Clear Proportions in Experiment 2
The second pilot-in-the-loop simulation split the integrated display into four different variants of available tools. This display condition was the most promising system tested during Experiment 1, so it was natural to investigate which of the tools in that condition was most effective in reducing LoWC rates and LoWC durations when they did occur.
Experiment 2 incorporated both cooperative and non-cooperative aircraft, so the number of LoWCs as a fraction of the overall encounters by time of first self-separation alert can be classified by the type of aircraft encountered as well. Figure 7 shows the outcomes of encounters with cooperative aircraft by time-to-CPA at which the intruder was first predicted to become a LoWC, while Figure 8 shows the same data for non-cooperative aircraft encounters. The distribution of time-to-CPA of alerts for non-cooperative aircraft is smaller (median = 64.5 seconds), because the limited surveillance range reduces the time at which an alert can first be detected. The distribution of time-to-CPA for cooperative aircraft is around 110 seconds, because most of the time the surveillance system already detected and tracked the aircraft prior to the 110-second threshold. Both figures illustrate decreases in proportion of LoWCs as the time-to-CPA of the self-separation alert increases. Only two LoWCs occurred with cooperative aircraft when the alert time was greater than 20 seconds to LoWC (time-to-CPA greater than 60 seconds), and only three LoWCs occurred with the non-cooperative aircraft. When excluding “popup” LoWCs, pilots were able to prevent LoWCs in 76% of the encounters with non-cooperative aircraft when alerted 20 seconds or less prior to losing well clear, and in 96% of the encounters with non-cooperative aircraft when alerted more than 20 seconds prior to losing well clear. For encounters with cooperative aircraft, the pilots were able to prevent 50% of
Figure 5: Proportion of encounters that became losses of well clear by display condition in Experiment 1.
Figure 6: Mean response time by time-to-CPA at which the first SS alert was provided, classified by whether or not the pilot obtained an ATC clearance
before maneuvering in Experiment 1.
Table 2: Pilot response time and maneuver execution time statistics in Experiment 1. Only encounters in which the pilot successfully
prevented LoWCs are included.
Statistics in seconds Without ATC Pilot Acted Clearance
Pilot Obtained ATC Clearance
Median Response Time 16 27 Mean Response Time 20.8 31.2 Std. Dev. of Response
Time 13.9 17.9 Time-to-CPA at
predicted LoWCs when alerted 20 seconds or less prior to losing well clear, and 93% of predicted LoWCs when alerted with more than 20 seconds. Although one would hope that no LoWCs occur regardless of the time of first alert, the self-separation system tested here is designed to deal with only those more strategic encounters that begin well outside the violation regime. A separate collision avoidance function would be employed to resolve self-separation alerts that occur less than 20 seconds prior to LoWC.
The proportion of all encounters that became losses of well clear by display condition is presented in Figure 9. It is still unclear which advanced display feature from Experiment 1 affected the reduction in LoWCs, however, the proportion of LoWCs was slightly less with the addition of maneuver recommendations (Display 3), and the proportion of LoWCs was approximately 50% less with the addition of recommended maneuvers and a trial planning tool together (Display 4) as compared to the “Information Only” display (Display 1). However, none of the performance differences between displays was statistically significant (p>0.05).
D. Maneuver Timing Results in Experiment 2
Various statistics associated with pilot response time are presented in Table 3. The metrics are classified based upon whether or not the pilot obtained an ATC clearance prior to maneuvering, and then by (a) all encounter types, i.e., cooperative and non-cooperative (overall), (b) encounters with cooperative aircraft, and (c) non-cooperative aircraft. Overall, mean pilot response time was significantly (p<0.05)
shorter when pilots maneuvered without obtaining an ATC clearance (mean = 10.8 seconds) as compared to when they did obtain an ATC clearance (mean = 18.7 seconds). This result held for encounters with cooperative aircraft and with non-cooperative aircraft. Moreover, pilot response times were shorter for encounters with cooperative aircraft in Experiment 2 than in Experiment 1. An analysis of variance of pilot response times between experiments found the improvement to be statistically significant (p<0.05). The shorter response times in Experiment 2 may have been facilitated by pilots’ opportunity to focus on the integrated display, which appears to be the most effective display. Also, because pilots in Experiment 2 needed only to train on the VSCS and not the CSD, their experiment days were shorter, possibly contributing to reduced pilot fatigue and better performance. Thirdly, improved training materials regarding procedures and methodologies for remaining well clear may have contributed to better performance. The largest pilot response time was for encounters with cooperative aircraft when pilots obtained an ATC clearance (mean = 24.7 seconds), which is intuitive as the superior surveillance information available from cooperative aircraft affords longer alert lead times, making it allowable for pilots to take more time in determining a maneuver to prevent LoWCs and obtaining an ATC clearance before executing.
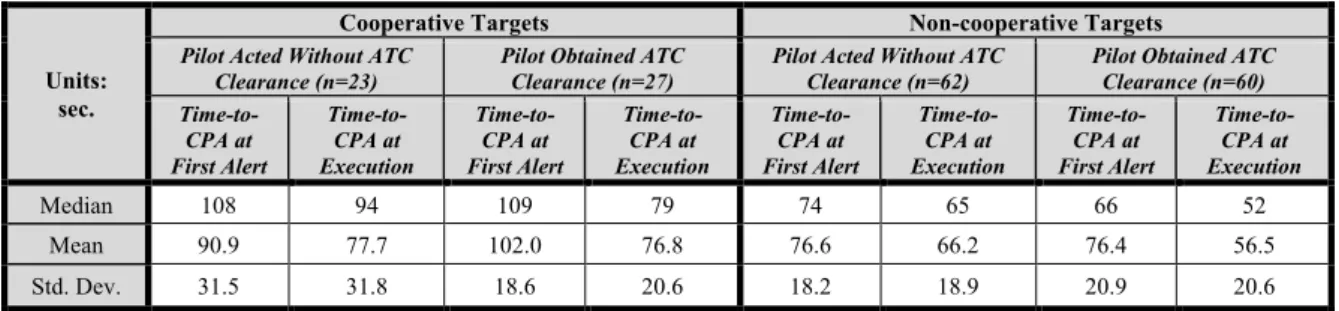
The main metric in Table 4 is time-to-CPA when the pilot executes a maneuver to remain well clear. Counter to intuition, the mean times-to-CPA at execution for encounters with cooperative aircraft are approximately the same, regardless of whether the pilot did or did not take the time to obtain an ATC clearance (76.8 and 77.7 seconds, respectively). This is interesting because, as described earlier, pilot response time was significantly less when the pilot acted without an ATC clearance; so, one might have expected the same trend with time-to-CPA at execution.
The clarifying result is with time-to-CPA at first alert in Table 4. For these same scenarios, it shows that for encounters with cooperative aircraft, longer warning lead times (mean 102.0 seconds time-to-CPA) correlated with cases in which pilots did obtain an ATC clearance; the shorter warning lead times (90.9 seconds time-to-CPA) correlated with cases in which pilots acted without obtaining a clearance. This
Figure 7: Outcome of encounters with cooperative aircraft (actual losses of well clear vs. those that were prevented) by time to closest point of approach
at which SS alert was first provided.
Figure 8: Outcome of encounters with non-cooperative aircraft (actual losses of well clear vs. those that were prevented) by time to closest point of
approach at which SS alert was first provided.
Figure 9: Proportion of encounters that became losses of well clear by display in Experiment 2.
Table 3: Pilot response time statistics from Experiment 2. Only encounters in which the pilot successfully prevented LoWCs are included.
Table 4: Time-to-CPA at First Alert and Execution from Experiment 2. Only encounters in which the pilot successfully prevented LoWCs are included.
Units: sec.
Cooperative Targets Non-cooperative Targets
Pilot Acted Without ATC Clearance (n=23)
Pilot Obtained ATC Clearance (n=27)
Pilot Acted Without ATC Clearance (n=62)
Pilot Obtained ATC Clearance (n=60) Time-to-CPA at First Alert Time-to-CPA at Execution Time-to-CPA at First Alert Time-to-CPA at Execution Time-to-CPA at First Alert Time-to-CPA at Execution Time-to-CPA at First Alert Time-to-CPA at Execution Median 108 94 109 79 74 65 66 52 Mean 90.9 77.7 102.0 76.8 76.6 66.2 76.4 56.5 Std. Dev. 31.5 31.8 18.6 20.6 18.2 18.9 20.9 20.6
suggests that pilots’ decision-making processes are influenced by the alert lead time. Furthermore, the target time that these pilots wanted in order to maneuver their UAS against cooperative aircraft was approximately 77 seconds time-to-CPA—or about 37 seconds prior to losing well clear— regardless of whether or not the pilot requested and obtained an ATC clearance.
Lastly, a statistically significant difference was observed in the time-to-CPA at the time of maneuver execution for encounters with non-cooperative aircraft between pilots obtaining an ATC clearance (mean = 56.5 seconds) and pilots not obtaining a clearance (mean = 66.2 seconds). The difference here stems from the pilot response time distribution for encounters with non-cooperative aircraft, since the alerting times were about the same whether or not an ATC clearance was obtained. Figure 10 shows mean response time by time-to-CPA, classified by whether the pilot obtained an ATC clearance before maneuvering. As expected, response time is always larger in cases when the pilot obtains an ATC clearance prior to maneuvering except for when time-to-CPA is 40 seconds or less, because in those cases the pilot almost always
acts without a clearance. The largest difference in response time between the cases in which the pilot does and does not obtain an ATC clearance was for times-to-CPA between 70-80 seconds, and the smallest difference was for times-to-CPA between 60-70
Regarding the displays’ effectiveness at enhancing pilot response times (not illustrated here in a figure), Display 3 and 4 were correlated with shorter response times by approximately five seconds when compared to Display 1 and 2. Displaying a maneuver recommendation to the pilot may expedite his action and enhance his ability to remain well clear; however, no statistically significant differences (p>0.05) in response time were observed among the displays.
V. SUMMARY
The overall effectiveness of the DAA system that includes the pilot was evaluated so that operational and performance requirements can be determined. The relationship between specific display and algorithm features and the risk ratio of the combined pilot-DAA system was investigated. The first objective of this work was to study the effectiveness of the pilot–DAA system to remain well clear as a function of display and algorithms features. The second objective was to collect and analyze pilot performance parameters that will help improve DAA modeling in batch computer simulations. Over the course of two experiments, 21 professional UAS pilots evaluated eight different DAA systems. In the first experiment, the independent variables were the alerting times at which pilots needed to take action to remain well clear, the location of the traffic display (standalone vs. integrated), and the tools and informational elements available on the display. In the second experiment, new display types were examined, and the UAS encountered two categories of aircraft: those equipped with simulated ADS-B that could be displayed up to 80 nmi away and those without that were only detectable by a simulated radar (non-cooperative) within a range of six nautical miles. Total Response
Time (sec) Overall Pilot Acted Without ATC Clearance Coop. Non-coop. Overall Pilot Obtained ATC Clearance Coop. Non-coop.
Median 9 11 9 16 19 14 Mean 10.8 13.4 9.8 18.7 24.7 15.9 Std. Dev. 3.1 8.4 6.2 7.9 13.2 8.5
N 85 23 62 87 27 60
Figure 10: Mean response time by time to closest point of approach at which the first SS alert was provided classified by whether the pilot
In Experiment 1, pilots were almost never able to remain well clear when self-separation alerts were provided 15 seconds or less prior to loss of well clear (i.e., less than 55 seconds time-to-CPA). The “Advanced Integrated” display resulted in the least amount of time spent in a LoWC, which was the only statistically significant LoWC severity result. When maneuvering to prevent LoWCs, median response times were significantly shorter when the pilot did not obtain an amended clearance: 16 seconds without a clearance and 27 seconds with a clearance.
There were fewer LoWCs in Experiment 2, because the pilots relied exclusively on the integrated display from Experiment 1, which resulted in fewer LoWCs than the standalone displays. No display in Experiment 2 resulted in significantly fewer LoWCs than any other. When excluding “popup” LoWCs, pilots were able to prevent LoWCs in 76% of the encounters with non-cooperative aircraft when alerted 20 seconds or less prior to losing well clear, and in 96% of the encounters with non-cooperative aircraft when alerted more than 20 seconds prior to losing well clear. For encounters with cooperative aircraft, the pilots were able to prevent LoWCs 50% of the time when alerted 20 seconds or less prior to losing well clear, and 93% of the time when alerted with more than 20 seconds. Pilot response times were shorter in Experiment 2 due to improved training and methodologies. The mean pilot response time for all encounters when pilots obtained an ATC clearance prior to maneuvering was 18.7 seconds, and it was 10.8 seconds for encounters when pilots decided to maneuver without obtaining an ATC clearance.
As safety case standards are still being developed, it is not yet known whether these specific DAA system designs will meet the airspace safety threshold. However, these results suggest that integrating DAA traffic information together with the pilot’s primary tactical situation display may reduce the proportion of LoWCs. Furthermore, data from this experiment will be used to build a more “representative” DAA system for non-human-in-the-loop simulations.
ACKNOWLEDGMENT
The authors greatly appreciate the support and assistance provided by Mr. Mohamad Refai, Mr. James Snow, and Dr. Michael Abramson from University Affiliated Research Center, University of California Santa Cruz. The authors also thank Ms. Lisa Fern and Mr. Conrad Rorie from San Jose State University for leading the experiments and supporting data analyses. Lastly, the authors are grateful to NASA’s UAS Integrated Testing and Evaluation team for helping create a high-quality DAA simulation environment.
REFERENCES
[1] RTCA, Inc. Special Committee 228, “Detect and avoid (DAA) Whitepaper,” RTCA-SC228-WG1-WP01-01, 2013.
[2] Federal Aviation Administration, “Sense and Avoid (SAA) for unmanned aircraft systems (UAS),” SAA Workshop Second Caucus Report, 2013.
[3] K. Dalamagkidis, K. P. Valavanis, and L. A. Piegl, On integrating unmanned aircraft systems into the national airspace system: issues, challenges, operational restrictions, certification and recommendations, ser. International series on intelligent systems, control, and automation:
science and engineering, S. G. Tzafestas, Ed. Springer-Verlag, 2009, vol. 26.
[4] P. Ostwald and W. Hershey, “Helping global hawk fly with the rest of us,” in ICNS Conference, 2007.
[5] M. Gillian, G. J., and V. Cox, “Integration of unmanned aircraft systems into the national airspace system. concept of operations v2.0,” American Society of Testing & Materials, Tech. Rep., Sep 2012.
[6] H. H. Hesselink and D. R. Schmitt, “UAS air traffic insertion starts now,” National Aerospace Laboratory NLR, Tech. Rep., 2011. [7] Calhoun, G., Miller, C., Hughes, T., and Draper, M., “ UAS sense and
avoid system design and evaluation,” Proceedings of the Human Factors Ergonomics Society 58th Annual Meeting, October 2014.
[8] Bell, S., Drury, J., Estes, S., and Reynolds, C., “GDTI: A ground station display of traffic information for use in sense and avoid operations,” IEEE, 31st Digital Avionics Systems Conference, Williamsburg, VA,
October 2012.
[9] Johnson, M., Mueller, E., and Santiago, C., “Investigating the impacts of a separation standard for UAS operations in enroute and transition airspace,” 2015, unpublished.
[10] Park, C., Lee, S.M., and Mueller, E., “Investigating detect-and-avoid surveillance performance for unmanned aircraft systems,” Proceedings of 14th AIAA Aviation Technology, Integration, and Operations Conference, AIAA 2014-2413, June 2014.
[11] Rorie, C., Fern, L., and Shively, J., “An evaluation of detect and avoid visplays for unmanned aircraft systems: the effect of information level and display location on pilot performance,” AIAA Aviation, June 2015, in press.
[12] Weibel, R., Edwards, M., and Fernandes, C., “Establishing a risk-based separation standard for unmanned aircraft self separation,” 11th AIAA Aviation Technology, Integration, and Operations (ATIO) Conference, AIAA 2011-6921, September 2011.
[13] EUROCONTROL, “Specifications for the use of Military Remotely Piloted Aircraft as Operational Air Traffic Outside Segregated Airspace”, (MIL/MILT/UAV/06-2116 V2.0), February 2012.
[14] Cook, S. P., Brooks, D., Cole, R., Hackenburg, D., Raska, V., “Defining well clear for unmanned aircraft systems,” In Proceedings of AIAA Infotech @ Aerospace, AIAA 2015-0481, January 2015.
[15] Feitshans, G. L., Rowe, A. J., Davis, J. E., Holland, M., and Berger, L. “Vigilant spirit control station (VSCS)—‘The face of COUNTER’,” In Proceedings of AIAA Guidance, Navigation and Control Conference Exhibition, August 2008.
[16] Prevot, T. “Exploring the many perspectives of distributed air traffic management: The Multi Aircraft Control System MACS,” In Proceedings of the HCI-Aero (pp. 149-154), 2002, pp. 149-154. [17] Granada, S., Dao, A. Q., Wong, D., Johnson, W. W., and Battiste, V.
“Development and integration of a human-centered volumetric cockpit display for distributed air-ground operations,” In Proceedings of the 13th International Symposium on Aviation Psychology, 2005, pp. 279-284. [18] Santiago, C., Abramson, M., Refai, M., Mueller, E., Johnson, M., and
Snow, J. “Java architecture for detect and avoid (DAA) modeling and extensibility (JADEM),” NASA/TM-2015-TBD, 2015, unpublished. [19] Erzberger, H., Lauderdale, T. A., Chu, Y-C. “Automated conflict
resolution, arrival management, and weather avoidance for air traffic control,”Proceedings of the Institution of Mechanical Engineers, Part G: Journal of Aerospace Engineering, August 2012, vol. 226 no. 8, pp. 930-949.
AUTHOR BIOGRAPHY
Confesor Santiago is the co-project engineer for the Sense and Avoid/Separation Assurance Interoperability element of the UAS Integration in the NAS project at NASA Ames Research Center. He received his B.S. in Computer Science and M.S. in Electrical Engineering at Rowan University.
Eric Mueller has worked as a research aerospace engineer at NASA Ames Research Center since 2000 in the Aviation Systems Division. His research interests include air traffic automation systems, spacecraft handling qualities and UAS integration with the National Airspace System.