Matching Electricity Supply with Demand in Nigeria
By A. S. Sambo*Introduction
Electricity plays a very important role in the socio-economic and technological development of every nation. The electricity demand in Nigeria far outstrips the supply and the supply is epileptic in nature. The country is faced with acute electricity problems, which is hindering its development notwithstanding the availability of vast natural resources in the country. It is widely accepted that there is a strong correla-tion between socio-economic development and the availability of electricity.
The history of electricity in Nigeria dates back to 1896 when electricity was first produced in Lagos, fifteen years after its introduction in England. Despite the fact that its existence in the country is over a century, its development has been at a slow rate. In 1950, a central body was established by the legisla-tive council, which transferred electricity supply and development to the care of the central body known as the Electricity Corporation of Nigeria, now defunct. Other bodies like Native Authorities and Nigeria Electricity Supply Company (NESCO) have licenses to produce electricity in some locations in Nigeria. There was another body known as Niger Dams Authority (NDA) established by an act of parliament. The Authority was responsible for the construction and maintenance of dams and other works on the River Niger and elsewhere generating electricity by means of water power, improving and promoting fish brines and irrigation. The energy produced by NDA was sold to the Electricity Corporation of Nigeria for distribution and sales at utility voltages.
For over twenty years prior to 1999, the power sector did not witness substantial investment in in-frastructural development. During that period, new plants were not constructed and the existing ones were not properly maintained, bringing the power sector to a deplorable state. In 2001, generation went down from the installed capacity of about 5,600MW to an average of about 1,750MW, as compared to a load demand of 6,000MW. Also, only nineteen out of the seventy-nine installed generating units were in operation.
The Energy Commission of Nigeria (ECN) was established by Act No. 62 of 1979, as amended by Act No. 32 of 1988 and Act No. 19 of 1989, with the statutory mandate for the strategic planning and co-ordination of national policies in the field of energy in all its ramifications. By this mandate, the ECN is the government organ empowered to carry out overall energy sector planning and policy co-ordination. As part of its contribution to the resolution of the problems of the electricity sector along the line of its mandate, the ECN has been collaborating with the International Atomic Energy Agency (IAEA) under an IAEA regional project titled “Sustainable Energy Development for Sub-Saharan Africa (RAF/0/016)”.
The project entails capacity building for energy planning and the determination of the actual energy demand and the strategies for supply for each participating country over a 30-year time horizon. The implementation of the project requires the establishment of a Working Team (WT) and a Country Study Team (CST) both of which include the major public and private stakeholders in the energy sector of the country. The working team consists of technical experts that directly implement the project and reports to the CST, which serves as the steering committee for the project on a regular basis. Members of the WT were trained on the use of the IAEA models and have computed the Nigeria energy demand and supply projections covering the 2005-2030. The project involves the use of the following IAEA Energy Modelling tools:
• Model for the Analysis of Energy Demand (MAED)
• Model for the Energy Supply Strategy Alternatives and their General Environmental Impact (MESSAGE).
Energy Demand Projection
The energy demand projections were computed using MAED with the key drivers of energy demand, namely demography, socio-economy and technology. The application of MAED requires detailed in -formation on demography, economy, energy intensities and energy efficiencies. This in-formation is first assembled for a base year which is used as the reference year for perceiving the evolution of the energy system in the future. Selection of the base year is made on the basis of availability of data, assessment that the data are representative of the economic and
en-ergy situation of the country.
MAED allows the breakdown of the country’s final
* A. S. Sambo is Director General of the Energy
Commission of Nigeria. He may be reached at dg@energy.gov.ng
energy consumption into various sectors and within a sector into individual categories of end-uses in a consistent manner.
The breakdown helps in the identification of the social, economic and technical factors influencing each category of final energy demand. In modelling the Nigeria’s energy case, four economic scenarios were developed and used as follows:
Reference Scenario - 7% GDP Growth; High Growth Scenario - 10% GDP Growth; Optimistic Scenario I – 11.5% GDP Growth; and
Optimistic Scenario II – 13% GDP Growth (based on Presidential Pronouncement for the desire to be among the first 20 economies by 2020).
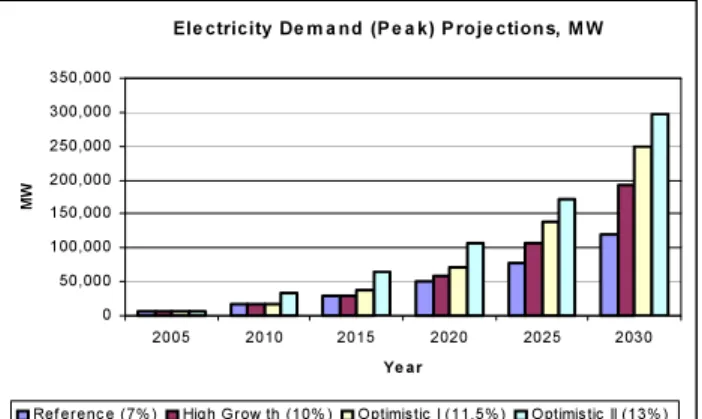
Economic growth and structure of the economy are the major driving parameters in the four scenarios. Projected electricity demand has been translated into demand for grid electricity and peak demand on the bases of assumptions made for T&D losses, auxiliary consumption, load factor and declining non-grid generation. Table 1 shows the electricity demand projections for the scenarios. It must be emphasized that the demand indicated for 2005
represents suppressed demand, due to inadequate generation, transmis-sion, distribution and retail facili-ties. Suppressed demand is expect -ed to be non-existent by 2010.
For the 13% GDP growth rate, the demand projections rose from 5,746MW in the base year of 2005 to 297,900MW in the year 2030
which translates to construction of 11,686MW every year to meet the demand. The corresponding cumulative invest-ment (investinvest-ment & operations) cost for the 25-year period is US$ 484.62 billion, which means investing US$ 80.77 billion every five years within the period. In conducting the studies, all the available energy resources in the coun-try were considered in order to broaden the nation’s energy supply mix and enhance its energy security.
Energy Supply Projection
The total energy supply were computed using MES-SAGE and utilizes the projected energy demand as an input to produce a supply strategy. MESSAGEis an energy sup-ply model, representing energy conversion and utilization processes of the energy system (or it’s part) and their en -vironmental impacts for an exogenously given demand of final energy. It is used for development of medium-term strategies, the planning horizon being in the order of 30 years. The time scope is limited due to uncertainties as-sociated with future technological development. The en-ergy system dynamics are modelled by a multi -period ap-proach. It is an optimisation model which from the set of existing and possible new technologies selects the optimal in terms of selected criterion mix of technologies able to cover a country’s demand for various energy forms during the whole study period.
MESSAGE takes into account demand variations of various final energy forms during the day, week and year, as well as different technological and political constrains
of energy supply. It is an energy and environmental impact model, enabling the user to carry out in-tegrated analysis of the energy sector development and its environmental impacts. The application of the MESSAGE model results in a least-cost inter-temporal mix of primary energy, energy conversion and emission control technologies for each scenario. For the computation of Nigeria’s Energy Supply
Scenario 2005 2010 2015 2020 2025 2030 Reference (7%) 5,746 15,730 28,360 50,820 77,450 119,200 High Growth (10%) 5,746 15,920 30,210 58,180 107,220 192,000 Optimistic I (11.5%) 5,746 16,000 31,240 70,760 137,370 250,000 Optimistic II (13%) 5,746 33,250 64,200 107,600 172,900 297,900 Presidential Pronouncement
Table 1 Electricity Demand Projections Per Scenario, MW
El e c tri c i ty D e m a n d (P e a k ) P r o j e c ti o n s, M W 0 5 0 , 0 0 0 1 0 0 , 0 0 0 1 5 0 , 0 0 0 2 0 0 , 0 0 0 2 5 0 , 0 0 0 3 0 0 , 0 0 0 3 5 0 , 0 0 0 2 0 0 5 2 0 1 0 2 0 1 5 2 0 2 0 2 0 2 5 2 0 3 0 Ye ar MW
Re f e r e n c e ( 7 % ) Hig h G r o w th ( 1 0 % ) O p timis t ic I ( 1 1 . 5 % ) O p t imis tic II ( 1 3 % )
Figure 1: Electricity Demand Projection
Electricity Supply Projection in Nigeria
0 50000 100000 150000 200000 250000 300000 2005 2010 2015 2020 2025 2030 Time (Year) MW Reference Growth High Growth Optimistic
the same scenarios that was used in MAED are used. The result for the electricity supply pro-jections is shown in table 2.
Available Resources for Electricity Generation in Nigeria
Nigeria is a country that is blessed with a lot of resources that can be used to generate electricity such as coal, natural gas, oil, hydro and other renewable energy sources.
Coal
Coal was first discovered in Nigeria in 1909. Coal mining in Nigeria began in 1916 with a recorded out -put of 24,500 tons. Production rose to a peak of 905,000 tonnes in the 1958/59 with a contribution of over 70% to commercial energy consumption in the country. Available data show that coal of sub-bituminous grade occurs in about 22 coal fields spread in over 13 States of the Federation. The proven coal reserves so far in the country are about 639 million tonnes while the inferred reserves are about 2.75 billion tonnes. Following the discovery of crude oil in commercial quantities in 1958 and the conversion of railway en-gines from coal to diesel, production of coal fell from the beginning of the sixties to only 52,700 tonnes in 1983 and contributed about 0.02% to commercial energy consumption in the country in 2001.
Nigeria’s coal can be utilized for power generation, steam production, in cement production and for brick making; as a heat source and reducing agent for steel production; as a domestic fuel; and a feed -stock for the production of chemicals, liquid fuels, gaseous fuels, batteries, carbon electrodes, etc. These potentials of coal need to be effectively harnessed into the country’s energy delivery system and export commodity mix through the development of a vibrant coal industry.
Oil
Oil exploration in Nigeria witnessed steady growth over the past few years. The nation had a proven reserve of 25 billion barrels of predominantly low sulphur light crude in 1999. This substantially in-creased to 34 billion barrels in 2004 and currently is about 36.5 billion barrels. The growth in reserves is attributable to improved funding of Joint Venture operations, timely payment of cash call arrears, intro-duction of an alternative funding scheme, the emergence of new prointro-duction sharing arrangements and the opening up of new frontier and deepwater / offshore blocks. Based on various oil prospects already identified especially in the deepwater terrain and the current (2006) development efforts, it is projected that proven reserves will reach about 40 billion barrels by year 2010 and potentially 68 billion barrels by year 2030. Oil production in the country also increased steadily over the years, however, the rate of increase is dependent on economic and geopolitics in both producing and consuming countries. Nigeria’s current producibility is about 2.4 million barrels per day even though actual production is averaging around 2.4 million barrels per day partly due to the problems in the Niger Delta and OPEC production restriction. Average daily production is projected to increase to 4.0 million barrels per day by 2010 and potentially to over 5.0 million per day in year 2030. However, these high potentials will be realized only with the adoption of high exploration strategic development policies and programmes covering the inland basins of Niger Delta, Anambra, Benin (Dahomey), Benue and Chad Basins, the offshore conti -nental shelves and deepwater offshore terrains.
In the downstream oil sub-sector, Nigeria has four refineries with a total installed capacity of 445,000 barrels per day and 5001 km network of pipeline from the refineries to 22 oil depots. The Federal Govern -ment also established petrochemical and fertilizer plants. The capacity utilization of these plants and facili-ties has been considerably low, due to the high level of decay arising from poor maintenance and operating conditions, under -funding, criminal vandalization especially on the pipelines, and the various companies’ lack of management autonomy for efficient operation. Consequently, annual domestic demand for petro -leum products is not fully met by internal production and has to be supplemented by imports.
Natural Gas
Nigeria’s proven natural gas reserves, estimated at about 187.44 trillion standard cubic feet in 2005, are known to be substantially larger than its oil resources in energy terms. Gas discoveries in Nigeria are incidental to oil exploration and production activities. Consequently as high as 75% of the gas produced was being flared in the past. However, gas flaring was reduced to about 36% as a result of strident efforts by the Government to monetize natural gas. Domestic utilization of Natural gas is mainly for power generation which accounted for over 80% while the remaining are in the industrial sector and very
neg-Scenario 2005 2010 2015 2020 2025 2030
Reference (7%) 6440 15668 28356 50817 77450 136879
High Growth (10%) 6440 15861 30531 54275 107217 192079
Optimistic I (11.5%) 6440 15998 31235 71964 177371 276229
ligible in the household sector. Given the current reserves and rate of exploitation, the expected life-span of Nigerian crude oil is about 44 years, based on about 2mb/d production, while that for natural gas is about 88 years, based on the 2005 production rate of 5.84 bscf/day.
New and Renewable Energy
Nigeria is endowed with abundant renewable energy resources, the significant ones being solar
energy, biomass, wind, small and large hydropower with potential for hydrogen fuel, geothermal and ocean energies. The estimated capacity of the main renewable energy resources is given in the Table 3.
Except for large scale hydropower which serves as a major source of electricity, the current state of exploitation and utilization of the renewable energy resources in the country is very low, limited largely to pilot and demonstration projects.
The main constraints in the rapid development and diffusion of technologies for the exploitation and utilization of renewable energy resources in the country are the absence of market and the lack of ap-propriate policy, regulatory and institutional framework to stimulate demand and attract investors. The comparative low quality of the systems developed and the high initial upfront cost also constitute barri-ers to the development of markets. Therefore, if the country is to unleash the enormous potential of its renewable energy resources on its drive to match electricity with demand and achieving the MDG’s and Vision 2020, these barriers must be eliminated through significant investment in critical areas of R&D, building of indigenous human and manufacturing capacities and the intensification of the on-going eco -nomic reform to create an investor friendly environment.
Electricity Supply Mix
Large hydro accounted for about 31.30% of grid electricity generation by 2005 while natural gas ac -counted for the balance of 68.30%. One of the objectives of the study done with MESSAGE under the auspices of the IAEA was to find the optimal mix of fuels for the diversification of electricity supply in Nigeria. In the study, seven different fuel types were used for the optimization. These are natural gas, large hydro, coal, nuclear, small hydro, solar, and wind. Oil was not considered to be very expensive and was not used in the optimization. The shares of the different power generation technologies in the total installed capacity for the Reference Case are shown in Table 4. It may be noted that the share of hydropower (large and small) in the total installed capacity will decrease from 31.30% in 2005 to about 11% in 2030, while the share of natural gas based power
capac-ity will increase from 68.30% in 2005 to 82.15% in 2010 and thereafter decrease to 62.95% in 2030. Coal and nuclear, which are not used for power generation at all at present, will account for 15.6 and 6.7% by 2030, respectively. Solar and wind are also projected to account for 8.3% and 1.8% respectively by 2030. The High Growth and Optimistic Scenarios follow similar sup-ply patterns.
Energy Efficiency and Conservation
Although energy conservation and efficiency is not a resource per se, it is acknowledged that its adop -tion in the country can significantly mitigate the supply challenge. It is in recogni-tion of this that the Federal Government of Nigeria recently approved the establishment of a National Centre for Energy Ef-ficiency and Conservation. The Centre, which will operate under the auspices of the Energy Commission of Nigeria, is situated at the University of Lagos, in the commercial nerve centre of Nigeria. The Centre is charged with the responsibility for organizing and conducting research and development in energy ef-ficiency and conservation. In this regard, the Centre shall carry out the following functions:
(i) develop guidelines for energy efficient end-use products and advise on their implementation; (ii) develop energy efficiency codes, standards and specifications for domestic, industrial and com
-ercial facilities;
(iii) gather, analyze and manage energy supply and consumption data and information;
(iv) serve as a Centre for training of high level manpower in energy efficiency and conservation; (v) develop and execute pilot/demonstration project highlighting energy efficiency concepts;
ENERGY SOURCE CAPACITY
Large Hydropower 11,250MW Small Hydropower 735MW
Solar Radiation 3.5 – 7.0 kWh/m2-day
Wind 2 – 4 m/s (annual average) at 10m height
Table 3 Nigeria’s Renewable Resource Estimate Source: Energy Commission of Nigeria; National Energy Masterplan
Fuel Type 2010 2015 2020 2025 2030 Coal 0.0 9.9 13.8 15.3 15.6 Gas 78.6 48.5 53.5 53.0 59.0 Hydro 21.3 18.9 13.6 10.7 8.6 Nuclear 0.0 9.4 5.3 8.3 6.7 Solar 0.1 13.1 11.0 10.4 8.3 Wind 0.0 0.1 2.9 2.3 1.8
Table 4 Future Installed Electricity Generation Capacity By Fuel (Reference Case), %
(vi) disseminate information on energy efficiency and conservation concepts through public aware -ness programmes such as seminars, workshops, publications, etc; and
(vii) perform any other functions, as may be directed by the Federal Government.
Conclusion
Estimated total investments to meet the demand for the Optimistic Growth Scenario is US$ 484.62 billion. The Federal Government alone cannot provide this level of funding.
Indeed, the state governments, private sector and foreign investors must be involved. Moreover, all the country’s energy resources need to be deployed in order to achieve matching supply with demand on a continuous basis.
References
Sambo, A. S., 2008. Paper presented at the “National Workshop on the Participation of State Governments in the Power Sector: Matching Supply with Demand”, 29 July 2008, Ladi Kwali Hall, Sheraton Hotel and Towers, Abuja.
Federal Ministry of Energy (Power Sector), 2008. Investment Opportunities in the Nigeria’s Power Sector.
International Atomic Energy Agency (IAEA), 2003. Model for Energy Supply Strategy Alternatives and their
General Environmental Impacts, MESSAGE – User Manual.
IAEA/ECN, 2007. Assessment of Energy Options and Strategies for Nigeria: Energy Demand, Supply and Environmental Analysis for Sustainable Energy Development (2000-2030).
ECN, 2007. National Energy Masterplan.
Applications must be received by CDS International no later than December 1, 2008. Program information and appli- cation forms can be down-loaded from the CDS website at: www.cdsintl.org/fromusa/ alfa.htm
For more information contact: CDS International, Inc. Alfa Fellowship Program 440 Park Avenue South, New York, NY 10016 Tel: (212) 497-3510 Email: alfa@cdsintl.org www.cdsintl.org
Promoting
Understanding
of Russia
Alfa-Bank and CDS International are pleased to announce a call for applications for the Alfa Fellowship Program’s 2009-10 Fellows. Now entering its seventh round, the Alfa Fellowship Program is a professional-level exchange designed to foster a new generation of American leaders and decision-makers with meaningful professional experience in Russia.
The Alfa Fellowship begins with language training in the U.S. followed by an intensive language course in Moscow. In October, Alfa Fellows will attend a two-week seminar program with key Russian government, public, and private sector officials to discuss current issues facing Russia. Fellows then undertake individualized professional assignments at leading organizations in Russia including private companies, media outlets, think tanks, NGOs, and government institutions.
Eligible candidates must have a graduate degree and professional experience in business, economics, journalism, law, government, or public policy. Russian language proficiency is preferred. The Fellowship includes monthly stipends, related travel costs, housing, and insurance.