University of Zurich Main Library Strickhofstrasse 39 CH-8057 Zurich www.zora.uzh.ch Year: 2019
Testing with Fewer Resources: An Adaptive Approach to
Performance-Aware Test Case Generation
Grano, Giovanni ; Laaber, Christoph ; Panichella, Annibale ; Panichella, Sebastiano
Abstract: Automated test case generation is an effective technique to yield high-coverage test suites. While the majority of research effort has been devoted to satisfying coverage criteria, a recent trend emerged towards optimizing other non-coverage aspects. In this regard, runtime and memory usage are two essential dimensions: less expensive tests reduce the resource demands for the generation process and later regression testing phases. This study shows that performance-aware test case generation requires solving two main challenges: providing a good approximation of resource usage with minimal overhead and avoiding detrimental effects on both final coverage and fault detection effectiveness. To tackle these challenges, we conceived a set of performance proxies -inspired by previous work on performance testing- that provide a reasonable estimation of the test execution costs (i.e., runtime and memory usage). Thus, we propose an adaptive strategy, called aDynaMOSA, which leverages these proxies by extending DynaMOSA, a state-of-the-art evolutionary algorithm in unit testing. Our empirical study -involving 110 non-trivial Java classes- reveals that our adaptive approach generates test suite with statistically significant improvements in runtime (-25%) and heap memory consumption (-15%) compared to DynaMOSA. Additionally, aDynaMOSA has comparable results to DynaMOSA over seven different coverage criteria and similar fault detection effectiveness. Our empirical investigation also highlights that the usage of performance proxies (i.e., without the adaptiveness) is not sufficient to generate more performant test cases without compromising the overall coverage.
DOI: https://doi.org/10.1109/TSE.2019.2946773
Posted at the Zurich Open Repository and Archive, University of Zurich ZORA URL: https://doi.org/10.5167/uzh-176230
Journal Article Accepted Version Originally published at:
Grano, Giovanni; Laaber, Christoph; Panichella, Annibale; Panichella, Sebastiano (2019). Testing with Fewer Resources: An Adaptive Approach to Performance-Aware Test Case Generation. IEEE transactions on software engineering:Epub ahead of print.
Testing with Fewer Resources:
An Adaptive Approach to Performance-Aware
Test Case Generation
Giovanni Grano, Christoph Laaber, Annibale Panichella, and Sebastiano Panichella
Abstract—Automated test case generation is an effective technique to yield high-coverage test suites. While the majority of research effort has been devoted to satisfying coverage criteria, a recent trend emerged towards optimizing other non-coverage aspects. In this regard, runtime and memory usage are two essential dimensions: less expensive tests reduce the resource demands for the generation process and later regression testing phases. This study shows thatperformance-awaretest case generation requires solving two main challenges: providing a good approximation of resource usage with minimal overhead and avoiding detrimental effects on both final coverage and fault detection effectiveness. To tackle these challenges, we conceived a set of performance proxies —inspired by previous work on performance testing— that provide a reasonable estimation of the test execution costs (i.e., runtime and memory usage). Thus, we propose an adaptive strategy, called aDynaMOSA, which leverages these proxies by extending DynaMOSA, a state-of-the-art evolutionary algorithm in unit testing. Our empirical study —involving 110 non-trivial Java classes— reveals that our adaptive approach generates test suite with statistically significant improvements in runtime (-25%) and heap memory consumption (-15%) compared to DynaMOSA. Additionally, aDynaMOSA has comparable results to DynaMOSA over seven different coverage criteria and similar fault detection effectiveness. Our empirical investigation also highlights that the usage of performance proxies (i.e., without the adaptiveness) is not sufficient to generate more performant test cases without compromising the overall coverage.Index Terms—Evolutionary testing, many-objective optimization, performance
✦
1
I
NTRODUCTIONFromWaterfalltoAgile, software testing has always played an essential role in delivering high-quality software [1]. In-tegrating automated test case generation tools [2, 3] in soft-ware development pipelines (e.g., in continuous software development (CD) [4]) could potentially reduce the time spent by developers writing test cases by hand [5]. Hence, research and industry have heavily focused on automated test generation in the last decade [6], mainly employing evo-lutionary search (e.g., genetic algorithms (GA)) to produce minimal test suites that satisfy some testing criteria [7].
While most of the research effort has been devoted to maximizing various code coverage criteria [2, 6, 8, 9], recent work showed that further factors need to be considered for the generation of test cases [10–13]. Specifically, recent research investigated additional factors such as data input readability [11], test readability [13, 14], test code qual-ity [15], test diversqual-ity [16], execution time [12], and memory usage [10]. An early attempt to reduce the resource demand of generated tests is the work by Lakhotia et al. [10]. The authors recast test data generation as a bi-objective problem where branch coverage and the number of bytes allocated in the memory are two contrasting objectives to optimize with Pareto-efficient approaches. Their results show that
• G. Grano and C. Laaber are with the University of Zurich, Switzerland
E-mail: {grano, laaber}@ifi.uzh.ch
• A. Panichella is with the Delft University of Technology, the Netherlands
E-mail: [email protected]
• S. Panichella is with the Zurich University of Applied Science,
Switzer-land. E-mail: [email protected]
multi-objective evolutionary algorithms are suitable for this problem. Following this line of research, other works also used multi-objective search to minimize test execution time [17] or the number of generated tests, used as a proxy for the oracle cost [18, 19].
While the aforementioned works showed the feasibility of lowering the cost (e.g., execution time) of the generated tests, they all pose two significant challenges on the full code coverage [19]. The first challenge stems from empirical results showing that combining coverage with non-coverage criteria is harmful to the final coverage compared to tradi-tional strategies that target coverage only [10, 15, 18, 19]. These approaches implement the classicone-branch-at-a-time (or single-target) approach, which consists of running bi-objective meta-heuristics (e.g., GA) multiple times, once for every code branch, while performance aspects are other dimensions to optimize for each branch separately. How-ever, recent studies [20–22] empirically and theoretically showed that single-target approaches are less effective and efficient than multi-target approaches (e.g., the whole suite approaches and many-objective search) in maximizing cov-erage. The second challenge to address regards how to inject test performance analysis into the main loop of multi-target strategies without incurring in a penalizing overhead.
Generated tests with lower resource demand might de-crease the cost of introducing test case generation into continuous integration (CI) pipelines. Hilton et al. [23] showed that acquiring hardware resources for self-hosted CI infrastructure is one of the main barriers for small com-panies when implementing CI policies: more performant tests would require fewer hardware resources, and therefore
testing in CI would be more cost-effective. Despite the theoretical benefits, the precise measurement of memory and execution time costs adds considerable overhead since it requires running each test case multiple times [24]. Con-sequently, there is aneed for approaches that minimize the test resource demand [19] without penalizing the final coverage nor the fault detection capability of generated tests.
We extend the current state-of-the-art by proposing a noveladaptiveapproach, called aDynaMOSA (Adaptive Dy-naMOSA), to address the two challenges described above. In designing our approach, we focus on (i) test execution time (runtime from now on), (ii) memory usage, (iii) code coverage, and (iv) fault detection capability as four rele-vant testing criteria in white-box test case generation. To tackle the second challenge, we explored recent studies in performance testing [25] and symbolic execution [26] that investigate suitable approaches to estimate the computa-tional/resource demands of test cases. In particular, we adopted three performance proxies —computable with low overhead— introduced by Albertet al.[26] for symbolic exe-cution. Besides, we developed four additional performance proxies that provide an indirect approximation of the test execution costs (i.e., runtime and memory usage). These proxies, obtained through instrumentation, measure static and dynamic aspects related to resource usage through a single test execution: the number of objects instantiated (for heap memory), triggered method calls, and executed loop cycles and statements (for runtime).
Recent work in the field explored alternative ways to integrate orthogonal objectives into the fitness function, which are based on the idea of using non-coverage aspects as a second-tier objective [15]. To address our first challenge, aDynaMOSA extends DynaMOSA [27] —the most recent many-objective genetic algorithm for test case generation— by using the performance proxies as second-tier objec-tives while code branches are the first-tier objecobjec-tives. aDy-naMOSA uses an adaptive strategy where the second ob-jective can be temporarily disabled in favor of achieving higher coverage values (which is the primary goal). We integrated an adaptive strategy in aDynaMOSA since our initial results show that when the second objective strongly competes with the primary one (i.e., coverage), which is the case for performance, an adaptive strategy is preferable to a non-adaptive approach [15].
To evaluate aDynaMOSA, we conduct an empirical study with 110 non-trivial classes from 27 open-source Java libraries to show the usefulness of aDynaMOSA compared to the baseline DynaMOSA in terms of branch coverage, runtime, memory consumption, and fault-effectiveness (i.e., mutation score). Our study shows that the test suites pro-duced with aDynaMOSA are significantly less expensive to run for 72% (for runtime) and 70% (for heap memory con-sumption) of the classes compared to DynaMOSA. Besides, aDynaMOSA achieves similar code coverage compared to DynaMOSA over seven different testing criteria. We demon-strate that the devised approach does not reduce the fault-effectiveness of the generated tests: aDynaMOSA achieves a similar or higher mutation score for ~75% of the subjects under tests.
Contributions. We summarize the main contributions of this work in the following:
• We propose a performance-score aggregating a set of
performance proxies with low overhead as an indirect approximation of the computational demand for a gen-erated test case.
• We devise an adaptive test case generation technique that leverage such performance proxies to optimize sec-ondary objectives orthogonal to code coverage, without any negative effect on the latter.
• We instantiate our approach to the problem of reducing theresourcedemand of generated test suites while main-taining high test coverage and fault detection capability.
• We show that the usage of performance proxies is not sufficient to achieve the best results. The key aspect of aDynaMOSA is its adaptive mechanisms that dy-namically enables or disables the second objective de-pending on whether search stagnation of the coverage criteria is detected or not.
Replication package. To enable full replicability of this study, we publish all the data used to compute the results and a runnable version of the implemented approach in a replication package [28].
2
B
ACKGROUND& R
ELATEDW
ORKLast decade witnessed extensive research on test data gen-eration [6, 7] aiming at generating tests with high code cov-erage, measured according to various code coverage criteria such as branch [29], statement [7], line, and method [8] cov-erage. Search-based algorithms —GAs in particular [30]— had a strong pull on the automation of such a task [6].
Proposed approaches can be categorized into two for-mulations:single-targetandmulti-target. In the former, evo-lutionary algorithms (or more general meta-heuristics) aim to optimize one single-coverage target (e.g., branch) at one time. The single targetbis converted into a single function (fitness function) measuring how close a test case (or a test suite) is to cover b[7]. The “closeness” to a given branch is measured using two white-box heuristics [7]: the approach leveland the normalizedbranch distance. Fraser and Arcuri were the first to propose a multi-target approach, which optimizes all coverage targets simultaneously in order to overcome the disadvantages of targeting one branch at a time [2]. In their approach, calledwhole test suite generation (WS), GAs evolve entire test suites rather than single test cases. The search is then guided by a suite-level fitness function that sums up the coverage heuristics (i.e., branch distances) for all the branches of the class under test (CUT). A later improvement over WS, calledarchive based whole suite approach(WSA), focuses the search on uncovered branches only and uses an archive to collect test cases reaching uncovered branches [20].
Many-objective search. Following the idea of targeting all branches at once, Panichella et al. [3] addressed the test case generation problem in a many-objective fashion proposing a many-objective genetic algorithm called MOSA. Different from WS (or WSA), MOSA evolves test cases that are evaluated using thebranch distanceandapproach levelfor every single branch in the CUT. Consequently, the overall fitness of a test case is measured based on a vector of n
objectives, one for each branch of the production code. Thus, the goal is finding test cases that separately satisfy the target
branches [3], i.e., tests T having a fitness score fi(T) = 0 for at least one uncovered branch bi. To focus/increase the selection towards tests reaching uncovered branches, MOSA proposes a new way to rank candidate test cases [31], calledpreference criterion. Formally, a test casexispreferred over another test y for a given branch bi (or x ≺bi y) iff fi(x) < fi(y) [3], i.e., its objective score is lower (main criterion). In addition, if the two test cases x and y are equally good in terms of branch distance and approach level for the branch bi (i.e., fi(x) = fi(y)), the shorter test is preferred (secondary criterion). In other words, the preference criterion promotes test cases that are closer to cover some branches if possible and have minimal length.
MOSA works as follows1: a starting population is
ran-domly generated and evolved through some generations. For each generation, new offsprings are created through crossoverandmutation. Then, the new population for the next generation is created by selecting tests among parents and offsprings as follows: a first frontF0of test cases is built by
using thepreference criterion. Following, the remaining tests are grouped in subsequent fronts using the traditional non-dominated sorting algorithm[32]. The new population is then obtained by picking tests starting from the first frontF0until
reaching a fixed population sizeM. To enable diversity and avoid premature convergence [16, 33], MOSA also relies on thecrowding distance, a secondary heuristic that increases the chances to survive in the next generation for test cases that are the most diverse within the same front. The final test suite is thearchive, an additional data structure that stores test cases that reach previously uncovered branches. If a new test t hits an already covered branch bi, t is stored in the archive if and only if shorter (secondary criterion) than the test case stored in the archive for the same branchbi.
Panichellaet al. [27] improved the MOSA algorithm by presenting DynaMOSA. Relying on the control dependency graph (CDG), DynaMOSA narrows the search towards the uncovered targets free of control dependencies. New targets are then iteratively considered when their dominators are satisfied. In particular, the difference between DynaMOSA and MOSA is the following: at the beginning of the search, DynaMOSA tries to hit only the targets free of any control dependencies. Therefore, at every iteration, the current set of targets U∗ is updated based on the execution results of the newly generated offsprings: beinguia newly hit target, the targets dominated byuiare added toU∗. This approach does not impact the way MOSA ranks the generated solu-tions, but rather speeds up the convergence of the algorithm, while optimizing the size of the current objects. Empirical results show that DynaMOSA performs better than both WSA and MOSA in terms of branch [8, 27], statement [27], and strong mutation coverage [27].
Recently, Panichella et al. [34] further improved Dy-naMOSA with the goal of maximizing different coverage criteria simultaneously (e.g., branch, line, and weak mu-tation coverage, at the same time). The latest variant of DynaMOSA relies on theenhanced control dependency graph (ECDG) enriched with structural dependencies among the testing targets. These objectives to optimize are dynami-cally selected using the ECDG while exploring the covered
1. See Algorithm 1 in [3] for full detail.
control dependency frontier incrementally. Empirical results show that even though the multi-criteria variant may result in few cases in a lower branch coverage than DynaMOSA, it reaches higher coverage on all the other criteria as well as showing better fault detection capability [34]. We use this many-criteria version of DynaMOSA both as a baseline and a starting point for implementing the proposed adaptive approach.
Large-scale studies. Campos et al. [22] and Panichella et al.[21] conducted two large-scale empirical studies com-paring different approaches and meta-heuristics for test case generation. Their results showed that: (1) multi-target approaches are superior to the single-target approaches, and (2) many-objective search helps to reach higher coverage than alternative multi-target approaches for a large number of classes. Besides, no search algorithm is the best for all classes under test [22]. These recent advances motivate our choice of focusing on many-objective search.
Non-coverage objectives. In recent years, several works focused on non-coverage aspects in addition to reaching high coverage. Lakhotia et al. proposed a multi-objective formulation optimizing branch coverage as primary and dynamic memory consumption as secondary objective [10]. Ferreret al.proposed a multi-objective approach aiming at simultaneously maximizing code coverage and minimizing oracle cost [19]. Afshanet al.focused on code readability as a crucial secondary objective to foster maintainability [35]. In particular, their approach generates readable string in-puts exploiting natural language models. Despite empirical research showed the difficulty of effectively balancing two contrasting objectives without penalizing the final code coverage [19], the mentioned studies all gave the same weight to coverage and non-coverage objectives. Further-more, these studies used a single-target approach rather than multi-target ones. Palomba et al. [15] incorporated test cohesion and coupling metrics as secondary objectives within the preference criterion of MOSA to produce more maintainable test cases, from a developer point of view. Their approach produces more-cohesive and less-coupled test cases without reducing coverage. More recently, Al-bunian [16] investigated test case diversity as a further objective to optimize together with coverage in WSA.
Our work. We propose aDynaMOSA, a novel test case generation algorithm that optimizes a secondary objective besides code coverage. Differently from most previous at-tempts of combining non-coverage with coverage objectives, aDynaMOSA relies on many-objective search. To balance the two orthogonal objectives, it adaptively enables or disables the optimization of the secondary objective when adverse effects on the code coverage are detected during the generation. In this work, we instantiate aDynaMOSA to focus on the performance —i.e., runtime and heap memory consumption— of generated tests. To achieve this goal, we utilize metrics approximating test case performance while having low analysis overhead (§ 3.1).
3
A
PPROACHThis section introduces the performance proxies, their ratio-nale, and how we integrated them in DynaMOSA.
3.1 Performance Proxies
The accurate measurement of software system performance is known to be challenging: it requires measurements to be performed over multiple runs to account for run-to-run variations [24]. This means that we would need to re-run each generated test case hundreds of times to have rigorous runtimes and memory usages. This type of direct measurement is unfeasible for test case generation, where each search iteration generates several new tests that are typically executed only once for coverage analysis.
While a direct measurement is unfeasible in our context, various test case characteristics can be used to indirectly estimate the cost (runtime and memory) of the generated tests. According to Jin et al.[36], about 40% of real-world performance bugs stem from inefficient loops, while uncoor-dinated method calls and skippable functions account for re-spectively one third and a quarter of performance bugs. Ob-ject instantiations impact theheap memoryusage [37], and the number of executed statements has been used in previous regression testing studies as a proxy for runtime [38]. Mul-tiple studies investigate the performance impact prediction in the context of software performance analysis [25, 39, 40], but to the best of our knowledge, no prior work combined it with evolutionary unit test generation.
The closest studies are the ones from De Oliveira et al. [25] and Albert et al. [26], which fit the context of this study. However, both studies leveraged only a subset of proxies investigated in this paper and focused on different testing problems and techniques. De Oliveira et al. [25] investigated performance proxies in the context of regres-sion testing. Albert et al.[26] proposed three performance proxies for symbolic execution and showed their benefits on example programs. Symbolic execution can be used as an alternative technique to generate test cases rather than GAs; however, it has various limitations widely discussed in the literature [41, 42], such as the path explosion problem, it cannot handle external environmental dependencies, and complex objects.
In this paper, we extend the set of performance proxies proposed in previous studies [26] and incorporate them within evolutionary test case generators in an adaptive fashion. We designed the performance proxies with the idea of estimating a test case’s performance (i.e., runtime and/or memory consumption) unobtrusively. We imple-mented two types of proxies: (i) Static proxies that utilize static analysis techniques such as AST parsing. (ii)Dynamic proxies that rely on the instrumentation facilities available in EVOSUITE[9]. We extract thecontrol flow graph(CFG) and the number of times each branch in the CFG is covered by a given testt (frequency). All production code proxies are dynamic while proxies related to the test code are static.
Table 1 summarizes the performance proxies. In the following, we describe them separately and discuss which dimension (memory or runtime) they affect.
Number of executed loops(I1). This counts the number
of loop cycles in the production code which are executed/-covered by a given test case t. Higher loop cycle counts influence the runtime of the test case. To this aim, at instru-mentation time, we use a depth-first traversal algorithm to detect loops in the CFG. When a test casetis executed, we
collect the number of times each branch involved in a loop is executed (execution frequency). Thus, the proxy value for
tcorresponds to the sum of the execution frequencies for all branches involved in loops. To avoid a negative impact on coverage, we require each loop to be covered at least once. Therefore, this proxy only considers loops with a frequency higher than one.
Number of method calls[26]. We implement two types of method call proxies: covered method calls (I2), which
is related to method calls in the paths of the CFG that are covered by a testt; andtest case method calls(I3), which
counts method calls int. Notice, the former proxy considers the number of calls to each production method (i.e., the frequency) rather than a single boolean value denoting whether a method has been called or not, as in method cov-erage [8]. This is because a method can be invoked multiple times by either indirect calls or within loops. Method calls directly impact the memory usage [43]: every time a method is invoked, a new frame is allocated on top of theruntime stack. Further, method calls are dynamically dispatched to the right class, which might influence the runtime. Thus, fewer method calls should result in shorter runtimes and lower heap memory usage due to potentially fewer object instantiations.
Number of object instantiations (I4). Objects
instanti-ated during test executions are stored on the heap. Thus, reducing the number of instantiated objects may lead to decreased usage of heap memory. The fourth proxy counts the number of object instantiations triggered by a test case
t. It analyzes the basic blocks of the CFG that t covers and increments a counter for every constructor call and local array definition statement. Notice that we consider the frequency (e.g., the number of constructor calls) rather than a binary value (i.e., called or not called). Moreover, the constructor call counter excludes calls and local array definitions with a frequency of one, as we want to cover them at least once. We do not consider the instantiated-object size as it would require more complex and heavier instrumentation. We also do not consider primitive data types which use memory as well, because their influence is negligible compared to objects [37].
Number of statements [26]. Statement execution fre-quency is a well-known proxy for runtime [38]. Similarly to the proxies for number of method calls, we implement two types of statement-related proxies:Covered statements (I5), which counts the statements in the production code
covered by a test case. This proxy utilizes the dynamically-computed CFG for counting the covered statements. Test case statements(I6), which corresponds to the number of
non-method-call statements in a generated test case. This number is statically determined by inspecting the abstract syntax tree of the test case.
Test case length (I7). This counts the LOC (size) of a
test case and therefore represents a superset of test case method calls (I7) and test case statements (I6). We include
this proxy for two reasons: First, it is a good performance proxy: longer tests mean more method and statement calls. Second, DynaMOSA uses test case length as a secondary objective in order to reduce the oracle cost [44]. Thus, we rely on the same metric to have a fair comparison.
TABLE 1
Description of the performance proxies ID Performance Proxy Description
I1 Number of Executed Loops Counts the number of loop cycles in the production code executed by a given testt
I2 Covered Method Calls Counts the number of times a method of the production code is called during the execution of a testt
I3 Test Case Method Calls Counts the number of methods calls contained in a testt
I4 Number of Object Instantiations Counts the number of objects (not primitive data type) instantiated during the execution of a testt
I5 Covered Statements Counts the number of statements of the production code executed running a testt
I6 Test Case Statements Counts the number of non-method-call statements in a testt
I7 Test Length Counts the lines of code (LOC) of a testt
3.2 Performance-Aware Test Case Generation
To successfully generate test suites with high target cov-erage and, at the same time, low computational require-ments, we incorporate the performance proxies, described in § 3.1, into the main loop of DynaMOSA [27]. We opt for DynaMOSA since it has been shown to outperform other search algorithms (e.g., WS, WSA, and MOSA) in branch and mutation coverage, positively affecting the test generation performance [27]. Additionally, its basic algo-rithm (i.e., MOSA) was used in prior studies to combine multiple testing criteria [15, 45]. Multiple approaches could be followed to this aim. One theoretical strategy consists of adding the performance proxies as further search objectives in addition to the coverage-based ones, merely following the many-objective paradigm of MOSA. This leads to a trade-off search between coverage and non-coverage objectives that is not meaningful in testing [15]. Test cases that reduce the memory usage but at the same time reduce the final coverage are of less interest. Therefore, considering coverage and non-coverage criteria as equally important objectives results in tests with decreased coverages [10, 16–19].
For these reasons, we investigate an alternative strategy where performance proxies are considered assecondary ob-jectiveswhile coverage is theprimary objective. At first, we ex-periment with the most straightforward possible approach, i.e., using the performance proxies as secondary criteria, as proposed in a prior study [15]. However, due to the negative impact of the proxies on the final coverage, we refine this strategy by using an adaptive mechanism that enables and disables the proxy usage depending on whether search stagnationis detected or not. We refer to this adaptive strategy as aDynaMOSA (AdaptiveDynaMOSA) (§ 3.2.2).
3.2.1 Performance-Score as Secondary Objective
We first integrate the performance proxies using the methodology proposed in a prior study [15]. This approach replaces the original secondary criterion of MOSA (test case length) with aquality scorebased on test method coupling and cohesion. Therefore, it uses the new secondary criterion in two points: (i) in thepreference criterionto build the first frontF0, selecting the test case with the lowestquality score
in the case many of them have the same minimum object value for an uncovered branch bi; and (ii) in the routine used to update thearchive.
In this first formulation, we adopt the same method-ology replacing the quality score with the performance-score computed for each test casetas follows:
performance-score(t) = X
Ik∈I
Ik(t)
Ik(t) + 1
(1) where I denotes the seven proxies described in § 3.1. To deal with different magnitudes, each proxy value Ik(t) is normalized in Equation 1 using the normalization function
f[Ik(t)] =Ik(t)/[Ik(t) + 1][7, 46].
A preliminary evaluation of this strategy showed that the performance proxies —i.e., even as a secondary criterion— lead to a dramatic reduction of branch cover-age. We observed that the performance proxies strongly compete with coverage, e.g., test cases that trigger fewer method calls likely lead to lower code coverage. For this reason, we devise a second approach called aDynaMOSA that overcomes this limitation. We include the preliminary approach’s results in the replication package [28].
3.2.2 Adaptive DynaMOSA (aDynaMOSA)
aDynaMOSA uses an adaptive mechanism to decide whether to (not) apply the performance proxies depending on the search improvements done during the generations. We devise this strategy because continuously selecting test cases with the lowest performance proxies value leads to reduced code coverage.
The pseudo-code of aDynaMOSA is outlined in Algo-rithm 1. We highlight in bold the modifications over the original DynaMOSA algorithm. aDynaMOSA first builds the ECDG (line 2 of Algorithm 1) as done in Dy-naMOSA [34]. The initial set of coverage targets (objectives) is selected using the ECDG [34] (line 4). Subsequently, an initial population of M test cases is randomly generated (line 5), and the archive is updated by storing tests that reach previously uncovered targets (line 6). In each itera-tion, aDynaMOSA updates the set of objectives to optimize based on to the test execution results [27, 34] (lines 6 and 10 of Algorithm 1). The while loop in lines 8-25 evolves the test cases until all the objectives are satisfied or the search budget is over [34]. New test cases (offsprings) are synthesized in line as done in DynaMOSA [34]: (i) selecting parents with a tournament selection, (ii) combining parents with a single-point crossover, and (iii) further mutating the generated offspring tests with theuniform mutation. Newly generated tests are executed against the CUT [34]. Besides, the corresponding objective scores [34] and performance proxy values are also computed at this stage.
Algorithm 1:aDynaMOSA Pseudo-Algorithm Input:B={τ1, ..., τm}: set of coverage targets of a program
Population sizeM
CDG=hN, E, si: control dependency graph of a program Result:A test suiteT
1 begin 2 φ←EXTEND-CDG(CDG, B) 3 i←0 4 B∗←ENTRY-POINTS(CDG, φ,B) 5 Pi←RANDOM-POPULATION(M) 6 Archive←PERFORMANCE-UPDATE-ARCHIVE(Pi,∅) 7 B∗←UPDATE-TARGETS(B∗, CDG, φ)
8 whilenot(search budget consumed) AND (B6=∅)do
9 Oi←GENERATE-OFFSPRING(Pi)
10 Archive←PERFORMANCE-UPDATE-ARCHIVE(Oi,Archive) 11 Hi←GET-SECONDARY-HEURISTIC(Oi,i) 12 B∗←UPDATE-TARGETS(B∗, CDG, φ) 13 F←PREFERENCE-SORTING(PiSOi, B∗) 14 Pi+1← ∅ 15 d←0 16 while|Pi+1|+|Fd| ≤Mdo 17 ifHiis crowding-distancethen 18 CROWDING-DISTANCE-ASSIGNMENT(Fd) 19 else 20 PERFORMANCE-SCORE-ASSIGNMENT(Fd) 21 Pi+1←Pi+1 S Fd 22 d←d+ 1 23 Sort(Fd) /* according to Hi */ 24 Pi+1←Pi+1 S Fd[1 : (M− |Pi+1|)] 25 i←i+ 1 26 returnT
Next, parents and offsprings are ranked into non-dominance fronts (line 13) using the preference sorting al-gorithm and non-dominated sorting algorithm as done in MOSA [3] and DynaMOSA [27]. The main difference be-tween aDynaMOSA and DynaMOSA lies in the secondary heuristic used to rank parent and offspring tests. In MOSA, the secondary heuristic is thecrowding distance, which pro-motes more diverse test cases within the same front. The crowding distanceis responsible for ensuring diversity among the selected tests [32], which is a critical aspect of evolution-ary algorithms [47]. A lack of diversity leads tostagnationin local optima [27, 47], which could reduce the probability to cover feasible branches.
In aDynaMOSA, we use both the crowding distanceand theperformance proxiesas secondary heuristics. aDynaMOSA uses the routine GET-SECONDARY-HEURISTIC (lines 11 and 17-20 of Algorithm 1) to decide which of the two alternative secondary heuristics to apply, which depends on whether search stagnation is detected or not. Algorithm 2 depicts the pseudo-code of the routine GET-SECONDARY-HEURISTIC. In the first generation, the default secondary heuristic is the one based on performance proxies (lines 2-5 of Algorithm 2). For the later generations, the secondary heuristic is chosen by (i) analyzing the current objective scores to detect stagnation and (ii) taking into account which heuristics were used in the previous generations. Stagna-tion is detected when no improvement is observed for all uncovered branches (lines 7-9), i.e., the fitness functions for all coverage criteria are unchanged over the last two generations. Then, two counters are used to keep track of how often (i.e., in how many iterations) stagnation was detected when either applying thecrowding distanceor using theperformance proxies. In case of stagnation, the algorithm selects a new secondary heuristic with the lowest stagna-tion counter (lines 11-18 of Algorithm 2). Otherwise, the
Algorithm 2:GET-SECONDARY-HEURISTIC Input:Qi: new offsprings;i: the current iteration;
B={τ1, ..., τm}: set of coverage targets of a program
Result:Hi: heuristic for the current generation 1 begin
2 ifi==0then
// Counters for generations with stagnation 3 performance-counter←0
4 crowding-counter←0
5 returnperformance-heuristic /* Initial heuristic */ 6 stagnation←TRUE
7 forb∈Bandbis not covereddo
8 ifbest objective value forbinQibetter than inQi−1then
9 stagnation←FALSE
10 ifstagnationthen
// Heuristic with the lowest stagnation counter 11 ifHi−1is performance-heuristicthen
12 performance-counter←performance-counter+1
13 else
14 crowding-counter←crowding-counter+1
15 ifperformance-counter≤crowding-counterthen
16 returnperformance-heuristic
17 else
18 returncrowding-distance
19 else
// Heuristic used in the previous iterations 20 ifHi−1is performance-heuristicthen
21 performance-counter←0
22 else
23 crowding-counter←0
24 returnHi−1
secondary heuristic for the current generationiremains the same as used in the previous iterationi−1(lines 20-24).
Once the secondary heuristic for the current iteration is selected, aDynaMOSA assigns a secondary score to every test case in each dominance front Fd (lines 18 and 20 of Algorithm 1) based on either the crowding distance or the performance proxies. If the employed secondary heuristic is the crowding distance, the secondary score of the tests cor-responds to the crowding distance scores computed using thesubvector dominance assignmentby Köppen et al. [27, 48]. Otherwise, if the performance proxies are selected for the secondary heuristic, the secondary score for each test caset
is computed as follows: performance-heuristic(t) = X Ik∈I Imax k (Fd)−Ik(t) Imax k (Fd)−Ikmin(Fd) (2) where Ik(t) is the value of the k-th proxy for the test t;
Imax
k (Fd)andIkmin(Fd)are the maximum and the minimum values of thek-th proxy among all tests in the frontFd. The performance-heuristic takes a value in [0; 7]; a zero value is obtained when the test case t has the largest (worst) proxy values among all tests within the same front Fd, i.e., ∀Ik, Ik(t) = Imin
k (Fd); a maximum value of seven (corresponding to the total number of proxies) is obtained whenthas the lowest (best) proxies values among all tests within the same front Fd, i.e., ∀Ik, Ik(t) = Imax
k (Fd). Therefore, higher values of the performance-heuristic are preferable.
Crowding distance and performance-heuristic are then used in lines 21 and 23 of Algorithm 1 to select test cases from the frontsF0-Fkuntil it reaches a maximum population size ofM. When thecrowding-distanceis used, more diverse tests within each front have a higher probability of being
se-lected for the next population. On the other hand, when the performance-heuristic is used, the tests with lower predicted resource demands are favored. Note, we update the archive based on the predicted performance of the executed test cases, The update of the archive works as follows: when a test casetsatisfies an uncovered branchbi,tis automatically added to the archive. Otherwise, if a new test t hits an already covered branchbi,tis added to the archive if and only if its performance-score (Equation 1) is lower than the score of the test case in the archive forbi. On the contrary, DynaMOSA employs thepreference-criterion.
4
E
MPIRICALS
TUDYOur empirical evaluation compares aDynaMOSA with Dy-naMOSA along three dimensions: (i) seven different cov-erage criteria (the default ones of EVOSUITE), (ii) fault detection effectiveness measured by strong mutation, and (iii) resource usage measured by runtime and heap mem-ory consumption. Therefore, we investigate the following research questions:
RQ1:(Effectiveness) What is the target coverage achieved by
aDynaMOSA compared to DynaMOSA?
We evaluate the seven default criteria that are available in EVOSUITEoptimized by aDynaMOSA via many-objective optimization. The criteria are: branch, line, weak mutation, method, input, output, and exception coverage [34, 45]. WithRQ1, we investigate whether and to what degree the
introduction of the performance proxies affects the target coverage of each criterion.
RQ2:(Fault Detection) What is the mutation score achieved by
aDynaMOSA compared to DynaMOSA?
The second research question extends the comparison between aDynaMOSA and DynaMOSA by focusing on fault detection. Tests generated using the proposed performance-aware approach might have a different structure (e.g., con-tain fewer statements and method calls). Therefore, we conduct a mutation-based analysis assessing whether op-timizing performance proxies impact the fault detection capability of the generated tests.
RQ3:(Performance) Does aDynaMOSA help to reduce test
runtimes and heap memory consumption?
The last research question investigates whether the ap-proach is able to generate tests with reduced resource usage. In particular, we investigate two dimensions: time, mea-suring runtime; and memory looking at the heap memory consumption of the generated tests.
For both RQ1 and RQ2, we also compare our approach with random search, which is a common baseline when using search-based techniques [49].
Prototype tool. We implemented aDynaMOSA in a pro-totype tool extending the EVOSUITE test suite generation framework, as explained in § 3.2. The source code of the pro-totype tool is available on GitHub.2All experimental results reported in this paper are obtained using this prototype tool. Moreover, a runnable version of the tool itself is available for download in the replication package [28].
2. https://github.com/giograno/evosuite
TABLE 2
Java Projects and Classes in Our Study
Project # Branches Mutants
Min Max Mean Min Max Mean
a4j 2 30 124 77 15 911 463 bcel 4 52 890 475 408 1,523 1,043 byuic 1 722 722 722 2,173 2,173 2,173 fastjson 10 20 2,880 564 36 13,152 2,078 firebird 3 90 194 131 347 441 392 fixsuite 1 32 32 32 110 110 110 freehep 6 48 160 92 112 807 297 freemind 1 170 170 170 2,427 2,427 2,427 gson 4 60 660 285 126 2,870 1,212 image 7 34 274 140 214 1,676 589 javathena 1 230 230 230 752 752 752 javaviewcontrol 2 212 2,360 1,286 2,058 4,972 3,515 jdbacl 2 170 174 172 595 700 648 jiprof 1 816 816 816 6,420 6,420 6,420 jmca 2 198 1,696 947 2,436 9,669 6,052 jsecurity 1 52 52 52 165 165 165 jxpath 3 98 102 100 204 449 312 la4j 7 20 280 135 196 3,217 1,122 math 4 14 238 92 135 1,274 443 okhttp 5 64 542 194 200 2,571 846 okio 9 24 562 126 34 4,271 1,009 re2j 8 68 646 178 148 2,096 1,129 saxpath 1 458 458 458 659 659 659 shop 4 38 182 102 175 465 302 webmagic 4 10 142 84 29 337 201 weka 10 212 778 359 255 13,263 2,220 wheelwebtool 7 24 804 331 75 3,898 1,637 Total 110 4.1 Subjects
Our benchmark consists of Java classes from different test benchmarks widely used in the SBST (Search-Based Soft-ware Testing) community: (i) the SF110 corpus [50], (ii) the 5thedition of the Java Unit Testing Tool Competition at SBST 2017 [51], and (iii) benchmarks used from previous papers about test data generation [3, 27]. The SF110 benchmark3
is a set of Java classes, extracted from 100 projects in the SourceForge repository [20, 52]. We randomly sampled Java classes from the benchmarks discarding the trivial ones [27], i.e., the classes having cyclomatic complexity below five. In total, we selected 110 Java classes from 27 different projects, having 29,842 branches and 139,519 mutants considered as target coverage in our experiment. Table 2 reports the characteristics of the classes grouped by project.
4.2 Experimental Protocol
We run DynaMOSA, aDynaMOSA, and random search for each class in the benchmark, collecting the resulting code coverage and mutation score. For this, the generated test cases/suite are post-processed in EVOSUITE: input data val-ues and method sequences are minimized after the search process terminates. More precisely, redundant statements that do not satisfy any additional coverage targets (e.g., branches) are discarded. These post-processing steps are applied for both search algorithms under study [2]. We set the maximum search time to 180 seconds [8]. Hence, the search stops either if the 100% coverage is reached or the time budget runs out. We set an extra timeout of 10 minutes at the end of the search for mutation analysis. We
use this budget because of the additional overhead required to re-execute each test case against the target mutants. To deal with the non-determinism of the employed algorithms, each run is repeated 50 times [8]. We adopt the default GA parameters used by EVOSUITE[2] since they provide good results [53].
We rely on the non-parametric Wilcoxon Rank-Sum Test [54] with significance levelα=0.05. We formulate three null hypotheses, one for each research question, i.e., that the compared algorithms achieve the same target coverage (RQ1), the same strong mutation coverage (RQ2), and the
same runtime and heap memory consumption (RQ3). p
-values<0.05 allow us to reject these null hypotheses. More-over, we rely on the Vargha-Delaney (A12ˆ ) statistic [55] to estimate the effect size of the differences between the achieved distributions. It has the following interpretation: for the coverage criteria and mutation score A12ˆ ≥ 0.50 when DynaMOSA—or the random search— achieves a higher coverage than aDynaMOSA whileA12ˆ <0.50 means the opposite. For runtime and memory consumptionA12ˆ ≥ 0.50 indicates that the suites generated by aDynaMOSA run faster or use less memory than the ones generated by DynaMOSA. Vargha-Delaney (A12ˆ ) statistic also returns a categorical estimation of the effect size values [55], with negligible, small, medium, andlargeas possible levels. Mutation-based analysis. To evaluate the fault detection effectiveness of aDynaMOSA, we rely on strong mutation analysis, due to several reasons: (i) Multiple studies showed a significant correlation between mutant detection and real-fault detection [56, 57]. (ii) Mutation testing is broadly recognized as an upscale coverage criterion [58], and it was shown to be a superior measure of test case effectiveness compared to other criteria [59, 60]. The underlying idea of mutation testing is the creation of modified versions of the original source code, calledmutants[61]. These changes are introduced in the production code bymutation operators, aiming to mime real faults [56]. (iii) Each test suite is run against the generated mutants and evaluated based on its mutation score,i.e., the ratio of killed (detected) mutants and the number of generated ones.
To perform our analysis, we rely on EVOSUITE’s built-in mutation engine [62], implementing eight different muta-tion operators,i.e.,Delete Call,Delete Field,Insert Unary Op-erator, Replace Arithmetic Operator, Replace Bitwise Operator, Replace Comparison Operator, Replace Constant, and Replace Variable. We opt for EVOSUITE’s engine for two reasons: First, it makes strong mutation analysis straightforward. Second, it was shown that the mutation scores computed by EVOSUITEare close to results on real-world software [62], which motivated recent works to rely on it [27, 34].
Performance measurement. To evaluate the performance, we compare the runtimes and heap memory usages of the test suites generated by DynaMOSA and aDynaMOSA. An ideal comparison would require measuring two identical test suites —for each subject and approach— in terms of branch coverage and statements executed. However, this is impossible in practice due to the algorithms’ randomness. To have a fair comparison, we conduct our performance analyses selecting the test suites with statistically equivalent branch coverage. We first select the
classes with no statistical difference (i.e., p-value>0.05) in branch coverage; and then for each subject and approach, we select the test suites with the median coverage over 50 runs for performance profiling and comparison. The median coverage was preferred over the average, because using the average coverage could results in slightly more diverse (i.e., incomparable) test cases in terms of actual coverage. To profile the performance of the test suites, we proceed as follows: We transform the source code files for performance measurements, compile the augmented versions, and run the test suites with the EVOSUITE standalone runtime. The transformer employs JavaParser4 for AST transformations. It adds for every test case a method before (@Before) and after (@After) its execution, which reports the current performance counters. These counters, as reported by Java’s MXBeans (RuntimeMXBean, MemoryMXBean, GarbageCollectorMXBean, and OperatingSystemMXBean), are: the current time stamp (in nanoseconds), the heap size (in bytes), the garbage collector (GC) count (number of garbage collections since the virtual machine started), and the GC time (in milliseconds). We executed the performance measurements on a bare-metal machine reserved exclusively for the measurements,i.e., without user-level background processes (exceptssh) running. The machine has a 12-core Intel Xeon [email protected] CPU with 70 GiB memory, runs ArchLinux with a kernel version 5.2.9-arch1-1-ARCH, and uses a Samsung SSD 860 PRO SATA III disk.
We execute and measure each test suite 1000 times (forks), in a fresh Java Virtual Machine (JVM), resembling the methodology proposed by Georgeset al.[63]. In a post-processing step, we compute the diffs for each test case and calculate the sum of all test cases to retrieve the overall performance (i.e., runtime and heap size) of each test suite. As heap memory diffs might be influenced by GC activity and therefore invalid, we replace the heap memory diff of affected methods with the median of the other forks’ valid results (i.e., not affected by GC activity).
5
R
ESULTS& D
ISCUSSIONThis section discusses the results of the study answering the research questions formulated in section 4. In the following, we will only refer to 109 classes since 1 class in our sample led to EvoSuite crashes caused by internal errors [27].
5.1 RQ1 - Effectiveness
Table 3 summarizes the code coverage achieved by random search, DynaMOSA, and aDynaMOSA according to the different coverage criteria. For each approach, we report (i) the mean coverage for each criterion over the 109 CUTs and (ii) the number of classes for which aDynaMOSA is statis-tically better, worse, or equivalent than random search and DynaMOSA, according to the Wilcoxon test. Furthermore, we discuss theA12ˆ effect size. Full results at the class level are reported in the replication package [28].
Table 3 compares DynaMOSA and aDynaMOSA. For branch coverage, the two algorithms are almost equivalent:
TABLE 3
Comparison between Random Search, DynaMOSA, and aDynaMOSA on the considered criteria
Criterion Average Coverage Random vs aDynaMOSA DynaMOSA vs aDynaMOSA
Random DynaMOSA aDynaMOSA #Better #Worse #No Diff. #Better #Worse #No Diff.
Branch 0.67 0.72 0.72 77 5 27 11 19 79 Line 0.71 0.76 0.77 80 2 27 16 17 76 Weak Mutation 0.71 0.77 0.78 91 0 18 15 15 79 Method 0.93 0.97 0.97 59 0 50 2 4 103 Input 0.55 0.83 0.83 103 0 6 16 11 82 Output 0.41 0.54 0.54 91 0 18 22 7 80 Exception 0.99 0.98 0.99 3 7 99 14 3 92
Branch Line Weak M.Method Input Output Excep.Strong M. criteria 0.0 0.2 0.4 0.6 0.8 1.0 coverage approach DynaMOSA aDynaMOSA Random
Fig. 1. Comparison of target coverage achieved by Random Search, DynaMOSA, and aDynaMOSA over 50 independent runs for the 109 studied subjects.
on average, they achieve the same coverage (i.e., ~72%) with a median of about 81% and 80%, respectively for aDynaMOSA and DynaMOSA. The latter is statistically significantly better for 19 out of 109 classes (~18%); over such classes, it achieves +2 percentage points (pp) in term of branch coverages. Vice versa, aDynaMOSA significantly outperforms DynaMOSA in 11 out of 109 classes (~10%) with an average difference of +3pp. For the vast majority of the subjects, (i.e., ~ 78%) there is no statistical difference between the two algorithms. Similar results can be observed for line and weak mutation coverage, where for the 70% and 72% of the subjects the two approaches do not show a statistically significant difference, respectively. aDynaMOSA only achieves on average +1pp for both line and weak mutation coverage over the entire set of classes: i.e., ~77% vs. ~76% and ~78% vs. ~77%, respectively for line and weak mutation coverage. For the remaining criteria,i.e., method, input, output, and exception, the number of subjects with no statistically significant difference increases, ranging from 73% to 94% of the CUTs. For only three classes, DynaMOSA covers more exceptions than aDynaMOSA. Overall, for none of the investigated coverage criteria we observe large differ-ences between DynaMOSA and aDynaMOSA.
Comparing branch coverage of aDynaMOSA and ran-dom search (Table 3), aDynaMOSA achieves on average +5pp over all the subjects. 77 out of 109 classes are
statis-tically significantly better (~70%), while only 5 out of 109 classes are worse. For 62 of these 77 subjects, the magni-tude of the difference is large. The largest improvement is obtained for ICSSearchAlgorith (weka project) where aDynaMOSA covers 31% more branches on average. We observe similar results for all other criteria but the exception coverage where random search is not statistically signifi-cantly different for 103 out of 109 subjects. aDynaMOSA achieves +6ppand +7ppfor line and weak mutation cover-age, respectively; while aDynaMOSA reaches +4pp for the method coverage criterion, it achieves +28ppand +13ppfor input and output coverage, respectively.
Figure 1 depicts an overview of the coverage scores achieved by the three approaches over the distinct criteria. It highlights that DynaMOSA and aDynaMOSA have similar distributions for the different target coverages. On the other and, except for the exception coverage, aDynaMOSA leads to larger coverage scores compared to the random search.
Finding 1.Across seven criteria, aDynaMOSA achieves sim-ilar levels of coverage compared to DynaMOSA, while both outperform random search.
5.2 RQ2 - Fault Detection
Figure 1 shows the distributions of the mutation scores (i.e., strong mutation coverage) using box-plots —on the extreme right, along with the other criteria— achieved by the approaches for the 109 subjects over 50 runs. We notice that the distributions of aDynaMOSA and DynaMOSA are similar: the former achieves +1ppmutation scores compared to the baseline. The medians of the distributions are ~33% and ~32%, respectively. Both approaches considerably out-perform random search which achieves a median of ~27%.
Table 4 reports the fine-grained results of strong mu-tation achieved by random search, DynaMOSA, and aDy-naMOSA. We report (i) the mutation scores averaged over the different projects and (ii) the number of cases in each project where aDynaMOSA is better, worse, or equivalent —according to the Wilcoxon test— compared to random search and DynaMOSA. We share the full results at class level in the replication package [28].
From Table 4 we observe that aDynaMOSA significantly outperforms random search in 95 out of 109 cases, corre-sponding to ~87% of all the CUTs. For these subjects, the test suites generated by aDynaMOSA achieve from +1ppto
TABLE 4
Mean mutation score achieved for each project
Project Classes Mutation Score Aˆ12Statistics
Random DynaMOSA aDynaMOSA aDynaMOSA vs Random aDynaMOSA vs DynaMOSA
#Better #Worse #No Diff. #Better #Worse #No Diff.
freehep 6 0.25 0.37 0.36 5 0 1 1 2 3 fastjson 10 0.28 0.36 0.35 10 0 0 1 2 7 weka 10 0.21 0.24 0.25 9 0 1 2 1 7 re2j 7 0.31 0.34 0.35 5 0 2 1 1 5 bcel 4 0.33 0.42 0.39 3 0 1 1 2 1 wheelwebtool 7 0.24 0.33 0.32 7 0 0 2 3 2 javathena 1 0.22 0.24 0.25 1 0 0 1 0 0 math 4 0.31 0.35 0.36 4 0 0 2 0 2 image 7 0.29 0.37 0.36 6 0 1 2 1 4 webmagic 4 0.40 0.43 0.44 3 0 1 0 0 4 jdbacl 2 0.37 0.44 0.43 2 0 0 0 1 1 okio 9 0.24 0.32 0.34 8 0 1 2 0 7 okhttp 5 0.28 0.34 0.34 5 0 0 0 1 4 shop 4 0.34 0.40 0.39 4 0 0 0 3 1 jsecurity 1 0.29 0.34 0.34 1 0 0 0 0 1 fixsuite 1 0.06 0.09 0.12 1 0 0 0 0 1 javaviewcontrol 2 0.12 0.16 0.15 2 0 0 0 1 1 byuic 1 0.08 0.11 0.10 1 0 0 0 1 0 gson 4 0.16 0.21 0.19 3 0 1 0 2 2 firebird 3 0.48 0.52 0.51 3 0 0 0 1 2 jxpath 3 0.51 0.55 0.57 3 0 0 1 0 2 a4j 2 0.24 0.19 0.27 1 0 1 2 0 0 jmca 2 0.19 0.29 0.28 2 0 0 0 0 2 freemind 1 0.19 0.21 0.25 1 0 0 1 0 0 la4j 7 0.25 0.33 0.34 3 0 4 0 0 7 saxpath 1 0.57 0.60 0.59 1 0 0 0 1 0 jiprof 1 0.06 0.13 0.13 1 0 0 0 0 1
Mean over projects 0.27 0.32 0.33
No. cases aDynaMOSA is better than Random 95 (87.16%)
No. cases Random is better than aDynaMOSA 0 (0.0%)
No. cases aDynaMOSA is better than DynaMOSA 19 (17.43%) No. cases DynaMOSA is better than aDynaMOSA 23 (21.1%)
+29pphigher mutation scores compared to the ones gener-ated by the baseline, with an average improvement of ~7%. In 78 out of these 95 cases, the magnitude of the difference is large. Random search is never significantly better than aDynaMOSA.
Comparing aDynaMOSA and DynaMOSA, in more than half of the cases (i.e., ~61%) there is no statistical difference between the mutation score of the two approaches, which is in line with what we observed in RQ1. For ~23% of the subjects, DynaMOSA scores a significantly higher in strong mutation. However, for about half of these cases (10 out of 23 subjects) the magnitude of the difference is small. The suites generated by DynaMOSA achieve from +0.3ppto +8pphigher mutation score, with an average improvement of ~3%. On the other hand, in ~17% of the subjects, aDy-naMOSA outperforms the baseline. In these, 19 out of 109, the suites generated by aDynaMOSA achieve from +0.8ppto +15pp(for the classProduct) higher mutation score, with a mean of ~4%.
In the few cases where aDynaMOSA performs worse than DynaMOSA, the difference is due to a slight difference in branch coverage. There is a direct relation between code coverage and fault effectiveness: if a mutant is not covered, it cannot be killed. For example, let us consider the class Parser from re2j, which has 667 branches and 501
mu-1 public class Parser {
2
...
3 private Regexp removeLeadingString(Regexp re, int n) {
4 // original code:
5 // if ((re.op == Regexp.Op.CONCAT) && (re.subs.length
== 0))
6 // mutant:
7 if ((op == Regexp.Op.CONCAT) && (subs.length > 0)) {
... }
8
...
9
}
Listing 1. The listing shows a mutant generated by EvoSuite’s mutation engine. While the suites generated by DynaMOSA are able to it, the mutant survives to the ones generated by aDynaMOSA.
tants. aDynaMOSA achieves 63.0% average branch coverage compared to 63.7% achieved by DynaMOSA. However, neither set of mutants killed by one of the two approaches is a subset of the other approach’s set. aDynaMOSA kills nine mutants not killed by DynaMOSA while DynaMOSA kills 18 mutants not killed by aDynaMOSA. Listing 1 shows an example of mutants killed by DynaMOSA only.
The mutant is injected into the firstifstatement of the private methodremoveLeadingString. Both approaches cover the statement through indirect method calls; however, only the test cases produced with DynaMOSA are able to kill the mutant. The reason for this is that the if-condition requires to instantiate an object of classRegexpwith proper attributes op and subs. This can be done by invoking
additional methods ofRegexp. aDynaMOSA is designed to reduce the number of method calls (to reduce heap memory consumption); therefore, in some runs, it generates tests without setting the input objectre. This example suggests that there is room for further improvement of aDynaMOSA by handling method calls differently, depending on whether they are required for fixture or for exercising the CUT behavior.
Finding 2.aDynaMOSA achieves similar levels of mutation score compared to DynaMOSA, while both outperform random search.
5.3 RQ3 - Performance
In this section, we compare the runtime and heap memory consumption of the test suites generated by aDynaMOSA and DynaMOSA. Recall that we restrict this analysis to the CUTs with no statistical difference in branch coverage (see § 4.2); thus, we pick the suite with the median coverage for each subject.
Table 5 summarizes the performance results of the suites generated by the two approaches, aggregated by project. We first discuss the cases where aDynaMOSA outperforms DynaMOSA. Table 5 shows that the test suites generated by aDynaMOSA have a shorter runtimes in about 72% of the cases. For these suites, runtime decreases on average by ~24% (with a median of ~13%), ranging from -1ppto -79pp (for the class JSONArray). Regarding heap memory con-sumption, aDynaMOSA outperforms DynaMOSA for ~70% of the classes. Among these subjects, the suites generated by aDynaMOSA show a ~15% decrease in heap memory consumption (with a median of ~11%), ranging from -1.6pp to -86pp(for the classJSONArray).
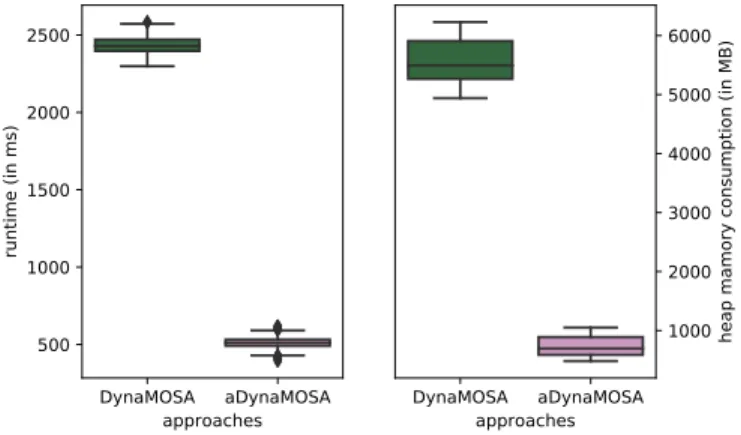
Figure 2 shows the example of the class JSONArray, plotting the runtime and heap memory consumption dis-tributions over 1000 independent runs of the generated suites by DynaMOSA and aDynaMOSA. The two profiled suites achieve similar levels of coverage over the seven different criteria. However, the median runtime is ~511 mil-liseconds (ms) for aDynaMOSA versus ~2,429 ms for Dy-naMOSA, while the median heap memory consumption is ~694 megabyte (MB) for aDynaMOSA versus ~5,429 MB for DynaMOSA.
To have a fair performance analysis, we compare test suites achieving the closest —ideally identical— branch coverage (see § 4.2). However, due to intrinsic randomnesses of GAs, this is practically infeasible. Thus, we extend our analysis by looking at the differences in code coverage for the cases in which the suites generated by aDynaMOSA show lower resource demands than the ones generated by DynaMOSA. The goal is to verify whether the decreased runtime (or heap memory consumption) is caused by tests having lower code coverage, which may result in fewer statements being executed. Despite faster runtime and lower memory consumption, this analysis showsthere is no decrease on any target criterion. This is evident if we look at the median and the mean of differences in branch and line coverage achieved by the two approaches. The mean of the differences is below 1% —0.5% and 0.8%, respectively for branch and line coverage— while the median of the differences is exactly 0.0% for both the criteria.
DynaMOSA aDynaMOSA approaches 500 1000 1500 2000 2500 runtime (in ms) DynaMOSA aDynaMOSA approaches 1000 2000 3000 4000 5000 6000
heap mamory consumption (in MB)
Fig. 2. Comparison of runtime and heap memory consumption for the suite generated by DynaMOSA and aDynaMOSA for theJSONArray
class over 1,000 independent runs.
Branch Line Weak M. Strong M.
criteria 0.2 0.4 0.6 0.8 coverage approach DynaMOSA aDynaMOSA
Fig. 3. Coverage scores achieved by the test suites generated by the two approaches for the CUTs where DynaMOSA shows better performance than aDynaMOSA.
Finding 3.The suites generated by aDynaMOSA have lower runtimes and heap memory consumption, respectively, for ~72% and ~70% of the subjects while achieving the same levels of code coverage.
Regarding the CUTs where the test suites generated by DynaMOSA have better performance than the ones generated by aDynaMOSA: Table 5 shows that the suites generated by DynaMOSA outperform the ones generated by aDynaMOSA in ~22% of the (negative) cases. For these sub-jects, the runtime of DynaMOSA decreases on average by ~20%, ranging from -0.5ppto -48pp(for the classJSTerm). Similarly, the test suites generated by DynaMOSA show lower heap memory consumption for ~24% of the cases, with a decrease ranging from -0.2pp to -39pp (for the class JSONLexerBase).
To understand the reason of these few negative results, we analyze the code coverage achieved by both approaches. Figure 3 shows the branch and line coverage and weak and strong mutation score distributions achieved for the subjects where DynaMOSA produces more performant tests. Al-though aDynaMOSA generates suites with inferior perfor-mance it reaches higher code coverage, i.e., +4ppbranch and
TABLE 5
Mean runtime and memory consumption achieved for each project
Project Classes Runtime (in ms) Memory Consumption (in) A12ˆ Statistics
DynaMOSA aDynaMOSA DynaMOSA aDynaMOSA Runtime Memory Consumption #Better #Worse #No Diff. #Better #Worse #No Diff.
jmca 2 130.87 155.12 590.46 607.21 1 1 0 1 1 0 jdbacl 1 14.32 2.28 2.84 5.68 0 0 1 0 0 1 javaviewcontrol 1 169.81 112.79 244.47 204.48 1 0 0 1 0 0 jsecurity 1 552.76 490.33 392.03 349.12 1 0 0 1 0 0 freemind 1 781.37 1,188.46 305.05 384.81 0 1 0 0 1 0 shop 3 57.18 75.42 285.34 281.42 2 1 0 2 1 0 bcel 1 91.87 84.41 568.01 488.62 1 0 0 1 0 0 a4j 1 49.26 48.75 22.78 22.83 1 0 0 0 0 1 firebird 2 83.36 50.27 270.44 235.88 2 0 0 2 0 0 fastjson 7 444.47 174.20 1,129.95 515.34 6 1 0 4 3 0 webmagic 2 121.20 172.61 281.55 258.76 1 1 0 1 1 0 okio 7 125.32 105.05 524.28 456.86 4 2 1 7 0 0 math 2 295.59 286.86 181.71 177.68 1 1 0 1 1 0 image 5 53.51 50.62 290.56 261.89 3 2 0 4 1 0 jxpath 2 126.13 66.42 196.70 191.80 2 0 0 1 1 0 gson 2 72.53 45.51 199.58 178.30 2 0 0 2 0 0 freehep 4 229.75 172.33 152.33 136.53 4 0 0 3 1 0 la4j 6 215.93 164.51 238.67 226.45 6 0 0 4 1 1 re2j 4 50.12 48.81 262.36 254.76 2 2 0 3 1 0 okhttp 2 49.18 45.46 129.87 125.13 1 1 0 2 0 0 weka 1 0.49 389.94 0.00 92.30 0 0 1 0 1 0
Mean over projects 176.91 187.15 298.52 259.8 41 (71.93%) 13 (22.81%) 3 (5.26%) 40 (70.18%) 14 (24.56%) 3 (5.26%)
+9pp line coverage. Each suite generated by aDynaMOSA contains 17 tests more on average than the ones generated by the baseline (154 vs. 137). This indicates that the suites generated by aDynaMOSAexecute more production code, thus, executing more statements, resulting in higher resource demands.
Recall that we profile the test suites with the median branch coverage for the subjects that do not show statisti-cally significant differences (i.e.,p-value>0.05) (see § 4.2). This allows for fair profiling and comparison of test suites with similar code coverage. However, with a significance level of0.05, we include subjects in the performance anal-ysis that show marginal statistical significance (i.e., 0.05
< p-value < 0.1) in branch coverage. Consequently in these cases, we select and profile test suites with a non-negligible difference in code coverage. In our analysis, we observe a marginal statistical difference in branch coverage for ~60% of the CUTs where the baseline outperforms aDynaMOSA in resource usage. A representative example is the class JSONLexerBase, which has the worst heap memory consumption achieved by aDynaMOSA compared to the baseline. However, this generated suite achieves +5pp branch coverage and contains 34 more test cases on average. Finding 4. The suites generated by aDynaMOSA have slower runtimes and higher heap memory consumption for ~22% and ~24% of the subjects, respectively. However, in these cases they achieve higher code coverage and contain more test cases.
5.4 Discussion
Listing 2 depicts two test cases for the class
GaussianSolver(from la4j) generated by DynaMOSA and aDynaMOSA. The test case generated by the former is the one with both slower runtime and higher heap memory consumption having about 39ms and 38MB on average over 1000 runs. First, it creates a Matrix with a diagonal and size equal to 1349 (line 3 of Listing 2). Second,
it creates an object of the class SparseVector with size and capacity equal to 1349 (line 4 of Listing 2). Thus, it instantiates an object of the class GaussianSolver from the matrix above (line 5 of Listing 2). Finally, it executes the methodsolvethat solves the corresponding linear system (line 6 of Listing 2). The test generated by aDynaMOSA for the same class builds the GaussianSolver using a very small matrix (line 13 of Listing 2). Similarly, a smaller SparseVectoris then instantiated in line 14 of Listing 2. At the end, thesolvemethod is again called to solve the linear system (line 16 of Listing 2).
Despite implementing a similar behavior, the test gen-erated by DynaMOSA runs almost 20 times slower (and using 8 times more heap memory) —on average over the 1000 runs— than the one generated by aDynaMOSA. This improvement is due to a better input value selection for the methods directly or indirectly invoked by the generated tests. While the algorithm has no direct control over this selection, the selective pressure applied by the performance proxies favors the individuals with better inputs —from a performance perspective— that randomly appear in the population. For this reason, we expect aDynaMOSA to be particularly more effective in scenarios where the input space is not trivial (i.e., most inputs are primitive values and the CUT does not handle large arrays or objects). Need for an adaptive approach.As explained in § 3.2, we considered an adaptive approach that disables/enables the performance heuristics depending on whether the search stagnates, i.e., there is no improvement in the objective values for subsequent generations. To provide empirical ev-idence for the need for an adaptive approach, we conducted an additional study by running aDynaMOSA and disabling the GET-SECONDARY-HEURISTIC procedure (see § 3.2): i.e., the algorithm always uses the heuristic based on the per-formance proxies. Our results show the expected decrease in code coverage: for branch coverage, the non-adaptive version of aDynaMOSA achieves on average -18pp in 52 out of 109 cases (~48%). On the contrary, DynaMOSA never