Durham Research Online
Deposited in DRO: 30 October 2015
Version of attached le: Published Version
Peer-review status of attached le: Not peer-reviewed
Citation for published item:
Jones, O. and Wardle, R. and Matthews, P.C. (2014) 'Micro-CHP Trial Report.', Technical Report. Northern Powergrid (Northeast) Limited, Newcastle upon Tyne.
Further information on publisher's website:
http://www.networkrevolution.co.uk/project-library/micro-chp-trial-report/ Publisher's copyright statement:
Additional information:
Use policy
The full-text may be used and/or reproduced, and given to third parties in any format or medium, without prior permission or charge, for personal research or study, educational, or not-for-prot purposes provided that:
• a full bibliographic reference is made to the original source • alinkis made to the metadata record in DRO
• the full-text is not changed in any way
The full-text must not be sold in any format or medium without the formal permission of the copyright holders. Please consult thefull DRO policyfor further details.
Durham University Library, Stockton Road, Durham DH1 3LY, United Kingdom Tel : +44 (0)191 334 3042 | Fax : +44 (0)191 334 2971
Copyright Northern Powergrid (Northeast) Limited, Northern Powergrid (Yorkshire) Plc, British Gas Trading Limited, University of Durham and EA Technology Ltd, 2014
Customer-Led Network Revolution
Micro-CHP Trial Report
DOCUMENT NUMBER CLNR-L086
AUTHORS
Owain Jones, UCL Energy Institute, University College London
Robin Wardle & Peter Matthews, Durham Energy Institute, Durham University ISSUE DATE
1
Copyright Northern Powergrid (Northeast) Limited, Northern Powergrid (Yorkshire) Plc, British Gas Trading Limited, University of Durham and EA Technology Ltd, 2014
Contents
1 Executive Summary ... 2
2 Introduction and Objectives ... 4
3 Data Availability ... 5
4 Data Processing ... 8
5 Data Analysis ... 9
5.1 Total Consumption, Production and Import ... 9
5.2 Demand, Production and Import profiles ... 12
5.3 Comparison against other research ... 17
5.4 Further Analysis ... 19
6 Conclusions ... 25
2
Copyright Northern Powergrid (Northeast) Limited, Northern Powergrid (Yorkshire) Plc, British Gas Trading Limited, University of Durham and EA Technology Ltd, 2014
1
Executive Summary
Test Cell 4 of the CLNR project is comprised of 11 domestic locations where micro-CHP units have been installed. This report presents an analysis of the performance of these domestic micro-CHP devices, and will address Learning Objective 1 of the CLNR project, which is to enhance understanding of current, emerging and possible future customer (load and generation) characteristics. The technology installed is a Baxi Ecogen Stirling engine, with a maximum heat output of 6kW, a maximum electrical output of 1kW, and an overall efficiency of 90% [1], producing a heat to power ratio of 6:1, an electric efficiency of 13%, and a heat efficiency of 77%.
In each location, two parameters were monitored: the electrical demand from and generation produced by the micro-CHP engine; and the amount of electricity imported (or exported) from the grid by the house as a whole. Both were measured in average watts per measured interval, with measurements taken every minute. Trial monitoring began in December 2012 and ended in March 2014. Trial monitoring data was provided by British Gas.
The analysis in this report focuses on two areas; the economic and carbon savings of the micro-CHP and the operating profile of the micro-CHP and thus the potential impact on distribution networks.
For analysis of the carbon savings, two values for carbon intensity of grid electricity were used; an average value of 450g CO2/kWh, and a marginal value of 780g CO2/kWh. The carbon savings for each property range from 3% to 12%, against average grid intensity, and 7% to 30% against marginal carbon intensity. In both cases the savings increase logarithmically with the heat-to-power ratio of the properties. The annual savings that result from the micro-CHP are calculated assuming a generation tariff of 13.24p/kWh, and an export tariff of 4.77p/kWh [2]. The annual savings are summarised in table 2. The values are in the range £96 to £378, with an average value of £217. The value of the total savings does not correlate with either the heat-to-power ratio or the total micro-CHP production. Additionally, given that micro-CHP units cost around £9000 (£4000-£5000 after trial subsidies), this would indicate that, at current prices, micro-CHP would require around 40 years of operation in order to break even.
The micro-CHP generation profile has a high morning peak, and a lower, but longer evening peak, with the summer peaks being lower than the winter ones. The main effect of the micro-CHP is to reduce the evening electricity demand peak by a few hundred watts. The micro-CHP unit also creates electricity export in the morning, because the micro-CHP export peak tends to occur before morning electricity demand starts to rise. There is a sharp export peak at around 5-7am, of about 500W, which is present even in summer (though at a slightly lower value). While the reduction of the evening peak would probably be beneficial from a network viewpoint, the morning export peak could become a source of voltage rise in areas with sufficient deployment of micro-CHP because it occurs at a time when demand will be low across the network.
Further analysis of network impact involved examining the effect of micro-CHP on electricity import for the two half-hour periods of the year with the highest demand, and an examination of the generation and import profiles of the two days of highest demand (averaged over all locations).
3
Copyright Northern Powergrid (Northeast) Limited, Northern Powergrid (Yorkshire) Plc, British Gas Trading Limited, University of Durham and EA Technology Ltd, 2014
The two half-hour periods of highest demand tended to be in either December or January. In most cases the presence of micro-CHP reduced the demand by a few hundred watts, though there were a few locations where demand is not reduced at all, or is even increased slightly. There are also a few occasions where the presence of micro-CHP shifts the peak half hour import by an hour or two (i.e. the presence of micro-CHP causes the half hour of highest import to be at a different time to the half hour of highest demand). The micro-CHP reduces the peak demand by between -4% and 22%, with an average reduction of 5%.
The two days of, on average, highest energy demand were 25/12/13 with 22.96kWh of consumption and 05/01/14 with 22.73kWh of consumption. The presence of micro-CHP reduces the demand on these days to 16.1kWh and 16.5kWh respectively. The demand profile for the day of highest demand is quite different from the other demand curves seen in the analysis. This change is almost certainly due to the fact that it is Christmas Day, where behaviours are different from the norm. On this day there is a smaller reduction in the peak electricity demand which occurs at midday (rather than in the evening) when heat demand is low, the evening demand is still reduced by a few hundred watts. The demand profile for the second biggest demand day is quite similar to the other demand profiles that the data has generated (i.e. reduction in evening peak, export in early morning).
Some further analysis involved examining the potential effects of fuel cell micro-CHP, and examining what would happen with a combination of solar and micro-CHP generation.
Fuel cell operation profiles were estimated from the Stirling engine micro-CHP profiles. The fuel cells exhibited distinctly larger carbon and economic savings, and also larger impacts on the networks, with much more reduction to the evening peak and very high early morning export. Both of these effects could be modified by changing the operating strategies of the fuel cells.
The combination with solar generation was achieved by taking solar generation data from another CLNR field trial, and combining it with the micro-CHP generation data. The solar generation has a much bigger impact than micro-CHP in summer; however micro-CHP can play an almost equivalent role in the other seasons. Overall, the combination of the two results is consistent export during the day, at quite high levels.
4
Copyright Northern Powergrid (Northeast) Limited, Northern Powergrid (Yorkshire) Plc, British Gas Trading Limited, University of Durham and EA Technology Ltd, 2014
2
Introduction and Objectives
Test Cell 4 of the CLNR project is comprised of 11 domestic locations where micro-CHP units have been installed. This report presents an analysis of the performance of these domestic micro-CHP devices, and will address Learning Objective 1 of the CLNR project, which is to enhance understanding of current, emerging and possible future customer (load and generation) characteristics. The technology installed is a Baxi Ecogen Stirling engine, with a maximum heat output of 6kW, a maximum electrical output of 1kW, and an overall efficiency of 90% [1], producing a heat to power ratio of 6:1, an electric efficiency of 13%, and a heat efficiency of 77%.
In each location, two parameters were monitored: the electrical demand from and generation produced by the micro-CHP engine; and the amount of electricity imported (or exported) from the grid by the house as a whole. Both were measured in average watts per measured interval, with measurements taken every minute.
The study objectives are to analyse the electrical output of the micro-CHP devices and how this affects the household consumption, with a view to characterising micro-CHP for the purposes of informing low- and medium-voltage distribution network design. Seven specific objectives have been identified:
1. Provide whole house total electricity consumption data. 2. Provide a whole house half-hourly consumption profile. 3. Provide total electricity generation of the micro-CHP engine. 4. Provide half-hourly generation profiles for the micro-CHP device.
5. Understand the peak power requirement, identify the half-hour of the year with the highest power requirement, and the day of the year with the highest overall power requirement and examine the effect of micro-CHP on these.
6. Examine how much of the micro-CHP produced electricity is used in the household and how much is exported.
5
Copyright Northern Powergrid (Northeast) Limited, Northern Powergrid (Yorkshire) Plc, British Gas Trading Limited, University of Durham and EA Technology Ltd, 2014
3
Data Availability
Trial monitoring began in December 2012 and ended in March 2014. Trial monitoring data was provided by British Gas. Two parameters were monitored at each location. The electrical consumption and generation of the micro-CHP engine, and the amount of electricity imported (or exported) from the grid by the house as a whole. The data captured was 1 minute data measured in Watts.
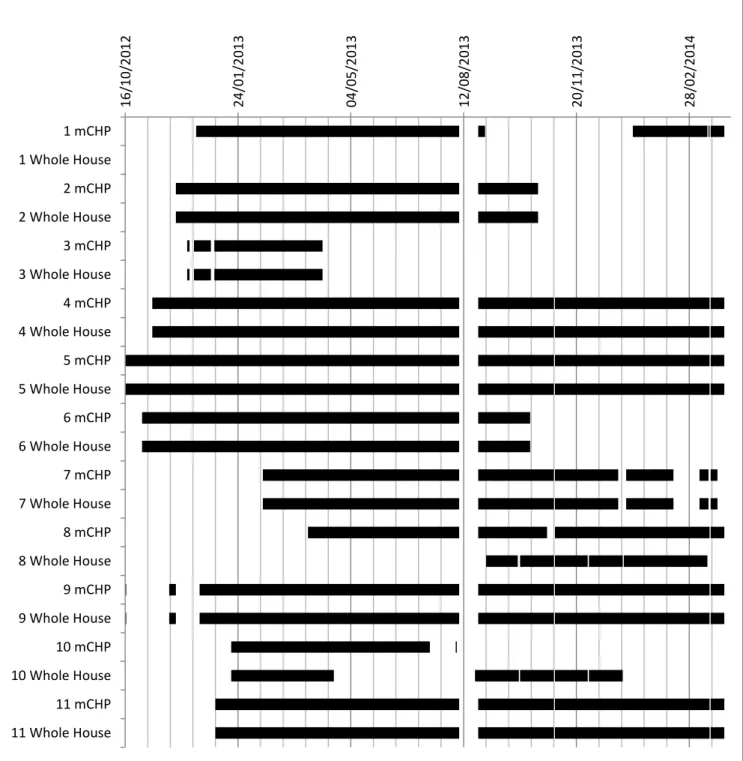
Data completeness was varied across the 11 locations, and as such a full data set for all 11 locations is unavailable. Figure 1 summarises the availability of the two parameters of data for each of the locations over the time period, with each location labelled by a number between 1 and 11.
Referring to the chart in Figure 1, it can be seen that one of the locations (1) does not have any whole house import data. Most of the other locations have data for varying periods between November 2012 and March 2014. Some locations have notably less data than others, such as 3 and 10, and on closer inspection, a substantial amount of the data is missing, with data for these locations being 79% and 33% complete respectively. Due to the incompleteness of the data, these locations have been excluded from the analysis. Location 9 appears to have large amounts of regular export, of about 2kW, presumably from a solar PV installation. This data was also excluded from the analysis, as it is not possible to dissagregate the PV and Stirling micro-CHP data. Multiple LCT installations are not considered for this analysis and so this location has also been disregarded.
6
Copyright Northern Powergrid (Northeast) Limited, Northern Powergrid (Yorkshire) Plc, British Gas Trading Limited, University of Durham and EA Technology Ltd, 2014
Figure 1: Availability of data over time, with the black bars showing the periods for which data is available.
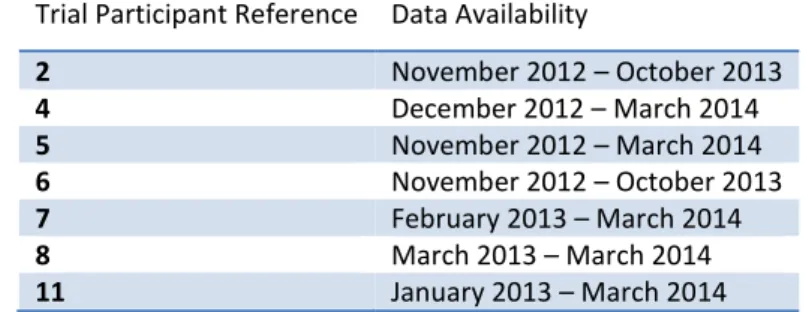
A total of seven locations were thus available for to be studied. These locations are summarised in Table 1.
16 /10/2 012 24 /01/2 013 04 /05/2 013 12 /08/2 013 20 /11/2 013 28 /02/2 014 1 mCHP 1 Whole House 2 mCHP 2 Whole House 3 mCHP 3 Whole House 4 mCHP 4 Whole House 5 mCHP 5 Whole House 6 mCHP 6 Whole House 7 mCHP 7 Whole House 8 mCHP 8 Whole House 9 mCHP 9 Whole House 10 mCHP 10 Whole House 11 mCHP 11 Whole House
7
Copyright Northern Powergrid (Northeast) Limited, Northern Powergrid (Yorkshire) Plc, British Gas Trading Limited, University of Durham and EA Technology Ltd, 2014
Trial Participant Reference Data Availability
2 November 2012 – October 2013 4 December 2012 – March 2014 5 November 2012 – March 2014 6 November 2012 – October 2013 7 February 2013 – March 2014 8 March 2013 – March 2014 11 January 2013 – March 2014
8
Copyright Northern Powergrid (Northeast) Limited, Northern Powergrid (Yorkshire) Plc, British Gas Trading Limited, University of Durham and EA Technology Ltd, 2014
4
Data Processing
The raw data comprised a number of Comma Separated Values (CSV) files containing the parameter measurements. One large file contained data for November 2012 to October 2013, while several smaller files contained the rest of the data. Python scripts were created to process the large files into smaller files of manageable size, with the data being separated according to location, the parameter being measured, and the month. Additionally, it was necessary to remove a large amount of duplicated data from the resulting files, especially the largest one, with as much as 95% of the original data in that file being made up of duplicated data entries. Other files were found to contain data that was all zero.
Following initial processing, the minute interval data were averaged to half-hour interval, which was achieved by rounding the time period down to the nearest half hour for each data reading, and then taking the average over every reading with an identical time value, thus providing average half hourly consumption profiles (in watts).
Where there were periods of missing data (ranging from single minutes to hours), gaps were filled using averaged monthly data of the corresponding half-hour period. Once all the missing data points were filled, the weekday and weekend demand profiles were calculated for each month by averaging over all the weekdays / weekends in the month for each half-hour period.
In order to convert from watts to watt-hours for total energy consumption and export profiles, the readings were summed over each half hour reading in a month, weekday or weekend, then divided by two.
9
Copyright Northern Powergrid (Northeast) Limited, Northern Powergrid (Yorkshire) Plc, British Gas Trading Limited, University of Durham and EA Technology Ltd, 2014
5
Data Analysis
5.1 Total Consumption, Production and Import
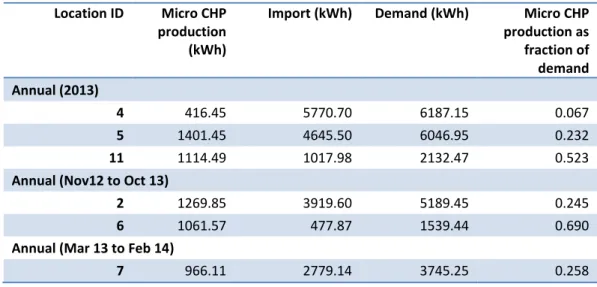
Analysis objectives 1 and 3 involve investigating the total household consumption and export. Examining the results presented in Table 2, it is possible to draw a number of early conclusions. Firstly that there is significant variation between the properties in terms of both household demand and micro-CHP output, though this is not unexpected; domestic properties exhibit large ranges of total annual energy consumption, with for example larger houses requiring more heat and electricity. Computing micro-CHP electricity production as a percentage of total annual household electricity demand (i.e. how the micro-CHP generation compares with the demand of the household) also shows significant variation between households, from 7 to 70%, with the average value being 34%.
Location ID Micro CHP production (kWh)
Import (kWh) Demand (kWh) Micro CHP production as fraction of demand Annual (2013) 4 416.45 5770.70 6187.15 0.067 5 1401.45 4645.50 6046.95 0.232 11 1114.49 1017.98 2132.47 0.523
Annual (Nov12 to Oct 13)
2 1269.85 3919.60 5189.45 0.245
6 1061.57 477.87 1539.44 0.690
Annual (Mar 13 to Feb 14)
7 966.11 2779.14 3745.25 0.258
Table 2: Annual totals for consumption and production.
Location 8 only has data from November 2013 to March 2014, so annual analysis is not possible for this location.
It is also possible to calculate, from this data, the annual CO2 savings that result from the use of micro-CHP, and the annual energy bill savings. When calculating the CO2 savings we compare the operation of a conventional natural-gas boiler with the micro-CHP unit co-producing electricity and heat. We take the lifecycle carbon intensity of mains delivered natural gas to be 203g CO2/kWh [3]. The analysis of equivalent electrical output requires that we estimate the UK grid’s carbon intensity, which fluctuates depending on the fuel mix. For this analysis two values were used; an average value of 450g CO2/kWh, and a marginal value of 780g CO2/kWh [3]. The average value is the average carbon intensity of the fuels in the grid, accounting for their relative proportion in generation, and the marginal value is based on the assumption that, given fossil fuels are the most flexible generation source, use of micro-CHP will mitigate the use of the most intensive grid carbon fuels, namely coal, and to a lesser extent, gas. Given that we do not have any data on heat consumption figures for the studied properties, we cannot compare total household emissions with and without micro-CHP. But we can still calculate the carbon savings of the micro-CHP devices, by comparing their emissions to that of a typical boiler, and assigning the difference in emissions between a boiler and a
10
Copyright Northern Powergrid (Northeast) Limited, Northern Powergrid (Yorkshire) Plc, British Gas Trading Limited, University of Durham and EA Technology Ltd, 2014
micro-CHP device to the electricity producing activities of the micro-CHP. For example, a 90% efficient boiler will use 6.7kWh of gas to produce 6kWh of heat, but a Baxi Stirling engine will use 7.8kWh of gas to produce 6kWH of heat and 1kWh of electricity. So the micro-CHP device is effectively using 1.1kWh of gas to produce 1kWh of electricity, giving its generated electricity an emissions factor of 223g CO2/kWh. So the annual household CO2 emissions without micro-CHP will be:
𝐶𝑜𝑛𝑣𝑒𝑛𝑡𝑖𝑜𝑛𝑎𝑙 ℎ𝑜𝑢𝑠𝑒ℎ𝑜𝑙𝑑 𝑒𝑙𝑒𝑐𝑡𝑟𝑖𝑐𝑖𝑡𝑦 𝑒𝑚𝑖𝑠𝑠𝑖𝑜𝑛𝑠
= [ℎ𝑜𝑢𝑠𝑒ℎ𝑜𝑙𝑑 𝑒𝑙𝑒𝑐𝑡𝑟𝑖𝑐𝑖𝑡𝑦 𝑑𝑒𝑚𝑎𝑛𝑑 ∗ 𝑔𝑟𝑖𝑑 𝑎𝑣𝑒𝑟𝑎𝑔𝑒 𝑐𝑎𝑟𝑏𝑜𝑛 𝑖𝑛𝑡𝑒𝑛𝑠𝑖𝑡𝑦] ( 1 )
Thus the emissions with the micro-CHP unit will be: 𝑚𝐶𝐻𝑃 ℎ𝑜𝑢𝑠𝑒ℎ𝑜𝑙𝑑 𝑒𝑙𝑒𝑐𝑡𝑟𝑖𝑐𝑖𝑡𝑦 𝑒𝑚𝑖𝑠𝑠𝑖𝑜𝑛𝑠
= [ℎ𝑜𝑢𝑠𝑒ℎ𝑜𝑙𝑑 𝑒𝑙𝑒𝑐𝑡𝑟𝑖𝑐𝑖𝑡𝑦 𝑖𝑚𝑝𝑜𝑟𝑡 ∗ 𝑔𝑟𝑖𝑑 𝑎𝑣𝑒𝑟𝑎𝑔𝑒 𝑐𝑎𝑟𝑏𝑜𝑛 𝑖𝑛𝑡𝑒𝑛𝑠𝑖𝑡𝑦] + [𝑚𝑖𝑐𝑟𝑜𝐶𝐻𝑃 𝑔𝑒𝑛𝑒𝑟𝑎𝑡𝑖𝑜𝑛 ∗ 223]
( 2 )
where 223kg CO2/kWh is the electricity emissions factor of the electricity generated by micro-CHP. The percentage savings will be:
𝐸𝑚𝑖𝑠𝑠𝑖𝑜𝑛𝑠 𝑟𝑒𝑑𝑢𝑐𝑡𝑖𝑜𝑛 (%) = (1 − 𝑚𝐶𝐻𝑃 𝑒𝑙𝑒𝑐𝑡𝑟𝑖𝑐𝑖𝑡𝑦 ℎ𝑜𝑢𝑠𝑒ℎ𝑜𝑙𝑑 𝑒𝑚𝑖𝑠𝑠𝑖𝑜𝑛𝑠
𝐶𝑜𝑛𝑣𝑒𝑛𝑡𝑖𝑜𝑛𝑎𝑙 ℎ𝑜𝑢𝑠𝑒ℎ𝑜𝑙𝑑 𝑒𝑙𝑒𝑐𝑡𝑟𝑖𝑐𝑖𝑡𝑦 𝑒𝑚𝑖𝑠𝑠𝑖𝑜𝑛𝑠) ∗ 100 ( 3 )
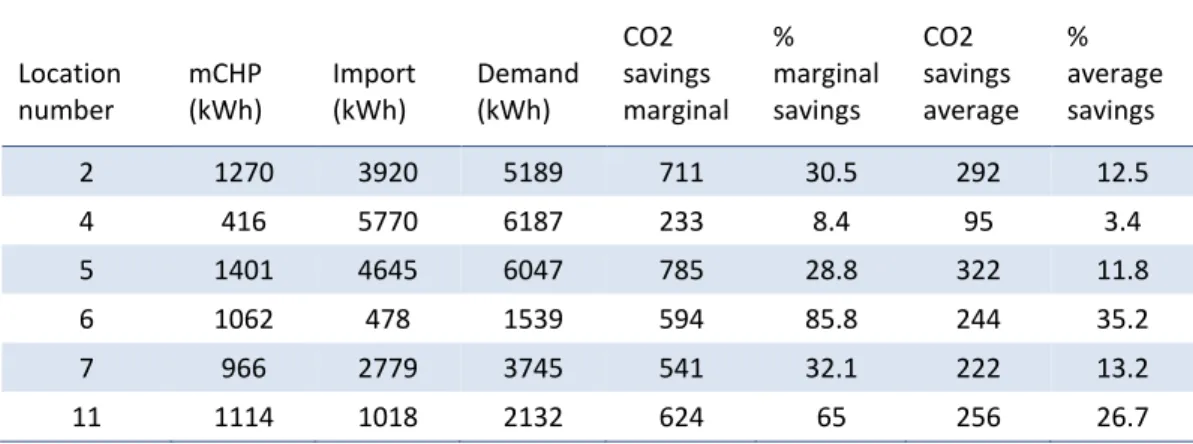
The carbon savings for each property in the trial are listed in Table 3. A wide range of values can be observed, from 8% to 86% (with an average of 42%) when comparing with marginal grid intensity, and 3% to 35% (with an average of 17%) when comparing with average grid carbon intensity. This range can be explained by the diverse levels of micro-CHP generation, and what fraction of household demand that it accounts for. Location number mCHP (kWh) Import (kWh) Demand (kWh) CO2 savings marginal % marginal savings CO2 savings average % average savings 2 1270 3920 5189 711 30.5 292 12.5 4 416 5770 6187 233 8.4 95 3.4 5 1401 4645 6047 785 28.8 322 11.8 6 1062 478 1539 594 85.8 244 35.2 7 966 2779 3745 541 32.1 222 13.2 11 1114 1018 2132 624 65 256 26.7
Table 3: CO2 savings that result from micro-CHP, compared against marginal and average grid carbon intensities. The percentage reduction in emissions is compared with total household electricity emissions, not with total household emissions.
11
Copyright Northern Powergrid (Northeast) Limited, Northern Powergrid (Yorkshire) Plc, British Gas Trading Limited, University of Durham and EA Technology Ltd, 2014
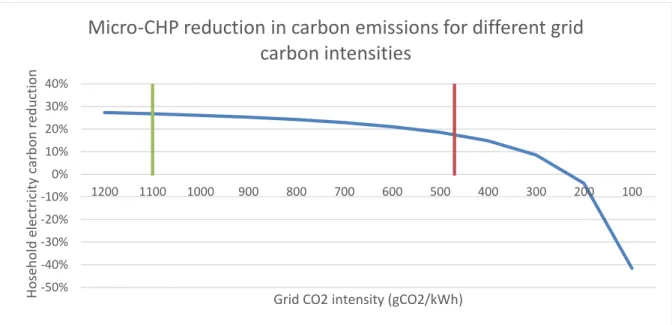
However, the level of carbon emissions will change with changing grid carbon levels, which will alter the carbon reduction contribution of micro-CHP, as this is based on offsetting carbon-intensive grid electricity. Figure 2 shows how the carbon reduction potential of micro-CHP changes with different grid carbon levels. There is a gradual decline in emissions reduction until the grid carbon level falls below around 500g CO2/kWh, after which it starts to fall more rapidly. At an emissions factor of 470g CO2/kWh, equivalent to that of natural gas fired power plants, CHP gives an emissions reduction of 18%. Assuming that micro-CHP will continue to offset more carbon-intensive grid generation, as long as there is a reasonable proportion of gas in the grid (depending on how widespread micro-CHP is), micro-CHP will achieve average emissions reductions of 18%. However, when the grid is fully or mostly decarbonised, currently anticipated to be around 2030, micro-CHP will result in an increase in carbon emissions unless it is powered by zero carbon fuel, such as biogas or hydrogen.
Figure 2: How the carbon reduction of micro-CHP is affected by changing grid intensity. The blue line indicates the changing emissions reduction, while the grey and orange vertical lines indicate the carbon intensity of coal-fired and natural gas-fired
power plants respectively.
Location
Savings due to changes in imported energy (£) Generation tariff income (£) Export tariff income (£) Total savings (£) 2 22 95 17 135 4 17 67 12 96 5 112 184 12 308 6 -11 139 39 167 7 46 143 22 211 11 125 233 21 378 Average 52 143 20 216
Table 4: Summary of economical savings of Stirling engine micro-CHP.
-50% -40% -30% -20% -10% 0% 10% 20% 30% 40% 1200 1100 1000 900 800 700 600 500 400 300 200 100 H o se h o ld ele ctricity carb o n re d u ctio n
Grid CO2 intensity (gCO2/kWh)
Micro-CHP reduction in carbon emissions for different grid
carbon intensities
12
Copyright Northern Powergrid (Northeast) Limited, Northern Powergrid (Yorkshire) Plc, British Gas Trading Limited, University of Durham and EA Technology Ltd, 2014
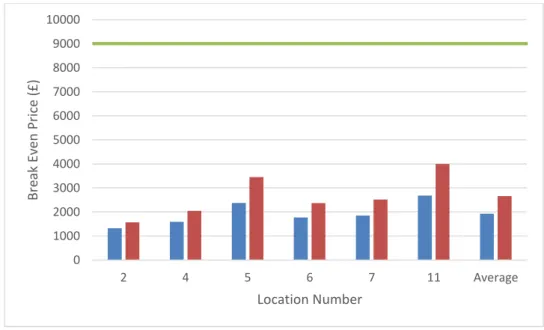
The annual monetary savings that result from the micro-CHP are calculated assuming a generation tariff of 13.24p/kWh, and an export tariff of 4.77p/kWh [2]; these values are summarised in Table 2. The annual savings vary between £96 and £378, with an average value of £217. The value of the total savings does not correlate with either the micro-CHP unit heat-to-power ratio of 6:1 or the total micro-CHP production. From the savings we can estimate a break-even price, how cheap the unit would have to be for the savings to enable the consumer to break-even on the purchase over a certain amount of time, and compare that to the actual price of the units. Figure 3 shows the break-even price for each of the properties, and the actual cost of the unit (the green line). It can be seen that the cost of the unit is currently well above any of the break-even prices, which indicates that domestic Stirling engine micro-CHP will have to fall significantly in price in order to be commercially viable.
Figure 3: Break-even price for each location given the energy bill savings, for 5 (blue) and 10 (red) year payback times, with the green line showing the actual cost of the Baxi Ecogen Stirling engine.
Finally, the percentage of micro-CHP produced electricity that was exported to the grid annually by the trial units was between 17% and 51%, with an average of 27%, which shows, despite the micro-CHP power output of 0.8kW-1kW being less than the typical household peak power demand for this group, that the micro-CHP units were for a significant amount of time operating at times of relatively low household electrical demand.
5.2 Demand, Production and Import profiles
Diurnal profiles are reasonably similar across all locations; in general, the output of the micro-CHP device varies between 0W and 800W, occasionally operating at some value in between. This holds true for summer as well as winter, although in summer the micro-CHP generator operates less frequently. The whole home diurnal import profile shows wide fluctuations in demand across the day, but with a tendency to small morning peaks and larger, longer, evening peaks. The import values tend to vary between -500W and
0 1000 2000 3000 4000 5000 6000 7000 8000 9000 10000 2 4 5 6 7 11 Average Bre ak E ve n Price (£) Location Number
13
Copyright Northern Powergrid (Northeast) Limited, Northern Powergrid (Yorkshire) Plc, British Gas Trading Limited, University of Durham and EA Technology Ltd, 2014
3000W, though there are occasional periods where import is significantly higher than this, up to 5000-8000W. Of more interest than individual day profiles are the average weekday and weekend profiles, as they show a better picture of the overall trends in each location. Comparing household demand (i.e. underlying demand without the micro-CHP export) and household import shows that the import profile is broadly similar to the demand profile, but with some of the peaks reduced, and frequent small amounts of export during periods of low demand.
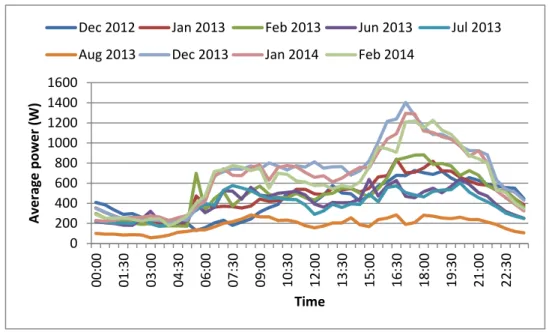
In examining the average weekday and weekend, and comparing the average weekdays and weekends for the summer months with the average weekdays and weekends for the winter months, two of the locations have unreliable winter data, where demand does not rise above 60W; suggesting either faulty measurement or that the occupiers were away for the winter. Another location has no summer data, which leaves four locations where the summer/winter comparison can be examined. On visual inspection, the demand profile shape does not substantially change between summer and winter, but overall demand is reduced in summer, especially for the evening peak. In general the demand rises in the morning, from around 6am, peaks around 8-10am, may fall to a lower level for the rest of the day before starting to rise around 3-5pm to the evening peak. The micro-CHP generation profile also looks similar for summer and winter, with a high morning peak, and a lower, but longer evening peak, with the summer peaks being lower than the winter ones. The main effect of the micro-CHP is to reduce the evening peak by a few hundred watts, but there is also export in the morning because the micro-CHP export peak tends to occur before morning electricity demand starts to rise. There is a sharp export peak at around 5-7am, of about 500W, which is present even in summer (though at a slightly lower value). While the reduction of the evening peak would probably be beneficial from a network viewpoint, the morning export peak could become a source of voltage rise in areas with sufficient deployment of micro-CHP because it occurs at a time when demand will be low across the network.
The average CHP consumption/production profiles for the summer and winter months are shown in Figure 4. The average household demand and resulting import profiles for the summer and winter months are shown in Figure 5 and Figure 6 respectively.
-100 0 100 200 300 400 500 600 700 00 :00 01 :00 02 :00 03 :00 04 :00 05 :00 06 :00 07 :00 08 :00 09 :00 10 :00 11 :00 12 :00 13 :00 14 :00 15 :00 16 :00 17 :00 18 :00 19 :00 20 :00 21 :00 22 :00 23 :00 A ver ag e p ow er (W ) Time
Dec 2012 Jan 2013 Feb 2013 Jun 2013 Jul 2013 Aug 2013 Dec 2013 Jan 2014 Feb 2014
14
Copyright Northern Powergrid (Northeast) Limited, Northern Powergrid (Yorkshire) Plc, British Gas Trading Limited, University of Durham and EA Technology Ltd, 2014
Figure 4: Average micro-CHP consumption/production profiles for the summer and winter months
Figure 5: Average household demand profiles for the summer and winter months
Figure 6: Average household import profiles for the summer and winter months
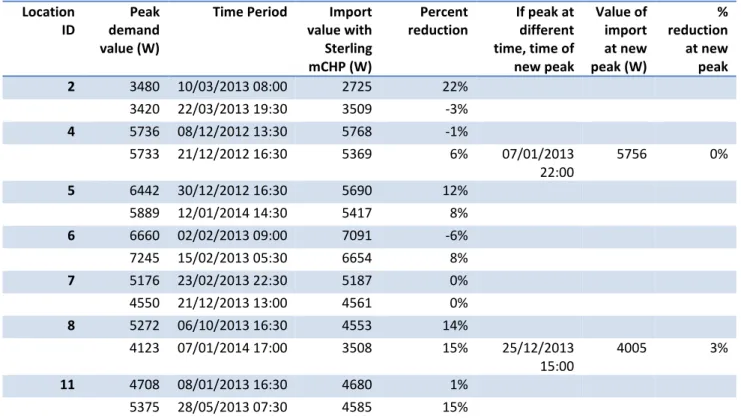
Next, the effect of micro-CHP generation on the two half-hour periods in the year with the highest demand was investigated. As summarised in Table 5, the periods tended to be in either December or January, with a few in February, March and October, and even one in May1. In most cases the presence of micro-CHP
1 With such a small number of customers in the trial, this diversity is perhaps not surprising.
0 200 400 600 800 1000 1200 1400 1600 00 :0 0 01 :3 0 03 :0 0 04 :3 0 06 :0 0 07 :3 0 09 :0 0 10 :3 0 12 :0 0 13 :3 0 15 :0 0 16 :3 0 18 :0 0 19 :3 0 21 :0 0 22 :30 A ver ag e p ow er (W ) Time
Dec 2012 Jan 2013 Feb 2013 Jun 2013 Jul 2013 Aug 2013 Dec 2013 Jan 2014 Feb 2014
-400 -200 0 200 400 600 800 1000 00 :0 0 01 :3 0 03 :0 0 04 :3 0 06 :0 0 07 :3 0 09 :0 0 10 :3 0 12 :0 0 13 :3 0 15 :0 0 16 :3 0 18 :0 0 19 :3 0 21 :0 0 22 :30 A ver ag e p ow er (W ) Time
Dec 2012 Jan 2013 Feb 2013 Jun 2013 Jul 2013 Aug 2013 Dec 2013 Jan 2014 Feb 2014
15
Copyright Northern Powergrid (Northeast) Limited, Northern Powergrid (Yorkshire) Plc, British Gas Trading Limited, University of Durham and EA Technology Ltd, 2014
reduced the demand by a few hundred watts, although there were a few locations where demand is not reduced at all, or is even increased slightly. There are also a few occasions where the presence of micro-CHP shifts the peak half hour import by an hour or two (i.e. the presence of micro-CHP causes the half hour of highest import to be at a different time to the half hour of highest demand). The micro-CHP reduces the peak demand by between -4% and 22%, with an average reduction of 5%. This means that there are some times where micro-CHP increases demand, which will be when the engine itself is off, but the control system is on and drawing ~10-100 Watts from the grid.
Location ID
Peak demand value (W)
Time Period Import value with Sterling mCHP (W) Percent reduction If peak at different time, time of new peak Value of import at new peak (W) % reduction at new peak 2 3480 10/03/2013 08:00 2725 22% 3420 22/03/2013 19:30 3509 -3% 4 5736 08/12/2012 13:30 5768 -1% 5733 21/12/2012 16:30 5369 6% 07/01/2013 22:00 5756 0% 5 6442 30/12/2012 16:30 5690 12% 5889 12/01/2014 14:30 5417 8% 6 6660 02/02/2013 09:00 7091 -6% 7245 15/02/2013 05:30 6654 8% 7 5176 23/02/2013 22:30 5187 0% 4550 21/12/2013 13:00 4561 0% 8 5272 06/10/2013 16:30 4553 14% 4123 07/01/2014 17:00 3508 15% 25/12/2013 15:00 4005 3% 11 4708 08/01/2013 16:30 4680 1% 5375 28/05/2013 07:30 4585 15%
Table 5: The two half hour periods with the highest demand, and the effect of micro-CHP on that demand.
The two days with the highest demand (energy consumption in kWh) can also be analysed. For this, the average micro-CHP, import and demand profiles over all locations were computed, and then the two days of, on average, highest demand in kWh were identified. These were 25th December 2013 with 22.96kWh of demand and 5th January 2014 with 22.73kWh of demand; their profiles are shown in Figure 7 and Figure 8 respectively. The presence of micro-CHP reduces the demand of these days to 16.1kWh and 16.5kWh respectively.
16
Copyright Northern Powergrid (Northeast) Limited, Northern Powergrid (Yorkshire) Plc, British Gas Trading Limited, University of Durham and EA Technology Ltd, 2014
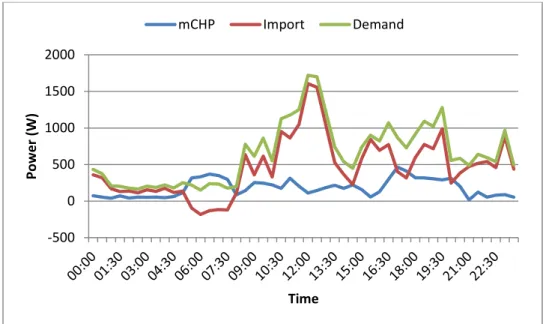
Figure 7: Micro-CHP, import and demand profiles (in watts) for the peak demand day (25 December 2013)
Figure 8: Micro-CHP, import and demand profiles (in watts) for the second peak demand day (5 January 2014)
The demand profile for the day of highest demand is quite different from the other demand curves; the difference is almost certainly due to the fact that it is Christmas Day where behaviours are different from the norm. On Christmas Day there is a smaller reduction in the peak electricity demand, which occurs at midday, when heat demand is low; the evening demand is still reduced by a few hundred watts. The demand profile for the second biggest demand day is more similar to the other demand profiles.
-500 0 500 1000 1500 2000 Pow e r ( W) Time mCHP Import Demand -400 -200 0 200 400 600 800 1000 1200 1400 1600 P ow er (W) Time mCHP Import Demand
17
Copyright Northern Powergrid (Northeast) Limited, Northern Powergrid (Yorkshire) Plc, British Gas Trading Limited, University of Durham and EA Technology Ltd, 2014
5.3 Comparison against other research
To date, there have been no other UK field trials into the impact of micro-CHP at the domestic level on LV electrical networks. Much of the literature focuses on the potential carbon savings of micro-CHP and the economic benefit, i.e. the amount by which micro-CHP can reduce household energy bills. Baxi publish a specification sheet illustrating the performance of the Ecogen engine, which claims carbon reductions of 40%, and energy bill savings of up to £600 [1]. Results from the CLNR trials suggest that on both these counts, the performance of the engines on average fall below these claimed figures. The best savings figure achieved was £378, and half of the properties achieved energy savings below £200. In comparison to Baxi’s claims on carbon savings, the devices in the field trial also perform poorly when compared with average grid carbon intensity; the best value is 12% carbon savings, and two thirds of the properties have savings under 10%. When comparing with marginal grid intensity, the results are better; at best achieving a 30% reduction, however two thirds of the properties still have reductions below 20%.
In other literature [4-7], carbon reductions of -4% to 12% is estimated for Stirling engine micro-CHP; the negative reductions indicating that in some cases emissions may rise, probably due to low efficiency or poor operation. The CLNR field trial results fall within this range of carbon reduction figures when compared to average grid carbon intensity, although none of the locations show negative emissions and on average, are towards the upper end of the scale. When compared to marginal grid carbon intensity, all but one location shows carbon savings better than those shown in the literature. With respect to bills savings, Alanne et al. [4] estimates the annual savings from micro-CHP to be £165, while Carbon Trust [5] estimates similar savings of £169 with a generation reward (which is cash for each watt generated, not a feed-in-tariff), and -£11 (i.e. a loss of £11) without a generation reward. The field trial savings were between these two values, though there were no generation rewards used in calculation of the field trial savings (just a feed-in-tariff). The field trial savings were lower than the range suggested in another paper of £200-250 [8]. On the whole, the results from the field trial are mostly consistent with the literature.
The main previous field trial undertaken in the UK, the one by Carbon Trust, found average carbon savings of 4% and annual savings of £158, using a Stirling engine with a heat-to-power ratio of 12:1 [5]. In comparison, the trial results examined in this paper show average carbon savings of £217, which is a reasonable increase. However, this was using up to date generation and export tariffs, and energy prices, if we use Carbon Trusts figures for tariffs and energy prices the CLNR field trial results only give savings of £170, a modest increase, indicating much of the increase in savings between the two trials has come from changes in tariffs and energy prices. For carbon emissions, the CLNR trial indicated average emissions savings of 17%, however this was just for household electricity emissions, whereas the Carbon Trust compared their emissions reduction to total household emissions (including heating), if we do this for our data (using the UK average for household heating emissions) we get emission savings of 8%, double what the Carbon Trust measured, which is to be expected given the CLNR trial’s Stirling engines had roughly double the electricity output of those the Carbon trust used.
Outside the UK, there was also a field trial in the south of France [9], which examined Stirling engines with a heat output of 7kW and an electricity output of 1kW, thus having a higher heat output, which should mean less electricity generation. However, while their peak reduction values of 17-20% are similar to those seen in
18
Copyright Northern Powergrid (Northeast) Limited, Northern Powergrid (Yorkshire) Plc, British Gas Trading Limited, University of Durham and EA Technology Ltd, 2014
this trial, on average 47% of the micro-CHP generated in their trial was being exported, whereas with our study the average was 27%. This discrepancy could be explained if their houses had higher heat demands, which would cause the micro-CHP to be used more often which would likely result in more exported electricity.
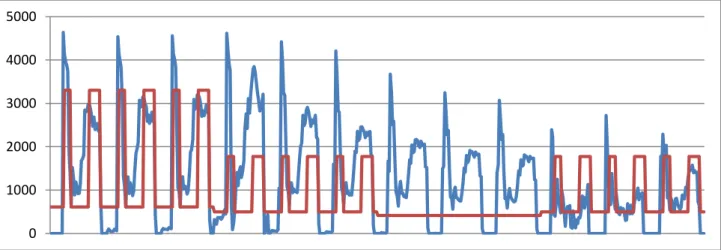
A final comparison is with previous work done by the author, on simulations of micro-CHP deployment [10]. Again, the annual production, CO2 reductions and energy bill savings are similar, but additionally the simulated operation profiles of the micro-CHP can be compared with the actual operation profiles of the micro-CHP observed in the trial. These profiles were estimated using the UK heat demand profile for an average domestic house, which allowed an estimate of the proportion of heat energy used by season (40% in winter, 25% in spring and autumn and 10% in summer), and how much was used at peak and off-peak times (74% and 26% respectively). Figure 9 and Figure 10 give two examples of how this differs from the heat demand estimated from the micro-CHP use, for the average weekday for each month, from December to November.
Figure 9: Simulated micro-CHP heat generation profile (red) compared with actual micro-CHP heat generation profile (blue), showing the average monthly demand across the year
Figure 10: Simulated micro-CHP heat generation profile (red) compared with actual micro-CHP heat generation profile (blue), showing the average monthly demand across the year
0 1000 2000 3000 4000 5000 0 1000 2000 3000 4000 5000 6000
19
Copyright Northern Powergrid (Northeast) Limited, Northern Powergrid (Yorkshire) Plc, British Gas Trading Limited, University of Durham and EA Technology Ltd, 2014
As can be seen, while the simulated heat demand’s peaks match up reasonably well with the estimated demand peaks, the peak values are consistently underestimated (except for the winter evenings in one location), while the off peak values are overestimated. In particular there seems to be a gross underestimation of the summer, spring and autumn demand, suggesting a re-examination of how much of the annual demand these seasons account for, as well as an allocation of a higher portion of heat demand to peak times. The estimated heat demand calculations suggest that, on average, winter accounts for 37% of heat demand, spring 30%, summer 9% and autumn 24%.
5.4 Further Analysis
Whilst the CLNR micro-CHP field trial was limited to Stirling engines, it is possible to use the results to estimate the operational envelopes of other micro-CHP technologies, such as internal combustion engines (ICEs) and fuel cells. ICEs will operate in much the same way as Stirling engines, but with a lower heat-to-power ratio, of 3:1, compared to the Stirling engine’s 6:1, resulting in around a doubling of electrical output for a given heat output. Thus for ICEs the profiles will be the same but with double the micro-CHP electrical generation output, which will mean further reductions to evening peaks, and to the import in the two half hour periods of greatest demand, but also an increase of 500-1000W to the morning export.
Fuel cell micro-CHP technology will operate rather differently from Stirling engines, as frequent on/off cycling, as seen in Stirling engine operation, will cause cell degradation and reduce operational lifespan. Therefore, their operational profile will need to be one that is more consistently on for long periods in order to meet heat demand. There are three possible operational strategies that can be modelled, all of which incorporate a backup boiler and a heat store in the form of a hot-water tank. In all cases, any excess heat would be put into storage, unless storage was full, in which case the fuel cell would shut down. Additional heat required at times of peak demand would be provided by the boiler. The three strategies are:
1. Profile operation, where the micro-CHP follows the typical heat demand profile, switching on in the morning and gradually building up to the morning peak, declining in output during the day, and then building up again for the evening peak. This was simulated by causing the micro-CHP unit to output as a moving average, so for each half-hour period computing the average demand of the next three hours and using that as the micro-CHP heat production.
2. Constant operation, where the micro-CHP operates constantly, at a low heat output to provide base-load heating; this constant output will change between seasons.
3. Storage top-up, where micro-CHP will switch on if storage is empty, stay on until it is filled, and then switch off until it is empty again.
Simulation of these operational regimes for the properties studied in the CLNR trials shows that in the cases of profile operation and storage top up, the fuel cell provided 86-97% of the properties’ heat demands, with neither operational mode being consistently higher across all properties. For constant operation the value was lower, between 62-81%, but with most properties above 70%.
Examining carbon emissions and economics, constant operation performed poorly compared to the other two strategies, with -7% to 22% CO2 reduction (average grid emissions), 9% to 48% CO2 reduction (marginal grid emissions) and savings of £173 to £972, with an average of £568. Meanwhile both storage top-up and
20
Copyright Northern Powergrid (Northeast) Limited, Northern Powergrid (Yorkshire) Plc, British Gas Trading Limited, University of Durham and EA Technology Ltd, 2014
profile operation performed similarly, with 20% to 51% CO2 reduction (average grid emissions) and 49% to 132% CO2 reduction (marginal grid emissions) and savings of £422 to £1340 with an average of £845.
In order to investigate the impact of fuel cell micro-CHP on import profiles, the average weekday profiles again present the best insights into how micro-CHP will affect the households’ typical operation profiles.
Figure 11: Simulated fuel cell profile operation, demand in W vs time (hh:mm). Average weekday profiles for location 5, for each month from December 2012 to March 2014.
Figure 12: Simulated fuel cell profile operation, demand in W vs time (hh:mm). Average weekday profiles for location 7, for each month from February 2013 to March 2014
-2500 -2000 -1500 -1000 -500 0 500 1000 1500 2000 2500 3000 00 :0 0 11 :0 0 22 :0 0 09 :0 0 20 :0 0 07 :0 0 18 :0 0 05 :0 0 16 :0 0 03 :0 0 14 :0 0 01 :0 0 12 :0 0 23 :0 0 10 :0 0 21 :0 0 08 :0 0 19 :0 0 06 :0 0 17 :0 0 04 :0 0 15 :0 0 02 :0 0 13 :0 0 00 :0 0 11 :0 0 22 :0 0 09 :0 0 20 :0 0 07 :0 0 18 :0 0 05 :0 0 16 :0 0 03 :0 0 14 :0 0
Household Demand micro-CHP production Household Import
-2000 -1500 -1000 -500 0 500 1000 1500 2000 2500 00 :0 0 10 :0 0 20 :0 0 06 :0 0 16 :0 0 02 :0 0 12 :0 0 22 :0 0 08 :0 0 18 :0 0 04 :0 0 14 :0 0 00 :0 0 10 :0 0 20 :0 0 06 :00 16 :0 0 02 :0 0 12 :0 0 22 :0 0 08 :0 0 18 :0 0 04 :0 0 14 :0 0 00 :0 0 10 :0 0 20 :0 0 06 :0 0 16 :0 0 02 :0 0 12 :0 0 22 :0 0 08 :0 0 18 :0 0
21
Copyright Northern Powergrid (Northeast) Limited, Northern Powergrid (Yorkshire) Plc, British Gas Trading Limited, University of Durham and EA Technology Ltd, 2014
As can be seen from Figure 11 and Figure 12, the use of fuel cell micro-CHP in profile operation causes a large amount of early morning export, as does the Stirling engine micro-CHP. The fuel cell micro-CHP electrical output is big enough to also cause substantial amounts of export at peak evening times. Other locations produced similar profiles.
Figure 13: Simulated fuel cell constant operation, demand in W vs time (hh:mm). Average weekday profiles for location 5, for each month from December 2012 to March 2014.
Figure 14: Simulated fuel cell constant operation, demand in W vs time (hh:mm). Average weekday profiles for location 7, for each month from February 2013 to March 2014.
-400 -200 0 200 400 600 800 1000 1200 1400 1600 00 :0 0 11 :0 0 22 :0 0 09 :0 0 20 :0 0 07 :0 0 18 :0 0 05 :0 0 16 :0 0 03 :0 0 14 :0 0 01 :0 0 12 :0 0 23 :00 10 :0 0 21 :00 08 :0 0 19 :00 06 :0 0 17 :00 04 :0 0 15 :00 02 :0 0 13 :00 00 :0 0 11 :00 22 :0 0 09 :0 0 20 :0 0 07 :0 0 18 :0 0 05 :0 0 16 :0 0 03 :0 0 14 :0 0
Household Demand micro-CHP Production Household Import
-400 -200 0 200 400 600 800 1000 1200 1400 00: 00 08: 30 17: 00 01: 30 10: 00 18: 30 03: 00 11: 30 20: 00 04: 30 13: 00 21: 30 06 :00 14: 30 23: 00 07: 30 16: 00 00: 30 09: 00 17: 30 02: 00 10: 30 19: 00 03: 30 12: 00 20: 30 05 :00 13: 30 22: 00 06: 30 15: 00 23: 30 08: 00 16: 30 01: 00 09: 30 18: 00 02: 30 11: 00 19: 30
22
Copyright Northern Powergrid (Northeast) Limited, Northern Powergrid (Yorkshire) Plc, British Gas Trading Limited, University of Durham and EA Technology Ltd, 2014
In Figure 13 and Figure 14 it can be seen that constant operation of fuel cell micro-CHP produces much smaller impacts on the network than profile operation. There is still early morning export, but here it is at a similar level to that seen with Stirling engine micro-CHP. The evening peak is also reduced by a similar amount as with Stirling engines. Again, the other locations provide similar profiles.
Figure 15: Simulated fuel cell storage top-up operation, demand in W vs time (hh:mm). Average weekday profiles for location 5, for each month from December 2012 to March 2014.
Figure 16: Simulated fuel cell storage top-up operation, demand in W vs time (hh:mm). Average weekday profiles for location 7, for each month from February 2013 to March 2014.
-1500 -1000 -500 0 500 1000 1500 2000 00 :0 0 11 :0 0 22 :0 0 09 :0 0 20 :0 0 07 :00 18 :0 0 05 :0 0 16 :0 0 03 :0 0 14 :0 0 01 :0 0 12 :0 0 23 :0 0 10 :0 0 21 :0 0 08 :0 0 19 :0 0 06 :0 0 17 :0 0 04 :0 0 15 :0 0 02 :0 0 13 :0 0 00 :00 11 :0 0 22 :0 0 09 :0 0 20 :0 0 07 :0 0 18 :0 0 05 :0 0 16 :0 0 03 :00 14 :0 0
Household Demand micro-CHP Production Household Import
-1000 -500 0 500 1000 1500 00 :0 0 10 :0 0 20 :0 0 06 :0 0 16 :0 0 02 :0 0 12 :0 0 22 :0 0 08 :0 0 18 :0 0 04 :0 0 14 :0 0 00 :0 0 10 :0 0 20 :0 0 06 :0 0 16 :0 0 02 :0 0 12 :0 0 22 :0 0 08 :0 0 18 :0 0 04 :0 0 14 :0 0 00 :0 0 10 :0 0 20 :0 0 06 :0 0 16 :0 0 02 :0 0 12 :0 0 22 :0 0 08 :0 0 18 :0 0
23
Copyright Northern Powergrid (Northeast) Limited, Northern Powergrid (Yorkshire) Plc, British Gas Trading Limited, University of Durham and EA Technology Ltd, 2014
In Figure 15 and Figure 16, the micro-CHP storage top-up operation profile matches the electricity demand profile reasonably well; leading to less export overall, but still with a sizeable amount of export just before and just after the evening peak. While smaller than the levels of export seen in profile operation of fuel cell micro-CHP, it is still significantly larger than the levels seen with Stirling engines.
Of the three fuel cell micro-CHP operation strategies, constant operation has the least impact on the electricity network, roughly similar to the impact of Stirling engine micro-CHP, but has the weakest CO2 reduction and household energy bill savings. Profile operation performs better on CO2 reductions and bill savings but has a high impact on the network, while storage top-up performs similarly but with a lower network impact. As such storage top-up may be the best compromise between the need to reduce energy use and minimise the impact on the networks that results from early morning export.
The final piece of analysis is to examine what happens if solar PV generation is combined with micro-CHP generation. Figure 17 shows the impact of PV on demand profiles, taking the average weekday profiles from micro-CHP location 7 and overlaying solar data from elsewhere in the CLNR project.
Figure 17: Combined solar and micro-CHP generation, and its effects on household electricity import, for the average weekday for each month from February to January
Solar PV generation has a much bigger impact than micro-CHP in summer; however micro-CHP can play an almost equivalent role in the other seasons. Overall, the combination of the two results is consistent export during the day, at quite high levels.
-3000 -2000 -1000 0 1000 2000 3000 08 :0 0 16 :3 0 01 :0 0 09 :3 0 18 :0 0 02 :30 11 :0 0 19 :3 0 04 :0 0 12 :3 0 21 :0 0 05 :3 0 14 :0 0 22 :30 07 :0 0 15 :3 0 00 :0 0 08 :3 0 17 :0 0 01 :3 0 10 :0 0 18 :3 0 03 :0 0 11 :3 0 20 :0 0 04 :3 0 13 :0 0 21 :3 0 06 :0 0 14 :3 0 23 :00 07 :3 0 16 :0 0
24
Copyright Northern Powergrid (Northeast) Limited, Northern Powergrid (Yorkshire) Plc, British Gas Trading Limited, University of Durham and EA Technology Ltd, 2014
Figure 18: Day of biggest (straight line) and second biggest (dashed line) demand, with solar and micro-CHP generation.
Figure 18 shows the generation and import profiles on the days of biggest demand. However, little has changed compared to the situation with just micro-CHP (Figure 6 and Figure 7), as both days are in winter, solar generation is at its lowest level and only provides a few hundred watts around midday, which does serve to further reduce the Christmas midday peak. The day of biggest export for solar and micro-CHP is in the summer, and due to the low heat demand, is almost completely dominated by solar generation, with micro-CHP having little impact.
-500 0 500 1000 1500 2000 00 :0 0 01 :0 0 02 :0 0 03 :0 0 04 :0 0 05 :0 0 06 :00 07 :0 0 08 :0 0 09 :0 0 10 :0 0 11 :0 0 12 :0 0 13 :0 0 14 :0 0 15 :0 0 16 :0 0 17 :0 0 18 :0 0 19 :00 20 :0 0 21 :0 0 22 :0 0 23 :0 0 mCHP and Solar Import Demand mCHP and Solar Import Demand
25
Copyright Northern Powergrid (Northeast) Limited, Northern Powergrid (Yorkshire) Plc, British Gas Trading Limited, University of Durham and EA Technology Ltd, 2014
6
Conclusions
This report has examined the results of the CLNR field trial of micro-CHP. The analysis has focused on the annual micro-CHP production and the reduction in annual electricity import, in order to estimate the benefits to the household in terms of energy bill savings and CO2 reductions. Furthermore, the analysis has considered the average daily production and import profiles, in order to estimate the impact on the grid of micro-CHP usage. The findings indicate that while micro-CHP can provide reasonable reductions in household CO2 emissions, it performs poorly in terms of reducing energy bills especially in comparison with the cost of the device. In order for micro-CHP to be economically viable, either the savings must increase, or the cost must decrease substantially. The impact on the grid has both positive and negative aspects; a reduction in the evening peak by a few hundred watts should be beneficial, however early morning export could result in generation-induced network constraints (particularly voltage rise). Other micro-CHP technologies perform better economically and with respect to CO2 reductions due to their higher heat-to-power ratios; however the grid impacts are increased.
There is significant scope for future studies. The field trial could be expanded to cover a greater number of domestic properties to give much stronger statistically relevant results. The grid impacts could be further studied by use of network design models, and limit violation mitigation strategies developed, perhaps by ensuring a mix of heat pumps and micro-CHP on the same substation and scheduling the early morning demand of heat pumps to coincide with the early morning export of the micro-CHP technologies.
26
Copyright Northern Powergrid (Northeast) Limited, Northern Powergrid (Yorkshire) Plc, British Gas Trading Limited, University of Durham and EA Technology Ltd, 2014
7
References
1. Baxi, Ecogen: The Baxi Ecogen Dual energy System, Baxi, Editor 2010. 2. EnergySavingTrust. Feed-In-Tariffs scheme (FITs). 2014; Available from:
www.energysavingtrust.org/Generating-energy/Getting-money-back/Feed-In-Tariffs-scheme-FITs. 3. Lelyveld, T. and P. Woods, Carbon emissions factors for fuels - Methodology and values for 2013 &
2016. Zero Carbon Hub, 2010.
4. Alanne, K., et al., Techno-economic assessment and optimization of Stirling engine
micro-cogeneration systems in residential buildings. Energy Conversion and Management, 2010. 51: p. 2635-2646.
5. CarbonTrust, Micro-CHP Accelerator, 2011, Carbon Trust.
6. Staffell, I. and R. Green, The cost of domestic fuel cell micro-CHP systems. International Journal of Hydrogen Energy, 2012.
7. Peacock, A.D. and M. Newborough, Impact of micro-CHP systems on domestic sector CO2 emissions. Applied Thermal Engineering, 2005. 25(17-18): p. 2653-2676.
8. De Paepe, M., P. D’Herdt, and D. Mertens, Micro-CHP systems for residential applications. Energy Conversion and Management, 2006. 47(18-19): p. 3435-3446.
9. Vuillecard, C., et al., Small scale impact of gas technologies on electric load management - mCHP & hybrid heat pump. Energy, 2011. 36: p. 2912-2923.
10. Jones, O.G.T., Model to analyse the impact of micro-CHP on future heating systems at the city scale, 2014.
4 Copyright Northern Powergrid (Northeast) Limited, Northern Powergrid (Yorkshire) Plc, British Gas Trading Limited, EA Technology Limited
and the University of Durham, 2014