ZEF-Discussion Papers on
Development Policy No. 159
Abdul Salam Lodhi, Daniel Tsegai and Nicolas Gerber
Determinants of participation in
child’s education and alternative
activities in Pakistan
The CENTER FOR DEVELOPMENT RESEARCH (ZEF) was established in 1995 as an international, interdisciplinary research institute at the University of Bonn. Research and teaching at ZEF addresses political, economic and ecological development problems. ZEF closely cooperates with national and international partners in research and development organizations. For information, see: www.zef.de.
ZEF – Discussion Papers on Development Policy are intended to stimulate discussion among researchers, practitioners and policy makers on current and emerging development issues. Each paper has been exposed to an internal discussion within the Center for Development Research (ZEF) and an external review. The papers mostly reflect work in progress. The Editorial Committee of the ZEF – DISCUSSION PAPERS ON DEVELOPMENT POLICY include Joachim von Braun (Chair), Solvey Gerke, and Manfred Denich.
Abdul Salam Lodhi, Daniel Tsegai and Nicolas Gerber, Determinants of participation in child’s education and alternative activities in Pakistan, ZEF- Discussion Papers on
Development Policy No. 159, Center for Development Research, Bonn, December 2011, pp. 50
ISSN: 1436-9931
Published by:
Zentrum für Entwicklungsforschung (ZEF) Center for Development Research
Walter-Flex-Straße 3 D – 53113 Bonn Germany Phone: +49-228-73-1861 Fax: +49-228-73-1869 E-Mail: zef@uni-bonn.de www.zef.de The authors:
Abdul Salam Lodhi, Center for Development Research. Contact: alodhi@uni-bonn.de
Daniel Tsegai, Center for Development Research. Contact: dtsegai@uni-bonn.de
Acknowledgements
The first author wishes to thank Higher Education Commission (HEC) of Pakistan for funding this research. The earlier versions of the manuscript benefitted from insightful comments of Prof. Arjun Bedi, Dr. Seid Ali and Dr. Guido Lüchters.
Abstract
Using data from Pakistan, this study analyzed the effect of various individual, household, and community level characteristics on the probability that children engage in different activities. According to the existing trend of their prevalence, we considered five child’s activities, namely: secular schooling; religious education; child labor; a combination of child labor and secular schooling; and inactivity (including leisure). Data was collected through field surveys conducted in over 40 villages in four Pakistani provinces: Balochistan, Khyber Paktunkhwa, Punjab, and Sind. A total of 963 households were interviewed on the activities of 2,496 children. Multinomial Probit model was used for the analyses. Results indicated that parental perception had significant relationship to the probability of engagement in secular school attendance, religious education, and child labor. In addition, we investigated the relationships between participation in the different child activities with location (rural/urban) and children’s gender. We detected a lower probability of attending secular school and a higher probability of engaging in child labor among female children in rural areas. We also found that even parents who openly expressed appreciation of the importance of secular schooling were more likely to send male children to school than female children.
1
1 Introduction
Education is one of the essential tools for human resource development and a necessary element for the sustainable socio-economic development of a society, as it can facilitate economic growth through the broader application of knowledge, skills, and the creative strength of a society. The positive outcomes of education in the long-term include reduction of poverty and inequality, improvement of public health, and good governance in the implementation of socio-economic policies.
Previous studies on the role of education in economic growth suggest that education enhances human capital formation, which is positively associated with economic development and growth (Nelson and Edmund, 1966; Mankiw et al., 1992; Barro, 2001; Krueger and Lindahl, 2001). Similarly, Sianesi and Reenen (2003) suggest that, in addition to direct effects, education affects economic growth indirectly by stimulating the accumulation of productive inputs such as physical capital, technology, and health, which in turn foster economic growth by mitigating factors that obstruct economic growth like population growth and infant mortality. Therefore, multifaceted impacts of education make it an essential element of policy framework.
In terms of the effect of education on economic development and growth, studies have highlighted that the impact of different levels of education depends on the stage of development and the rate of economic growth of a country. According to Petrakkis and Stamatakis (2002), primary and secondary education is more important to growth in developing countries whereas higher education is imperative in economically developed countries. On the importance of primary education in developing countries, Self and Grabowski (2004) found a strong causal relationship with economic growth. Likewise, Barro and Lee (2001) and Psacharopoulos and Patrinos (2004) suggested that for low-income and developing countries, investment in education has higher private and social returns than in developed nations. Harmon et al. (2003) also concluded that there is an unambiguously positive effect on individual earnings from education and that this effect is relatively larger than the returns on investments in other public sectors, especially in developing countries. However, despite the proven positive impacts of investment in education on economic growth and development, low levels of investment in education and low literacy rates are
2
persistent problems in many developing countries. This situation provides compelling support for the evaluation of factors that affect education at the level of individual countries to help determine appropriate and sustainable solutions.
The future literacy rate and the degree of human capital formation in a country depend on basic questions such as: how many (or the rate) of school-aged children are attending school? What alternate activities are available to children? What is the potential for human capital formation of children through alternative extracurricular activities such as child labor and religious education? This study focused on identifying the relevant determinants of participation in different child’s activities.
Regarding the relationships among poverty, education, child labor, and other activities, Basu and Van (1998) proposed the “luxury axiom”, stating that children only work when their families are unable to meet basic needs, and the “substitution axiom” stating that from an employer’s point of view, adult and child labor are interchangeable substitutes. These axioms propose a strong association between child labor and poverty. This association is also supported by several other studies (e.g. Maitra and Ray, 2002; Edmonds, 2005). Glewwe and Jacoby (2004) also found a positive and significant relationship between variation in wealth and the demand for education. That study claims that the wealth effect was valid even after controlling for locality specific factors such as the variability of education returns, availability, quality, and related opportunity costs.
Other studies have contradicted to the above findings, suggesting a more nonlinear relationship among poverty, child labor, and education. Bhalotra and Heady (2003) described a “wealth paradox”, stating that children in ‘land-rich’ households were more likely to engage in labor and less likely to go to school than the children in ‘land-poor’ households. Likewise, Ray (2000) rejected both the “luxury” and “substitution” axioms in the context of child labor in Pakistan, suggesting that income and related variables did not necessarily have the expected negative effects on child participation assumed by those studies. Swaminathan (1998) found that in Gujarat India, wage employment among children was associated with economic growth, and Kambhampati and Rajan (2006) found similar associations in other Indian states. In rural areas of Burkina Faso, Dumas (2007) found child leisure to be a luxury good and that households did not necessarily require child labor for subsistence needs. These contradictory findings about the interrelationships among poverty,
3
child labor, and education have given rise to a lengthy debate about the relationships of poverty to child’s activities at household level.
Review of Education and child labor in Pakistan
A review of historical literacy performance shows that Pakistan has improved its education profile and that there is still considerable room for progress. Literacy rates in the country identified by the number of people “who could read only” in 1951 was 16 percent. Currently rates are calculated on the basis of those “who are able to read with understanding and can write a short statement” which was 57.7 percent in 2010 (G.O.P., 2011). Comparison of literacy data from Pakistan with India and Bangladesh (Figures 1.1, 1.2 & 1.3 in the appendix), which gained political independence at approximately the same time (Figures 1.4 & 1.5 in the appendix) reveals some interesting differences. From 1950 to 2010, literacy rates in India have increased at higher rates for both men and women than in neighboring countries. In India the gender gap in literacy is also narrowing, despite historical evidence that this gap was formerly greater than in Pakistan. In the case of Pakistan, not only has the gender gap been increasing with the passage of time, but academic performance for both sexes has decreased. Comparison of the literacy rates of Pakistan with Bangladesh, which had a literacy rate of less than 20 percent as recently as 1972 (Brac, 2008), indicates that Bangladesh's performance in terms of overall literacy and gender parity is better than Pakistan's. Looking at the limited progress of Pakistan, it is easy to conclude that this trend will continue, making the achievement of a 100 percent literacy rate target nearly impossible in the coming decades.
Pakistan offers a thought provoking case where the relationship between poverty and child’s activities may be more complicated than in many other nations. This complexity demands an in-depth evaluation in order to help develop sustainable solutions to low literacy rates and low levels of human capital formation. In 2005 Pakistan had the third fastest growing economy in the world, and over the last 6 years its average annual growth rate was 6.6 percent (G.O.P., 2008), although Human Development Index (HDI) showed that this growth has failed to improve performance on HDI criteria. In 2003 Pakistan ranked 144th among 175 countries, the last position in the South Asian Region, slipping from the medium level to the low HDI level (Human Development Report, 2003). Therefore Pakistan provides an example of a country which has actually improved GDP growth without achieving corresponding
4
significant improvements in economic and social development. According to Education for All, Global Monitoring Report (2009), the performance of Pakistan in basic education enrollment is below satisfactory and if current trends continue, (there is evidence that the situation is actually getting progressively worse), Pakistan will host the second largest out-of-school population of children after Nigeria by 2015. That report also concluded that in Nigeria and Pakistan, poor governance with respect to education was responsible for limiting progress and keeping millions of children out of school.
In Pakistan, there are two main educational systems: a traditional religious education system and a modern secular school system. The former was the mainstay of education among Muslims of the subcontinent from the thirteenth century until the rise of the British power at the beginning in 1857. The latter refers to the secular school education system introduced by the British colonial government. In the beginning, the secular school education faced resistance from the Muslim population, who felt that it was dissonant with their religious views. Even now after many reforms, there are people who think that modern education rooted in the British system is dissonant with Islamic values.
Some research in Pakistan on participation in child activities such as secular education, religious education, and child labor found that household and community variables are important factors. Hazarika and Bedi (2002) suggested that reduction in education costs would have limited success in the abatement of child labor in rural Pakistan, and also found that child labor external to households and education costs were positively related, whereas internal household child labor was insensitive to changes in education costs. Hazarika (2001) found that in rural areas of Pakistan, distance from primary school was the only statistically significant variable in determining female primary school enrollment, whereas distance from middle school was a statistically significant determinant of male school enrollment. In the case of participation in religious education, Andrabi et al. (2006) explained that in the context of Pakistan prevalent theories associate this phenomenon with household attributes such as preferences for religious education over secular schooling. To the best of our knowledge, research efforts have not focused on the determinants of all possible child’s activities on a country-wide basis.
Some early studies from Pakistan and other parts of the world in this research area consolidated child’s activities into three categories (education, work, and leisure) without
5
treatment of alternative activities (Ersado, 2005; Edmonds, 2007; Hou, 2009). This is an inappropriate approach in the context of Pakistan because there are commonly at least 5 potential childhood activity categories; secular schooling, religious education, child labor, combined child labor and school attendance, and inactivity (leisure). Excluding any of these groups or merging them together does not adequately represent the situation in Pakistan. Another distinguishing feature of this study is that it includes unique survey data for children aged 5-14 years on all 5 of these activities.
This paper attempted to help address the following fundamental question: despite the fact that education enhances child productivity, why have decades of free or highly subsidized basic education not achieved the desired literacy rate targets in Pakistan? The main objective in this paper was to find the answer to this question by evaluating socioeconomic factors that affect demand for school education versus alternative activities for school aged children in Pakistan.
For purposes of this study, a unique dataset was collected exclusively from field surveys conducted in parts of four Pakistani provinces. The surveys were conducted in 43 villages from August through December, 2009. 963 heads-of-household were interviewed and data on a total of 2,496 children were collected using a multistage stratified random sampling technique. Site selection was based on population, literacy rates, HDI index, and the geographical area of each province. This data can contribute to related research by shedding light on the dynamic aspects of child’s education and alternative activities in Pakistan.
2 The Model
The decision to participate in child’s activities is simultaneous in nature. Hence, a simple analytical model presented by Edmonds (2007) was modified and used by this study to analyze the factors affecting this decision making process. Before presenting the model it is worth mentioning that in utility maximizing unitary household models, heterogeneity exists because of differences in household variables (income, education levels, age, and perceptions of school education), individual child variables (age and gender), and community variables (school quality and labor market). The symbols “hh”, “ch”, and “com” are used to represent household, child, and community variables respectively. For simplicity we
6
modeled a household with1 parent, 1 child, and 2 time periods Sº and S*. The household i
utility representation is:
U(Sº,S*)
where, Sº is the current standard of living of the family with the given household, child, and community (hh, ch, and com) characteristics for a given period of time. The term S*
represents the future standard of living status of the child subject to the activity decision in the original period Sº. The decision of the parents regarding child’s activities, on which the future living standard of the child will depend, is influenced by the hh, ch, and com variables. Edmonds (2007) considered four child’s activities: education, leisure and play, work outside the household, and work inside the household. In the context of Pakistan and according to the requirements of this study, five activities are considered: secular school attendance (Se),
religious education (Re), engagement in child labor (Cl,), combined child labor and secular
school attendance (Ws), and inactivity (Sin). Parents are responsible for the decision of which
of these child’s activities a child will participate in. For further simplification, the model can be formulated as:
Se + Re +Cl + Ws,+ Sin = 1
Edmonds (2007) named the fifth category as leisure and play; in the context of this study we label this as “inactivity”, meaning that compared to the other four categories they are not involved in a productive activity. In some cases children may be neglected because of their social or economic status. Although, due to poverty the inactivity may not be the actively chosen ‘activity’ by the parent, however may be the defacto choice and parent are forced to adopt due to economic or other constraints.
Another difference with the model presented by Edmonds is that in this modified model, in order to simplify it, we merged wage and non-wage child labor in to one category. Therefore, five child activities (secular education, religiouseducation1
1 When a child is enrolled full-time in a religious institution, but not if he/she goes for some time to study
religious education.
7
child labor and secular school attendance, and inactivity) are the basis of the theoretical framework and empirical analysis of the study.
Utility maximization strategy of the head of household with given constrains in the period Sₒ will provide a relevant theoretical frame work to fulfill the needs of this study. By adding 1 more category in the context of Pakistan, this model should be able to explain the determinants of demand for secular education and alternative activities, with a given set of independent variables that describe household, child, and community characteristics.
The current standard of living of each household Sº can be captured by a linear homogenous production function that depends on current consumption c, and input of the child to the household T.
Sº = f (c, T)
The standard of living of the child in the next generation will depend on the degree of human capital formation in the current period. Human capital formation will depend on the amount of time spent in formal education versus alternative activities, and is positively related with secular education. The child welfare production function can be specified as follows:
S* = f (Se )
When a child participates in secular education, in addition to direct costs there are also opportunity costs and inherent time constraints. The opportunity cost of education is the remuneration that a child foregoes while attending either a secular school or a madrassa2
c = Y + wCl - eSe
for religious education. The cost of schooling denoted by eSe is the forgone consumption by
the household in the period Sº. In contrast, if the child is working, this will enhance household consumption by wCl, in the period Sº. With the given income of Y, the
consumption function of the household is given by:
8
Where w is the wage rate? And the household standard of living is given by Sº = f (c, T), the overall consumption of the household in the current time period Sº with the time input of available child is given by:
Sº = f [(Y + wCl - eSe), T]
In this situation, parents will choose an activity for their child depending on the marginal utility of each alternative activity. The parent’s utility maximization equation is given by:
Max U(S°,S*) = Max USe, Re, Cl, Ws, Sin [S(Y + wCl - eSe,T), S*(Se)]
Subject to:
Se + Re +Cl + Ws,+ Sin = 1 and Se ≥ 0 Re≥ 0 Cl ≥ 0Ws,≥ 0Sin≥ 0
If a child goes to school:
e C S U Se U Se ∂ ∂ ∂ ∂ + ≥ ∂ ∂ ∂ ∂ = = S* S * S 1 ϑ
In this case, parent’s marginal utility from the foregone consumption as a result of schooling costs and marginal utility of the time ϑ is at least less than the parent’s marginal utility gained through human capital formation of their child from an additional year of secular school education.
If a child participates in religious education:
e C S S U U ∂ ∂ ∂ ∂ + ≥ ∂ ∂ ∂ ∂ = = ϑ Re * S * S 1 Re
If a child is engaged in child labor:
e C S S U Se U Cl ∂ ∂ ∂ ∂ + ≤ ∂ ∂ ∂ ∂ = = S* ϑ * S 1
If a child is engaged in labor and attending secular school:
e C S S U Ws U Ws ∂ ∂ ∂ ∂ + ≥ ∂ ∂ ∂ ∂ = = S* ϑ * S 1 If a child is inactive:
9 e C S S U Sin U Sin ∂ ∂ ∂ ∂ + ≥ ∂ ∂ ∂ ∂ = = S* ϑ * S 1
Marginal utilities of schooling and alternative activities depend on a vector of different factors that can be separated into three groups; household, child, and community variables. Thus, the structural form of the equation is specified as follows:
YSe, Re, Cl, Ws, Sin = f (hh, ch,com)
The detail description of the selected household, child, and community variables used in this study are given in the Table 1.1. The empirical analyses in this paper were based on the childhood activity choice equation stated above. Along with descriptive analysis, a multinomial probit (MNP) model was also used to capture all possible child’s activities at the same time and analyze the relationship of child’s activities (response variables) with the explanatory variables.
We had two reasons for the choice of MNP from the family of models which can be used for the discreet choice models analysis. First, the decision of childhood activity is simultaneous; one needs a multinomial model to explain the determinants of the childhood activity. Second, MNP does not impose the independence of irrelevant alternatives (IIA) assumption (Greene, 2003). The IIA property imposes the restriction that the relative odds of selecting between any two activities should be independent of the number of alternatives. However in reality this is not the case regarding the choice of childhood activity. For example, if there is a legal ban on child labor, then the relative odds of choosing religious education, secular schooling, or inactivity will change. In the same way, a legal ban on religious education or other activity would also influence the relative odds of choosing alternatives.
10
Table 1.1 Details of the variables
Des. No. Variable Details
Dep
en
de
nt 1. Child activity
1 = secular school attendance 2 = religious education 3 =child labor 4 = working and attending school 5 = inactivity Ho us eho ld v ar ia bl es
2. lndpcainc Log value of daily per-capita household income
3. hhhedu Years of formal education successfully completed by the head of household
4. hhhage Age of the head of household
5. FIP (categorical) Future income perceptionof the head of household
1 = disagree 2 = ambivalent 3 = agree
6. RCP (categorical) Religious compatibility perceptionof the head of household
1 = dissonant 2 = ambivalent 3 = compatible
7. rmdecm (dummy) Role of child's mother in decision making; 1 = if mother has a role in decision making
Ch. var
8. chage Age of the child
9. chgend (dummy) Gender of the child; 1 = if child is a female
Co m m uni ty va ria bl es
10. resgap Average annual rest gap between nearest public and private schools
11. disdistcap Distance from the district capital
12. rural (dummy) Location of the area; 1 = for rural areas
These relationships were also confirmed by the results of a Hausman Specification test. Due to the facts that childhood activity is a behavioral outcome and that behavioral phenomena sometimes violate IIA assumptions, multinomial logistic estimations are suspect (Dow and James, 2004). Arguably MNP should be the benchmark methodology in the study of child’s activities such as education and other alternatives.
The model becomes:
(
)
∫ ∫
∞ − − ∞ − − − = = 1 1 1 1 1 , 1..., ..., .... ) Pr( x ij i x ij i e de e e f j ity childactiv j β βWhere j = 1 is attending secular school, j = 2 is religious education, j = 3 is child labor, j = 4 is the combination of secular school attendance and child labor, and j = 5 is inactivity.
Moreover X is a vector of the factors (household [hh], child [ch], and community [com]) influencing the parent's decision of childhood activity options and i = 1……….n.
11
3 Description of the variables
Table 1.1 shows details of the variables selected for analysis. The selection of variables was based on relevant theory and comparison of post analysis estimation (AIC [Akaike Information Criterion] and BIC [Bayesian Information Criterion]) values for alternative models. A summary of the descriptive statistics for these variables is included in Table 1.9 in the appendix.
4 Results and Discussion
4.1
Descriptive Analysis
Prior to the econometric analysis, descriptive analyses were used to observe relationships of child activities with response variables of different occurrences in child gender, household income, head-of-household education, perception of school education, and demographic category.
4.1.1
Child’s activities
In order to describe the discrepancy of child’s activities among relevant variables, the data was disaggregated by age, gender of the child and on the basis of urban versus rural settings. On the basis of age, children were divided into two age groups, ages 5-9 and ages 10-14. The data summary provided in Table 1.2 show that the larger gap between school enrollment rates for male and girls in the both age groups was associated with a rural setting.
In the “secular school attendance” category, enrollment rates for female children are slightly higher than those of male children in urban areas. The percentage of children attending
madrassa for religious education is higher for both male children and female children in rural areas, particularly for the 5-9 age groups. In the “child labor” category, the rates are higher among female children, most of who were engaged as non-paid family workers. This is especially true for the 10-14 age groups in rural areas. In the “combined child labor with secular school attendance” category, the rates of male students are higher than female students, with slightly higher levels in rural areas. For the “inactivity” category rates for both genders were higher in the 5-9 age groups and in rural areas.
12
Table 1.2 Summary of child’s activities survey data by age, gender, and demography
Child activity Male Urban Female Male Rural Female
Age
5-14 Age 5-9 10-14 Age 5-14 Age Age 5-9 10-14 Age 5-14 Age Age 5-9 10-14 Age 5-14 Age Age 5-9 10-14 Age Secular school
attendance (73.61) 343 (83.11) 182 (65.18) 161 (73.95) 335 (80.90) 144 (69.45) 191 (50.90) 451 (59.64) 232 (44.06) 219 (41.82) 289 (54.45) 159 (32.58) 130
Religious education (9.23)
43 (10.05) 22 (8.50) 21 (8.00) 33 (6.18) 17 (8.99) 16 (16.67) 165 (25.40) 107 (10.12) 58 (16.79) 116 (25.00) 73 (10.78) 43
Child labor (either for employer or self-employed)
(6.44)
30 (2.28) 5 (10.12) 25 (14.35)65 (6.18) 11 (19.64) 54 (11.96) 106 (3. 60) 14 (18.51) 92 (33.57) 232 (11.30) 33 (49.87) 199
Working and attending
school (8.58) 40 (0.46) 1 (15.79) 39 (2.87) 13 (0.00) 0 (4.73) 13 (15.12) 134 (2.57) 10 (24.95) 124 (4.05) 28 (0.34) 1 (6.77) 27
Inactivity (2.15)
10 (4.11) 9 (0.40) 1 (1.55) 7 (3.93) 7 (0.00) 0 (3.39) 30 (6. 68) 26 (0.80) 4 (3.76) 26 (8.90) 26 (0.00) 0
Total (100)
466 (100) 219 (100) 247 (100) 453 (100) 178 (100) 275 (100) 886 (100) 389 (100) 497 (100) 691 (100) 292 (100) 399
Source: survey data 2009
13
4.1.2
Child’s activities versus household income
For the descriptive analysis of the relationship between household daily per-capita income and child’s activities, income was divided into six categories -Y1 to Y6 - in consecutive order.
Hence Y1 and Y6 represent households with daily per-capita income of less than 0.50 $ and
more than 1.75 $ respectively. The data summary in Table 1.3 shows the relationship between childhood activity choice and household per-capita income. The rates of school attendance increased along with per-capita household income from 27.57 to 77.01 percent from Y1 and Y6. Religious education rates decreased as income increased, except in the
highest income group where they rose again. The incidence of child labor decreased with increases in per-capita household income from 28.15 percent in the lowest income category to 6.47 percent in the highest. The rates for combined child labor and school attendance also declined as per-capita household income increased, reaching only 3 percent in the highest income group Y6.The highest rates of inactive children were in the lowest income group, and
also decreased with increased income.
Table 1.3 Child’s activities and daily per-capita household income.
Child activity Y Household per-capita income in US $
1 Y2 Y3 Y4 Y5 Y6 Total
Secular school attendance (27.57)
94 (44.33) 262 (58.11) 258 (65.55) 234 (71.43) 225 (77.01) 345 (56.81) 1,418
Religious education (19.65)
67 (16.75) 99 (14.64) 65 (10.36) 37 (9.21) 29 (13.39) 60 (14.30) 357
Child labor (either for employer
or self-employed) (28.15) 96 (23.18) 137 (16.22) 72 (15.69) 56 (13.65) 43 (6.47) 29 (17.35) 433
Working and attending school (13.78)
47 (11.34) 67 (10.36) 46 (6.72) 24 (5.71) 18 (2.90) 13 (8.61) 215
Inactivity (10.85)
37 (4.40) 26 (0.68) 3 (1.68) 6 (0.00) 0 (0.22) 1 (2.92) 73
Total (100)
343 (100) 591 (100) 442 (100) 357 (100) 315 (100) 448 2,496 (100)
Source: survey data 2009
Note: Numbers in parentheses are percentage values
Y1, Y2,Y3,Y4,Y5,and Y6 denote incomes levels (in $) when household per-capita income is (< 0.5), (≥ 0.5
& < 0 .75), (≥ 0.75 & < 1.00), ( ≥ 1.00 & < 1.25), (≥ 1.25 & < 1.75), and (>1.75) respectively Amounts in US dollars (US $ @ Rs. 80.85)
14
4.1.3
Child’s activities versus head-of-household education
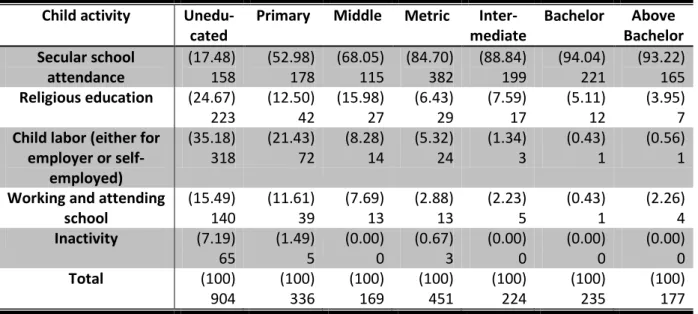
For the comparison of child’s activities with education levels, education is divided into 7 levels based on the number of years of successfully completed secular education by the head-of-household. The labels and criteria for each of the seven education levels are explained below the table. Table 1.4 shows the results of a bivariate analysis of the child’s activities and head-of-household education level. There is a clear positive relationship between rates of secular school attendance and increased education levels. All other child’s activities such as religious education, child labor, working and attending school, and inactivity exhibited a negative relationship with increased head-of-household education. More detailed parametric analyses were needed to gain insight from the data that would offer concrete conclusions useful for the consideration of effective policy measures.
Table 1.4 Child’s activities and head-of-household education
Child activity Unedu-
cated Primary Middle Metric mediate Inter- Bachelor Bachelor Above Secular school
attendance (17.48) 158 (52.98) 178 (68.05) 115 (84.70) 382 (88.84) 199 (94.04) 221 (93.22) 165
Religious education (24.67)
223 (12.50) 42 (15.98) 27 (6.43) 29 (7.59) 17 (5.11) 12 (3.95) 7
Child labor (either for employer or
self-employed)
(35.18)
318 (21.43) 72 (8.28) 14 (5.32) 24 (1.34) 3 (0.43) 1 (0.56) 1
Working and attending
school (15.49) 140 (11.61) 39 (7.69) 13 (2.88) 13 (2.23) 5 (0.43) 1 (2.26) 4
Inactivity (7.19)
65 (1.49) 5 (0.00) 0 (0.67) 3 (0.00) 0 (0.00) 0 (0.00) 0
Total (100)
904 (100) 336 (100) 169 (100) 451 (100) 224 (100) 235 (100) 177
Source: survey data 2009
Note: Numbers in parentheses are percentage values
Uneducated = when head of household’s years of successful school education is 0 Primary = when head of household’s years of successful school education are > 0 and ≤ 5 Middle = when head of household’s years of successful school education are > 5 and ≤ 8 Metric = when head of household’s years of successful school education are > 8 and ≤ 10 Intermediate = when head of household’s years of successful school education are > 10 and ≤ 12 Bachelor = when head of household’s years of successful school education are > 12 and ≤ 14 Above Bachelor = when head of household’s years of successful school education are 14 or more
15
4.1.4
Child’s activities and head-of-household perceptions of
school education
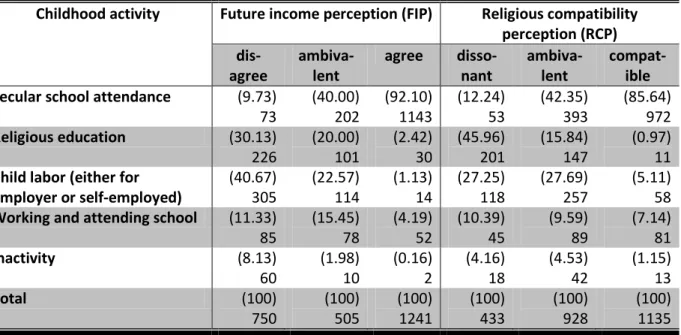
Parental perception regarding school education was measured by asking closed-ended questions about what impacts parents expected school education to have on the child’s future earnings (Future Income Perception [FIP]) and of the compatibility of school education with religious values (Religious Compatibility Perception [RCP]). FIP was measured by responses to questions such as: “Do you think that acquiring a school education will ensure greater future income for your child as compared to all other available alternatives?” RCP was measured by responses to questions like: “Do you think school education is compatible with your religious values?” Each column includes the children participating in each activity from households that are either disagreeing, ambivalent, or agree with the survey question. Table 1.5 includes a summary of children participating in each activity based on columns representing the parental responses to the survey questions.
The results indicate distinct trends in child’s activities based on parents FIP and RCP. According to the theory of human capital, the choice of levels of education depends on returns on investment (Becker, 1964). Parents will only send their children to school as long as they expect a future gain from this investment. Survey results for FIP show that 40.67 and 30.13 percent of the children of parents who did not agree that secular education would have a positive effect on future income, engaged in child labor and religious education respectively. In households that agreed that secular education has a positive effect on future income, 92.10 percent of the children attended school.
Approximately 30 percent of the children were from households that viewed secular education as inconsistent with their faith, 20 percent were from households with an ambivalent opinion, and 50 percent from households that perceived secular education as consistent with their faith. The results show that 46 percent of the children from households that disagreed that secular education is consistent with faith were sent to madrassah, as were 15.84 percent of the children of parents who thought that school education is neither dissonant nor compatible with their religious faith. On the other hand, 86 percent of children from households that perceived that secular education is consistent with their faith were attending school.
16
Table 1.5 Child’s activities and head-of-household perception of school education regarding future income and religious compatibility
Childhood activity Future income perception (FIP) Religious compatibility perception (RCP)
dis-agree ambiva-lent agree disso-nant ambiva-lent compat-ible
Secular school attendance (9.73)
73 (40.00) 202 (92.10) 1143 (12.24) 53 (42.35) 393 (85.64) 972
Religious education (30.13)
226 (20.00) 101 (2.42) 30 (45.96) 201 (15.84) 147 (0.97) 11
Child labor (either for
employer or self-employed) (40.67) 305 (22.57) 114 (1.13) 14 (27.25) 118 (27.69) 257 (5.11) 58
Working and attending school (11.33)
85 (15.45) 78 (4.19) 52 (10.39) 45 (9.59) 89 (7.14) 81
Inactivity (8.13)
60 (1.98) 10 (0.16) 2 (4.16) 18 (4.53) 42 (1.15) 13
Total (100)
750 (100) 505 (100) 1241 (100) 433 (100) 928 (100) 1135
Source: survey data 2009
Note: Numbers in parentheses are percentage values of children participating in each activity from households that disagree, are ambivalent, or agree with the survey question
4.1.5
Justification of childhood activity selection
Results presented in this subsection are organized according to the responses to open-ended questions regarding the head-of-household's reasons for choosing particular child’s activities. Responses were grouped according to three broad categories; gender issues, religious and institutional issues, and pecuniary issues. Table 1.6 includes the descriptive summary of reasons given by the head-of-household for activity choices. Among households that chose to have their daughters attend secular school, 21.96 percent did so because the school was located near home and 25.64 percent did so because classes were taught by women. In Pakistan female children of high school age observe purdha3
3 Requirement for women to cover their bodies and conceal their form
and have restricted mobility, especially in rural areas (Khan, 2000; Sathar et al., 2003). Thus, the presence of girl schools nearby and qualified female teachers in the school were considered gender issues important to the decision to have daughters attend secular school, similar to the findings of Hou (2009) and Hazarika (2001). On religious and institutional issues, it is evident that 39.55 percent of male children and 22.12 percent off male children attending school were in
17
private schools because their parents were not satisfied with the educational services of public schools. With regard to pecuniary issues, 47.60 percent of the male children and 30.29 percent of male children attending school had parents that identified they were unable to afford the cost of private schools. The data summary indicates that more boy children were given the opportunity to participate in secular education than girl children in the study area.
In the case of children participating in religious education, 14.77 percent of the male children came from households that believed that secular school education is not appropriate for female children. The most commonly cited reason for sending children to
madrassah in households with both boy students (58.65%) and girl students (42.95%) was because of the lack of religious education in secular schools. Only 15.38 percent of the male children and 8.72 percent of male children participating in religious education had parents who believed that the quality of education in secular schools was poor in their area. Among those in religious education 26.17 percent of the female children and 9.13 percent of the male children had parents who considered this type of education important for their children. On pecuniary issues, almost 16 percent of the male children and 3.37 percent of female children attending religious school came from households that could not afford public and private schools.
The descriptive summary for child labor shows that most households (92%) that chose this activity for female children did so because of gender issues while only 7.41 and 1.34 percent made this decision because of institutional or pecuniary issues respectively. Most of the male children (62.5%) that engaged in child labor came from households that cited pecuniary issues for this decision, followed by 37.50 percent based on institutional issues. Most of the female children were engaged in child labor.
Among children that both worked and attended secular school, most of the male children (97.42%) and female children (70.73%) came from households that identified pecuniary issues for that decision. This supports the perception that child labor is associated with income level.
Among inactive children, 33.33 percent of female children and 12.50 percent of male children came from households that cited gender and institutional issues respectively for
18
that decision. For the rest of the children, pecuniary issues were indicated as the reason for choosing inactivity.
19
Table 1.6 Reasons given by the head-of-household for the selected activities of their children
Reason for the choice of the child activity Secular school
attendance Religious education Working Working & Schooling Inactivity
Male Female Male Female Male Female Male Female Male Female
Ge nd er I ss ue s Close to home (8.19) 65 (21.96) 137 (0.96) 2 (3.36) 5 (0.00) 0 (0.00) 0 (0.00) 0 (7.32) 3 (0.00) 0 (0.00) 0 Female teachers (2.39) 19 (25.64) 160 (0.00) 0 (0.00) 0 (0.00) 0 (0.00) 0 (0.00) 0 (0.00) 0 (0.00) 0 (0.00) 0 Male teachers (2.01) 16 (0.00) 0 (0.00) 0 (2.68) 4 (0.00) 0 (1.01) 3 (0.00) 0 (0.00) 0 (0.00) 0 (0.00) 0 Learning house work important for
female children (0.00) 0 (0.00) 0 (0.00) 0 (0.00) 0 (0.00) 0 (68.64) 204 (0.00) 0 (21.95) 9 (0.00) 0 (0.00) 0 Schooling is not good for female
children (0.00) 0 (0.00) 0 (0.00) 0 (14.77) 22 (0.00) 0 (21.55) 64 (0.00) 0 (0.00) 0 (0.00) 0 (33.33) 11 Re lig io us a nd In sti tu tio na l Is su es
High quality of education (in private
schools) (39.55 ) 314 (22.12) 138 (0.00) 0 (0.00) 0 (0.00) 0 (0.00) 0 (0.00) 0 (0.00) 0 (0.00) 0 (0.00) 0 Low quality of schooling in the area (0.00)
0 (0.00) 0 (15.38) 32 (8.72) 13 (37.50) 51 (7.41) 22 (0.00) 0 (0.00) 0 (0.00) 0 (0.00) 0 No religious education in schools (0.00)
0 (0.00) 0 (58.65) 122 (42.95) 64 (0.00) 0 (0.00) 0 (0.00) 0 (0.00) 0 (0.00) 0 (0.00) 0 Religious education is important for
the child (0.00) 0 (0.00) 0 (9.13) 19 (26.17) 39 (0.00) 0 (0.00) 0 (0.00) 0 (0.00) 0 (0.00) 0 (0.00) 0 Pe cu ni ary Issu es
Can't afford public schools (0.00)
0 (0.00) 0 (12.50) 26 (1.34) 2 (8.82) 12 (0.00) 0 (0.00) 0 (0.00) 0 (75.00) 30 (42.42) 14 Can't afford private schools (47.60)
378 (30.29) 189 (3.37) 7 (0.00) 0 (2.94) 4 (0.00) 0 (0.00) 0 (7.32) 3 (10.00) 4 (3.03) 1 Earning money is important for the
family (0.00) 0 (0.00) 0 (0.00) 0 (0.00) 0 (13.24) 18 (0.34) 1 (28.16) 49 (29.27) 12 (0.00) 0 (0.00) 0 To support his/her school
expenditures (0.00) 0 (0.00) 0 (0.00) 0 (0.00) 0 (0.00) 0 (0.00) 0 (18.97) 33 (21.95) 9 (0.00) 0 (0.00) 0 Working in his own business/farm (0.00)
0 (0.00) 0 (0.00) 0 (0.00) 0 (37.50) 51 (0.00) 0 (50.57) 88 (12.19) 5 (0.00) 0 (0.00) 0
Others (0.25)
2 (0.00) 0 (0.00) 0 (0.00) 0 (0.00) 0 (1.01) 3 (2.58) 4 (0.00) 0 (15.00) 6 (21.21) 7
Total (100)
794 (100) 624 (100) 208 (100) 149 (100) 136 (100) 297 (100) 174 (100) 41 (100) 40 (100) 33 Source: Survey data 2009 Note: Numbers in parentheses are percentage values
20
4.2
Multinomial Probit Model results
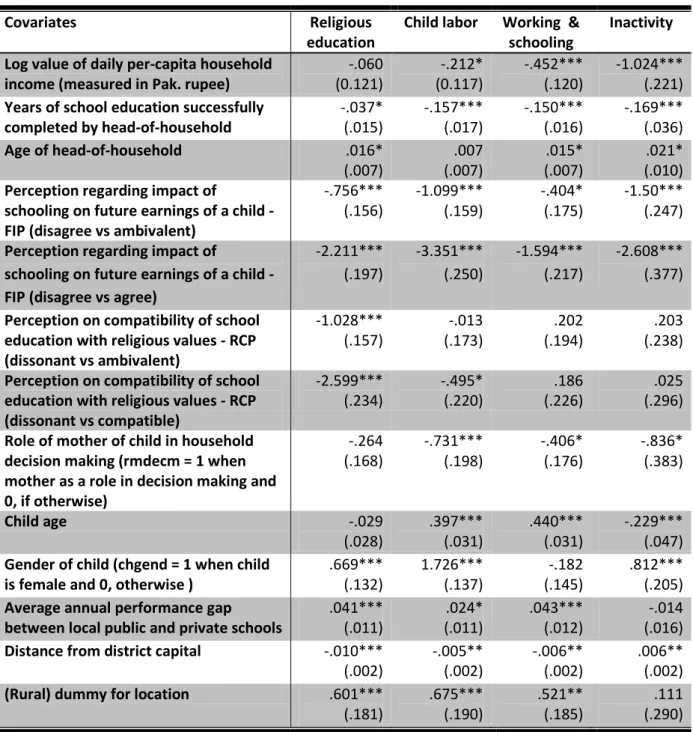
In this part of the analysis, the outcome measure was the probability of the chosen childhood activity and the relationship of that choice to household, child, and community variables. The MNP estimates of the determinants of household choice of childhood activity are presented in Table 1.7. The category of secular school attendance was omitted because it is the base outcome with which the probabilities of estimated coefficients of the other activities are compared. The choice of omitted category does not change the basic results; it only changes the basis of reference for the interpretation of results.
The MNP model coefficients express the amount of change in the z-score or probit index for each unit of change in the predictor. The sign of each coefficient describes the effect of each variable on participation in that activity relative to the base outcome of attending secular schooling. The daily per-capita income results show that income played a statistically significant role for inactivity, working and attending school, and child labor. Hence, an increase in the daily per-capita income of the household decreased the probability of participation in these three activities as compared to secular schooling. Apart from participation in religious education, all other activities have estimated coefficients that are statistically significant, with higher negative coefficient values for inactivity, followed by working and secular school attendance, and child labor.
Results also show that the education level of the head-of-household played an important role in enhancing the probability that children attend secular school. An increase in head-of-household education decreased the probability of participation in the other activities. The significant and positive coefficients for the age of the head-of-household indicate that older parents were more likely to choose activities other than attending secular school. The head-of-household’s age effect was not statistically significant with regard to child labor. For FIP, the response disagree was used as the reference category (among the 3 options of disagree, ambivalent, and agree). For both perceptions the results could be explained by dummy variables. In the first row of FIP perception, the results compared are for disagree versus ambivalent, whereas in the second row of FIP disagree is compared with agreeing. Statistically significant FIP results show that any positive change (from disagreement to agreement) in this perception would decrease the probability of a child participating in
21
alternatives to secular school attendance. A comparison of the coefficients for alternative activities shows that these effects were greater for child labor, followed by inactivity and religious education.
Table 1.7 Multinomial probit coefficient estimates of childhood activity choices
Covariates Religious
education Child labor Working & schooling Inactivity Log value of daily per-capita household
income (measured in Pak. rupee) (0.121) -.060 (0.117) -.212* -.452*** (.120) -1.024*** (.221)
Years of school education successfully
completed by head-of-household -.037* (.015) -.157*** (.017) -.150*** (.016) -.169*** (.036)
Age of head-of-household .016*
(.007) (.007) .007 (.007) .015* (.010) .021*
Perception regarding impact of
schooling on future earnings of a child - FIP (disagree vs ambivalent)
-.756***
(.156) -1.099*** (.159) -.404* (.175) -1.50*** (.247)
Perception regarding impact of
schooling on future earnings of a child - FIP (disagree vs agree)
-2.211*** (.197) -3.351*** (.250) -1.594*** (.217) -2.608*** (.377)
Perception on compatibility of school education with religious values - RCP (dissonant vs ambivalent)
-1.028***
(.157) (.173) -.013 (.194) .202 (.238) .203
Perception on compatibility of school education with religious values - RCP (dissonant vs compatible)
-2.599***
(.234) -.495* (.220) (.226) .186 (.296) .025
Role of mother of child in household decision making (rmdecm = 1 when mother as a role in decision making and 0, if otherwise)
-.264
(.168) -.731*** (.198) -.406* (.176) -.836* (.383)
Child age -.029
(.028) .397*** (.031) .440*** (.031) -.229*** (.047)
Gender of child (chgend = 1 when child
is female and 0, otherwise ) .669*** (.132) 1.726*** (.137) (.145) -.182 .812*** (.205)
Average annual performance gap
between local public and private schools .041*** (.011) (.011) .024* .043*** (.012) (.016) -.014
Distance from district capital -.010***
(.002) -.005** (.002) -.006** (.002) .006** (.002)
(Rural) dummy for location .601***
(.181) .675*** (.190) .521** (.185) (.290) .111
< 0.1*, < 0.05**, and < 0.01*** Sources: survey data 2009
Note: The response variable "secular school attendance" is the base outcome category Numbers in parentheses are robust standard errors
In the case of RCP, dissonant was selected as the reference category. Similarly in the first row of RCP results the comparison is between dissonant versus ambivalent, and in the second row dissonant versus compatible. The RCP results show that the perception of
22
consistency between secular schooling and faith would decrease the probability of participation in religious education. The magnitude and significance levels of the estimated coefficients illustrate that the probability of choosing participation in religious education for their children was associated by the perception that school education is dissonant with religious values.
Survey results regarding the active participation of mothers in household decision making processes show that this factor had a negative effect on the probability of selecting any of the non-secular school activity options.
Multinomial probit estimates for child age show that as age increases, so does the probability of choosing to engage in child labor and combined work and school attendance. These results are consistent with national and international reports on education in Pakistan that found that secular school dropout rates increase with a child's age (see Andrabi et al 2006; LEAPS4
From the results on gender, being a girl significantly increased the probability of choosing child labor, followed by inactivity, and religious education. Female gender had a negative effect on the probability of engaging in combined work and secular schooling that was not statistically significant. These results are consistent with the findings of Hou (2009) that female children in Pakistan were more likely to be exploited as child workers at home.
2008; and UNESCO 2009). Most drop outs leave school before completing basic levels of education. With regard to religious education and inactivity, increases in the child's age had negative effects on the probability of choosing either of these activities. As children grow older, they often start working at home in non-wage child labor. This is especially true for the female children.These findings are in step with those of (Aslam 2009) as she reports that powerful social and cultural (demand-side) factors such as conservatism of attitudes toward women’s education and their labor market work-as well as supply-side constraints limit female children’ access to schools.
4Learning and Educational Achievement in Punjab Schools, a World Bank project with collaboration of Pomona
23
Positive and statistically significant results show that an increase in the performance gap between public and private schools increased the probability of participation in religious education, working and attending school, and child labor. There was not a statistically significant relationship between public versus private school performance gap and inactivity. The effects of location on the selection of child’s activities were measured by two variables, the distance from the district capital and whether households were located in an urban or rural area. Increased distance from the capital has a statistically significant but small negative effect on the probability on participating in religious education, child labor, and combined work and schooling, and a significant but small positive effect on the probability of inactivity. The location of the household in a rural setting had negative effects on all non-secular school attendance child’s activities, which were statistically significant for religious education, child labor, and combined work and schooling.
4.2.1
Marginal effects on activity selection
Table 1.8 includes the results of the marginal effect of explanatory variables on the probability of selected child’s activities. Results indicate that an additional percentage in daily per-capita income increased the probability of attending secular school by 0.033, while lowering the probability of other activities such as working in combination with secular schooling and inactivity by 0.027 and 0.028 respectively, when the other variables remain constant. Results for the marginal effects on the selection of alternatives to the secular education with respect to daily per-capita household income show that increased income were associated with increased secular school enrollment, and decreased combined working and secular schooling and inactivity. Increased income was not statistically significant to the selection of activities such as religious education and child labor. In the case of religious education, the coefficient is not statistically significant, providing weak support to the hypothesis that “only children in poor households enroll for religious education” (Singer, 2001). This is consistent with the conclusions of Andrabi et al., (2006) that at an aggregate level there is little difference between poor and rich households in the choice of religious education. These outcomes suggest that the category of childhood inactivity is associated with extreme poverty whereas there are fewer indications that poverty is the main reason for not sending children to school. There are also indications that, compared to “child labor,”
24
the category of “combined work and secular schooling” decisions were related to the financial status of households that believe that schooling is better for their child’s future productivities. These findings support the broader definition of child labor used in this study, and there was little evidence from the survey to support the “luxury axiom” hypothesis that children only work when their families are unable to meet their basic needs (Basu and Van de Walle, 1998).
The findings pertaining to child’s activities in relation to the level of education of heads-of-household revealed several insights. Keeping all other variables constant, an additional year of secular school education successfully completed by the head-of-household increased the probability of selecting both secular schooling and religious education enrollments by 0.012 and 0.006 respectively. Increased head-of household education also decreased the probability of choosing child labor, combined work and secular schooling, and inactivity by 0.009, 0.007, and 0.003 respectively. Looking at these findings, it appears that a head-of-household’s school education has a greater impact on the selection of child’s activities than income.These findings are in-line with the conclusions of Duryea and Kuenning (2003), who found that increasing the education of the head-of-household by two additional years had a greater effect on education and employment outcomes of children than a 20 percent increase in state wages or family income.
The FIP results show that improvement of the perception of the head-of-household had an inverse relationship with activities such as child labor, combined work and secular schooling, and inactivity. Keeping other variables constant, the probability of a child going to secular school increases by 0.428 if the head-of-household agreed that secular school education will increase the future financial productivity of that child. This perception decreased the probability of selecting activities such as religious education, child labor, combined work and secular schooling, and inactivity by 0.131, 0.244, 0.01, and 0.043, respectively.
These findings indicate the perception that secular school education is compatible with religious values, decreased participation in religious education. Keeping other variables constant, if the head-of-household holds this perception of compatibility with religious values, the probability of selecting religious education decreases by 0.302, compared to those who perceived that school education is dissonant with religious values.
25
If the mother of a child has a role in household decision making, the study findings indicate that while keeping other variables constant, the probability of a child attending secular school increased by 0.053 compared to households where mothers were not reported to have a significant role in decision making. Maternal decision making also decreased the probability of participating in child labor by 0.047.
Results pertaining to a child's age and participation in child’s activities also revealed statistically significant results. Keeping other variables constant, one additional year in the age of a child decreased the probability of attending secular school, religious education, and inactivity by 0.022, 0.023, and 0.012 respectively. Increased age of a child was also associated with increases in the probability of child labor and combined work and secular school attendance by 0.031 and 0.026 respectively.
The study results for the influence of the gender of a child show statistically significant results for secular school attendance, child labor, and combined work and secular school attendance. Keeping other variables constant, girls have 0.077 and 0.082 less probability respectively, of secular school attendance and combined work and secular school attendance compared to their male counterparts. In the case of child labor, the girls had a 0.154 higher probability of engaging in child labor compared to their male counterparts. Performance gaps between public and private schools contributed to the probability of choosing child labor and overall lower demand for secular school education. The study results are consistent with other reports that the quality of the public school education is deteriorating in Pakistan, as compared to private school education. Study results illustrate that keeping other variables constant, an additional unit increase in the performance gap (a decrease in the quality of public schools compared with the private schools or increase in the quality of private schools compared to public schools) decreased the probability of secular school attendance by 0.004. Keeping other variables constant, each 1 additional unit in performance gap increased the probability of combined working and secular school attendance and religious education by 0.003 and 0.002, respectively. Increased performance gaps are also associated with a decline in secular school enrollment and increased participation in religious education and combined work and secular school attendance.
26
One unexpected result of the performance gap between public and private schools was an associated decrease of inactivity by 0.001, although this association was not statistically significant when compared to secular school attendance as the base outcome (Table 1.7). The probability decrease of inactivity is statistically significant when participation in religious education is used as the base outcome category (see Table 1.10 in the appendix). This suggests that decreased probability of inactivity was due to increase in school performance related to the increase in participation in religious education.
27
Table 1.8 Marginal effects on the probability of selected childhood activity with respect to explanatory variables
Particulars Secular
School education Religious Child labor Working & schooling
Inactivity Log value of daily per-capita
income (measured in Pak. rupee)
0.033***
(0.011) (0.011) 0.0198 (0.009) 0.003 -0.027*** (0.009) -0.028*** (0.007)
Years of school education successfully completed by head of household 0.012*** (0.001) 0.006*** (0.001) -0.009*** (0.001) -0.007*** (0.001) -0.003** (0.001) Age of head-of-household -0.002* (0.001) (0.001) 0.001 (0.0006) 0.001 0.0007 (0.0005) 0.0004 (0.0003)
Perception regarding impact of schooling on future earnings of a child - FIP (disagree vs. ambivalent)
0.155***
(0.026) -0.038* (0.02) 0.106*** (0.020) 0.025 (0.015) -0.036*** (0.0098)
Perception regarding impact of schooling on future earnings of a child - FIP (disagree vs. agree)
0.428***
(0.034) -0.131*** (0.024) -0.244*** (0.023) -0.01*** (0.445) -0.043*** (0.0098)
Perception on compatibility of school education with religious values - RCP (dissonant vs. ambivalent)
0.106***
(0.025) -0.186*** (0.026) 0.055*** (0.013) 0.006 (0.011) 0.019*** (0.006)
Perception on compatibility of school education with religious values - RCP (dissonant vs. compatible)
0.174***
(0.029) -0.302*** (0.027) (0.018) -0.018 0.082*** (0.018) 0.029** (0.953)
Role of mother of child in household decision making (rmdecm = 1 when mother has role in decision making and 0 if otherwise)
0.053***
(0.015) (0.016) 0.015 -0.047* (0.019) -0.005 (0.014) -0.016 (0.011)
Child age -0.022***
(0.002) -0.023*** (0.002) (0.002) 0.031*** 0.026*** (0.002) -0.012*** (0.001)
Gender of child (chgend = 1 when child is female and 0 otherwise )
-0.077***
(0.011) (0.0107) 0.0007 0.154*** (0.009) -0.082*** (0.01) 0.004 (0.005)
Average annual performance gap between local public and private schools
-0.004***
(0.001) 0.003*** (0.001) (0.0009) -0.0003 0.002** (0.001) -0.0012** (0.0005)
Distance from district capital .0007*** (0.0002)
-0.0008***
(0.0001) -0.00002 (0.000) -0.0002 (0.0001) 0.0004*** (0.00006)
(Rural) dummy for location -0.063***
(0.016) 0.0301* (0.017) (0.169) 0.031* 0.013 (0.014) -0.0104 (0.008)
< 0.1*, < 0.05**, and < 0.01*** Sources: survey data 2009
28
Public and private education partnerships might be beneficial if there is a productive competition regarding the performance of educational institutions. The load sharing policy of a public and private partnership may reduce the educational gap between household income levels. This premise is also supported by the findings of “Learning and Educational Achievement in Pakistan Schools” (LEAPS, 2008). That report explained that children in the public schools performed significantly below curricular standards for common subjects and concepts at their grade-level when compared to private school students. That report also described finding both high and low performing schools in the same villages. Their empirical findings indicated that by the time children in private schools are in class 3, they are 1.5-2.5 academic years ahead of public school students. Further, they also found that school teachers employed by the government were more educated and better trained compared to private school teachers, even though student test scores were higher in private schools. That study also noted that private schools were not evenly distributed geographically as the public schools were, and private schools were not affordable to everyone, especially children from low income households.
The study results for demographic location show that, compared to urban areas, the probability of a child participating in child labor and religious education increased by 0.031 and 0.0301 respectively. Keeping other variables constant, compared with urban areas, the probability of secular school attendance decreased by 0.063 in rural areas.
4.2.2
Comparison of child’s activities between rural and urban areas
A comparative analysis of chosen child’s activities between urban and rural areas (Tables 1.11 and 1.12 in the appendix) found several relevant differences. In urban areas, household per-capita income was highly associated with increased secular school attendance and decreased combined work and secular school attendance and inactivity. In rural areas, an increase in daily per-capita household income was associated with decreased inactivity and combined work and secular school attendance, and to increased probability of participation in religious education. From the values of the coefficient and significance level, income had a greater influence on increased secular school attendance, and decreased combined work and secular school attendance and inactivity in urban areas compared to the rural areas. These findings contradict those of Ersado (2005) in the context of Nepal, Peru, and
29
Zimbabwe that poverty was the main cause of child labor and low rates of school enrollment in rural areas, due to the lack of support in urban areas.
The impact of education level of the head-of-household had similar effects on childhood activity selection in both urban and rural areas except with regard to combined work and secular school attendance, which was not statistically significant in rural areas. Results show that child labor was more common in rural areas compared to urban areas. Based on household perception data it appears that in urban areas the demand for school education was more inelastic compared to rural areas.
The gender of a child also had different effects on probability of childhood activity selection between urban and rural areas. The probability of a girl attending secular school decreased and the probability of engaging in child labor was higher in rural compared to urban areas.
4.2.3
Comparison of child’s activities selection by gender
The comparison of childhood activity selection by gender (see Tables 1.13 and 1.14 in the appendix) shows that the associations of household daily per capita income with activity choices were only statistically significant with increases in the probability of secular school education and in decreases of the probability of combined work and secular school attendance in the case of male children. Forgirls, increased head-of-household education levels were associated with decreases in the probability of child labor, combined work and secular school attendance, and inactivity. The same trends can be observed for RCP. The role of mothers in decision making had a greater association with decreased probability of child labor for female children.
Results for public versus private education performance gap show that increases in this gap were associated with increases in the probability of combined work and secular school attendance for male children, and with decreases in the probability of secular schooling for female children. Relative to urban areas the selected activity for female children was more likely to be combined work and secular school attendance as compared to male children. In the response variables presented in both tables, the variable FIP is missing for male children. The separate MLP analyses for male and female exhibited a problem in the case of male children. The reason for this discrepancy appears to be that parents treat male children