Short communication
A Web Map Service implementation for the visualization of
multidimensional gridded environmental data
J.D. Blower
*, A.L. Gemmell, G.H. Grif
fi
ths, K. Haines, A. Santokhee, X. Yang
Reading e-Science Centre, School of Mathematical and Physical Sciences, University of Reading, RG6 6AL, United Kingdoma r t i c l e i n f o
Article history:Received 5 December 2012 Received in revised form 9 April 2013
Accepted 29 April 2013 Available online 20 June 2013 Keywords:
Open Geospatial Consortium Web Map Service
NetCDF Gridded data Environmental science Visualization
a b s t r a c t
We describe ncWMS, an implementation of the Open Geospatial Consortium’s Web Map Service (WMS) specification for multidimensional gridded environmental data. ncWMS can read data in a large number of common scientific data formatsenotably the NetCDF format with the Climate and Forecast con-ventionsethen efficiently generate map imagery in thousands of different coordinate reference systems. It is designed to require minimal configuration from the system administrator and, when used in conjunction with a suitable client tool, provides end users with an interactive means for visualizing data without the need to download largefiles or interpret complex metadata. It is also used as a“bridging”
tool providing interoperability between the environmental science community and users of geographic information systems. ncWMS implements a number of extensions to the WMS standard in order to fulfil some common scientific requirements, including the ability to generate plots representing timeseries and vertical sections. We discuss these extensions and their impact upon present and future interop-erability. We discuss the conceptual mapping between the WMS data model and the data models used by gridded data formats, highlighting areas in which the mapping is incomplete or ambiguous. We discuss the architecture of the system and particular technical innovations of note, including the algorithms used for fast data reading and image generation. ncWMS has been widely adopted within the environmental data community and we discuss some of the ways in which the software is integrated within data in-frastructures and portals.
Ó2013 The Authors. Published by Elsevier Ltd.
1. Introduction
Many important environmental datasets take the form of large multidimensional grids, including the results of numerical simu-lations (e.g. weather, climate and ocean forecasts) and output from many types of remote sensing devices such as satellites. There is a strong need for these data to be used and interpreted by scientists, governments, industry and the general public, and data visualiza-tion plays a key role in aiding understanding (Fox and Hendler, 2011).
The Open Geospatial Consortium (OGC) publishes a suite of open standards for inter-community data exchange. The Web Map Ser-vice (WMS) specification (de la Beaujardiere, 2006) describes how a client (e.g. a web browser or desktop application) may request a
custom-generated, georeferenced image of a dataset from a server, together with associated metadata. Images from different Web Map Services can be precisely overlain in a Geographic Information System (GIS), permitting visualization and intercomparison (Zhao et al., 2012;Sun et al., 2012;Panagos et al., 2008). The use of WMS technology is partly driven by high-profile international interop-erability initiatives such as GEOSS (http://www.earthobservations. org) and INSPIRE (http://inspire.jrc.ec.europa.eu/).
Among the most widely-usedfile formats for newly-produced
gridded environmental data is NetCDF (Network Common Data Form,Domenico, 2011), together with the Climate and Forecast (CF)
metadata conventions (http://www.cfconventions.org/,Domenico
and Nativi, 2012), which provide semantic meaning and
georefer-encing information. However, other file formats such as GRIB
(GRIdded Binary, http://www.wmo.int/pages/prog/www/WDM/
Guides/Guide-binary-2.html) and HDF (Hierarchical Data Format, http://www.hdfgroup.org/) are also in wide use. These formats have many concepts in common, and can be harmonized through an abstraction layer known as the Unidata Common Data Model (CDM,Nativi et al., 2008) which is implemented as a Java library that can read all of these formats (and more) using a common *Corresponding author.
E-mail address:[email protected](J.D. Blower).
Contents lists available atSciVerse ScienceDirect
Environmental Modelling & Software
j o u r n a l h o m e p a g e : w w w . e l s e v i e r . c o m/ l o ca t e / e n v s o f t
1364-8152Ó2013 The Authors. Published by Elsevier Ltd. http://dx.doi.org/10.1016/j.envsoft.2013.04.002
Open access under CC BY license.
Application Programming Interface (API). However the CDM in-cludes several concepts that are not widely used in GIS (such as vertical coordinates based on pressure) and so most existing WMS
implementations (such as Mapserver, http://mapserver.org, and
GeoServer,http://geoserver.org) do not fully support many envi-ronmental datasets.
This paper describes ncWMS (http://ncwms.sf.net), an
open-source implementation of the WMS specification, compatible
with versions 1.1.1 (de la Beaujardiere, 2002) and 1.3.0 (de la Beaujardiere, 2006) of the specification. Early releases of the software have seen very wide adoption within the international environmental data community, forming a key component of systems for data visualization and access, and this paper de-scribes thefirst full official version (1.0), released in December 2012. We describe how ncWMS interprets and extends the WMS
specification to accommodate gridded environmental data
(Sec-tion2), we give some key features of the implementation (Sec-tion3), we provide some examples of user adoption (Section4) andfinally we draw conclusions and outline future directions of work (Section5).
2. Interoperability between WMS and gridded environmental data
In WMS, the essential unit of information is theLayer. Each Layer
can be displayed in a number of Styles, each associated with a
legend. Layers may be displayable or non-displayable and may be organized hierarchically. Three main operations can be performed
by standard WMS clients:GetCapabilitiesrequests an XML
docu-ment containing metadata on available Layers and other service capabilities;GetMaprequests a map image or animation according to the user’s choice of Layer, Style, geographic extent and resolu-tion; andGetFeatureInforequests more information about a specific geographic location, as represented by a specific pixel in a map image. Other operations can be defined.
In the CDM,Datasetsconsist of multidimensionalVariables, each of which is a displayable quantity, e.g. sea surface temperature. In NetCDF, metadata are recorded as key-value pairs that contain in-formation on georeferencing together with controlled terms (such as the CFstandard name), which describe the physical, chemical or biological quantity that the Variable represents.
Currently there is no single, well-defined way to serve gridded environmental data through a WMS interface. The following par-agraphs describe some of the most important design choices made in mapping between the data models of WMS and CF-NetCDF data,
making clear whether the choices arespecializationsof the WMS
specification, orextensionsto it. 2.1. Use of Layer nesting (specialization)
ncWMS uses Layer nesting to reflect the hierarchical relation-ship between environmental datasets and variables:
1. The top-level Layer represents the service as a whole. This is non-displayable and contains metadata that applies to all data in the services (e.g. supported coordinate reference systems). 2. The Layers at the next level represent the Datasets offered by
the server. These are also non-displayable.
3. The Layers at the lowest level of the hierarchy are displayable and represent the Variables. A single Layer may represent a composition of more than one Variable; e.g. a Layer may represent a vector quantity such as velocity, whose eastward and northward components are recorded in separate Variables (seeFig. 1).
2.2. Behaviour of GetFeatureInfo (specialization)
The format of the response of theGetFeatureInforequest is not constrained by the WMS specification. ncWMS uses this operation to allow the user tofind the data value represented by a given map
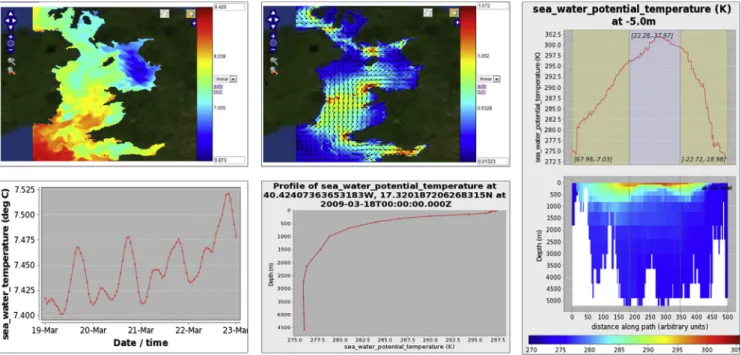
Fig. 1.Examples of visualizations generated by ncWMS, accessed through the Godiva2 web client. Clockwise from top left: (1) Map of sea surface temperature in the Irish Sea. The mapping of data values to colours can be changed by clicking on the colour scale bar or by editing the numbers at the extremes of the colour bar, employing the simple styling extensions that ncWMS implements (Section2). (2) Map of sea surface velocity in the Irish Sea. The eastward and northward components of velocity are stored as separate scalar
fields in the underlying NetCDFfiles, and ncWMS automatically combines them into a new Layer representing the total velocityfield. (3) Combined plot of a transect (above) and vertical section (below) showing sea water temperature along a doglegged path running roughly North-South through the Atlantic Ocean (using theGetVerticalSectionoperation, which is an extension to the WMS specification). (4) Vertical profile at a point (accessed throughGetVerticalProfile). (5) Timeseries at a point (accessed throughGetFeatureInfo).
pixel and to allow the generation of timeseries plots at a given point. These behaviours are distinguished by the use of the TIME dimension: if the user requests a single TIME in theGetFeatureInfo request, ncWMS returns the data value at that point; if the user requests a timerangethen a timeseries is returned, either as an image or a simple XML document, depending on the requested format.
2.3. Vertical and temporal dimensions (specialization/extension)
The WMS specification defines the ELEVATION and TIME
di-mensions, representing height above the ellipsoid and time respectively. Many more vertical and temporal dimensions are possible in the CDM, including pressure-based vertical coordinates and alternative calendar systems, such as the 360-day calendar frequently used in climate modelling. There is no widely-agreed method for encoding all CF coordinate systems as WMS custom dimensions, although this is an active area of discussion within the
OGC Met-Ocean Domain Working Group.1ncWMS currently makes
the practical compromise of overloading ELEVATION and TIME for these dimensions in order to allow third-party clients to access
these dimensions. It would be possible to define custom
di-mensions, as allowed by the WMS specification, although these
would not be compatible with most general-purpose WMS clients. However, the definition of custom dimensions is under discussion in the Met-Ocean Working Group and the approach in ncWMS may change in future according to their recommendations.
2.4. Styling (extension)
A standard WMS enumerates afinite number of Styles in which
images can be generated from Layers. These cannot be configured by the end user. Scientific users usually require moreflexibility, for example to control how data values map to the palette colours. In ncWMS, each Style corresponds with a colour palette, which is identified through an opaque identifier such as “greyscale”, “redblue” and“rainbow”. Vector layers (such as velocity fields) have a further set of Styles for representing vectors as arrows, overlain on top of the magnitude field (seeFig. 1). This can be achieved using the OGC Styled Layer Descriptor (SLD,Lupp, 2007) and Symbology Encoding (SE,Mueller, 2006) specifications, which provide the user with a great deal offlexibility; however it places significant burdens on the developers of clients. Therefore, to simplify the development of clients whilst addressing many of the use cases of visualizing gridded data, ncWMS implements a custom mechanism in which non-standard URL parameters are
employed to modify the pre-defined Styles and define the
map-ping of data values to colours from the requested palette. These non-standard URL parameters specify the data value range that is
spanned by the palette (COLORSCALERANGE ¼ min,max), the
number of colour bands required (NUMCOLORBANDS¼n) and
whether the spacing is linear or logarithmic (LOGSCALE¼true/
false). AGetLegendGraphicoperation is additionally defined (based on the SLD specification) that allows legends to be generated to match these custom styles. This approach has proven popular with users and client developers, who value the ability to manipulate styles in this simple manner.
2.5. Non-map plots (extension)
The WMSGetMapoperation is intended for producing images of
a two-dimensional horizontal extent of data. ncWMS generates
timeseries plots throughGetFeatureInfo(as described above) and implements custom operations for generating other types of visu-alization, including vertical profiles (GetVerticalProfile), transects (GetTransect) and vertical sections (GetVerticalSection)eseeFig.1for examples. Other approaches proposed by developers include over-loadingGetMapor defining a singleGetVisualizationoperation to encompass all visualization types; however, we believe that new operations can be defined more clearly and with less ambiguity than attempting to reuse the same operation for different purposes. These new operations do not break backward compatibility with the WMS standard, since they add new capability rather than changing defined behaviour. Standard clients will not, however, generally be able to take advantage of these operations (see Section4). 2.6. Serving metadata in JSON format (extension)
The WMS Capabilities document can be many megabytes in size, making it unwieldy to interpret in certain environments such as a web browser. Therefore, in addition to supporting the standard GetCapabilitiesrequest, ncWMS allows metadata to be served using
a non-standardGetMetadataoperation, which returns data in an
ad-hoc JavaScript Object Notation (JSON) format (for easy parsing in web browsers). Metadata can then be requested in a piecemeal, hierarchical fashion, avoiding the transfer of large documents. We also take advantage of this new mechanism for passing information that is not present in a standard Capabilities document, such as the units of measure for a Layer and a suggested scale range for colour palettes. The GetMetadata operation is exploited by the Godiva2 web client (Blower et al., 2009a), and by other custom-built clients, to enable fast loading of metadata (see Section4below).
3. Implementation
ncWMS is implemented as a Java web application, packaged as a
web archive (WAR) file for deployment in a standard servlet
container such as Apache Tomcat. Java was chosen as the imple-menting language because many environmental data providers already use Java server-side technology and because of the avail-ability of high-quality and powerful libraries such as Java-NetCDF
(http://www.unidata.ucar.edu/software/netcdf-java/, which
im-plements the Common Data Model) and Geotoolkit (http://www. geotoolkit.org, which can convert between many thousands of co-ordinate reference systems). The architecture of the ncWMS soft-ware is shown inFig. 2.
3.1. Generation of visualizations
The goal of ncWMS is to be able to generate a number of different visualization types (maps, transects, vertical sections etc.) efficiently from data held in differentfile formats and coordinate reference systems (CRSs). The algorithm used for extracting data and generating images proceeds as follows:
1. Calculate the real-world coordinates (in the user-requested CRS) of all the points for which we require data (e.g. all the pixels in an image, or all the points along the path of a transect). This is thetarget domain.
Loop through each point in the target domain:
2. Convert the point to WGS84 latitudeelongitude coordinates
using the Geotoolkit library;
3. Calculate the coordinates of the equivalent point in the source
data’s coordinate reference system using the Java NetCDF
libraries; 1 http://external.opengeospatial.org/twiki_public/MetOceanDWG/WebHome.
4. Find the index of the grid cell in the source data grid that contains the point, and store the mapping of the target domain point to the source grid cell index in a data structure called a PixelMap;
End loop.
5. Use the PixelMap to extract data from the source grid, using a strategy appropriate to the format of the source datafiles: see Fig. 3;
6. Convert the extracted data to an image by converting data values to colours. This is a fast and simple process.
Two caveats are noteworthy. In both steps 2 and 3, datum shifts are ignored because (i) the relevant empirical parameters are not always available for converting all CRSs to WGS84 coordinates and (ii) datum information is usually missing from CF NetCDFfiles. This can lead to geolocation errors of up to a few hundred metres. Secondly, this scheme does not implement any kind of interpola-tion: the resulting map images reproduce the shape of the source grid cells.
In the terminology ofBlower and Clegg (2011)this is a“ desti-nation-pull”algorithm. Other tools (e.g. Panoply,http://www.giss. nasa.gov/tools/panoply/, and Matplotlib, Hunter, 2007)
imple-ment “source-push” algorithms, which iterate over the entire
source grid and transfer information to the required target data structure. Source-push algorithms tend to be faster than destination-pull algorithms when the source data grid is smaller than (or equal in size to) the target domain (Blower and Clegg, 2011). However in the visualization of environmental data, source
data grids can be very much larger than the output image;Blower and Clegg (2011)demonstrate that the destination-pull approach
can significantly outperform source-push approaches for large
datasets. Scalability to large source datasets is a key aim of ncWMS. 3.2. Performance
Real-world performance depends on many different factors, notably the behaviour of the Java virtual machine, the server hardware and network bandwidth and latency. Within the scope of
the ncWMS application itself, profiling reveals that the
performance-limiting steps of the above algorithm are coordinate transformation (steps 2e4) and the extraction of data from disk (step 5). A full investigation of all the factors affecting performance is beyond the scope of this paper; we therefore confine ourselves here to a brief discussion of the optimizations we have implemented.
3.2.1. Coordinate transformations
In the general case, each of the three coordinate transformation steps (steps 2e4) needs to be executed for every point in the target domain (i.e.WHpoints for an image of sizeWH). However, if the source and target coordinate reference systems are equal (this is common in practice), steps 2 and 3 can be omitted; furthermore, step 4 is only executedWþHtimes to generate an image because the coordinate axes can be treated separately.
Step 4 can require, in the worst case, exhaustive search of the source grid, but this is never necessary in ncWMS. Forrectilinear source grids, in which the two horizontal coordinate axes are separable, the indices of the source grid cell can be found on each axis in turn by binary search (if the coordinate axis values are irregularly-spaced) or by simple linear algebra (if the axis values are regularly-spaced). Forcurvilinearsource grids (which are defined by explicitly recording the real-world coordinates of each grid cell), a simple spatial index based on a look-up table is used to speed up the search (Blower and Clegg, 2011).
3.2.2. Extraction of data from disk
The data-extraction step is commonly the slowest step in the process of generating images. Disk access is optimized in ncWMS by using a data-extraction strategy appropriate to the nature and location of the source data, as described in Fig. 3. However, the presence of data caches within the underlying operating system and server hardware also has a strong effect (seeFig. 4)ewe refer to these caches as“disk caches”.Fig. 4shows that it is possible to extract data from a very large dataset (162 million points) for the creation of a 256256 image tile in less than 400 ms, if disk caches are active and the“scanline”strategy is used. The process of turning the data array into an image is much quicker, taking around 30 ms under the same test conditions.
3.2.3. Caching within ncWMS
Many WMS clients, including the Godiva2 client (Blower et al., 2009a) that is bundled with ncWMS, aretilingclients that make GetMaprequests using afinite number offixed bounding boxes. This increases the scalability of the system as a whole by permitting repeated requests for the same image to be served from application-level caches. ncWMS therefore implements such a cache (see architecture diagram inFig. 2). Note that this cache holds data arrays, notfinal images: this allows the user to change the styling parameters of an image (e.g. the colour palette) without re-extracting the data from the sourcefiles, speeding up interactive visualization. Many system administrators choose also to imple-ment a tile cache on top of ncWMS, which can further increase performance and scalability.
Fig. 2.Outline architecture of the ncWMS software. From bottom to top: (1) Data and metadata are read from source data files using DataReaders. In most cases, the DefaultDataReader is used, which delegates most operations to the Java NetCDF li-braries and reads data from severalfile formats and OPeNDAP (Cornillon et al., 2003) services using the Unidata Common Data Model. For other file formats, custom DataReaders can be written. (2) Metadata are harvested and placed into a memory-resident metadata cache, which is periodically refreshed to keep in synchrony with the datafiles. Extracted data subsets are cached in afixed-size region of memory, overflowing to disk (using the ehcache library); see Section3.2.3. (3) Code in the Presentation Layer converts data and metadata into formats ready for transmission over the network. Images are rendered as PNG, GIF or JPEG and metadata are formatted using XML and JSON. (4) The HTTP Layer parses requests from web clients and marshals the responses. The Spring framework is used to provide modularity and to“wire”all the components of the system together.
3.2.4. Overall performance
The design goal of ncWMS was to be able to produce a 256256 map image from any data source (irrespective offile format or size) in less than 1 s. Experience with real deployments demonstrates that this is usually achieved even for large datasets, particularly in the common case in which the same datasets are accessed frequently and the disk caches are active. If data are served from a fast data source (e.g. a disk cache or a RAM disk) then ncWMS will
often be CPU-bound under heavy load. By contrast, if the data source is slow, then ncWMS will usually be i/o-bound. System ad-ministrators are therefore encouraged to use fast disks and multi-processor systems.
4. Usage and community adoption
ncWMS has been widely adopted by research institutes, gov-ernment agencies and private industry in Europe, the US and Australia (http://ncwms.sf.net). Data providers have used the
sys-tem to provide an interactive web-based “quick-view” tool for
giving their own users the capability to browse visually through their data holdings without the need to download or interpret large datasets. For example, ncWMS forms the basis of the View Service for the MyOcean project (www.myocean.eu), which provides ac-cess to operational oceanography data from European data pro-viders such as the UK Met Office and Mercator in France. Some data providers choose to implement their own custom graphical inter-face to ncWMS, taking advantage of the WMS extensions: seeFig. 5 ncWMS and the Godiva2 viewer have been adapted into plug-ins for the widely-used Unidata THREDDS Data Server (Signell et al., 2008;Blower et al., 2009b), which is used by organizations such as NOAA and the US Geological Survey for serving environmental data; the ncWMS/Godiva2 plug-ins allow all these datasets to be interactively browsed on the Web.
Many users employ standard GIS client tools to combine envi-ronmental data (from ncWMS) with other data sources, either on the web or the desktop. These clients are usually unable to access the extended capabilities of ncWMS beyond the standard WMS specification, but are still able to view metadata and generate map images. Unfortunately, many clients do not implement all aspects
of even the standard WMS specification, hampering
interopera-bility. For example, some clients do not understand Capabilities documents with nested Layers or do not support vertical or tem-poral dimensions.
Therefore, many users (especially scientists) access ncWMS servers through a specially-designed web-based client such as Godiva2 as an interactive visualization system for verifying and diagnosing the outputs of their latest simulations of ocean, atmo-sphere or climate (e.g.Gemmell et al., 2011). Feedback from these Fig. 4.Results of performance tests illustrating the effect of the data reading strategy
and the disk caches within the underlying operating system and hardware. Experiments were performed extracting a 256256 array of data covering the globe in latitudee longitude projection from a much larger dataset covering the globe at a resolution of 0.02(i.e. 162 million data points) in NetCDF-3 format (uncompressed). Each column represents the mean and one standard deviation offive trials, timing the data extraction process using Java’s System.nanoTime() function. The dark columns represent data extractions in which the underlying disk caches are not active (these experiments were preceded by a large amount of disk activity involving otherfiles, from which we assume that the data under test would have been evicted from the cache). The pale columns represent repeated consecutive reads from the same datafile, which we assume in-volves reading from the disk cache. The performance-enhancing effect of both the disk cache and the data reading strategy is clear. Experiments were performed on a Dell Latitude E6320 laptop with 8 GB RAM, an Intel Core-i7 (2.70 GHz) multicore processor and a 500 GB SATA 7200rpm disk drive, using an Oracle Java Virtual Machine, version 1.7.0_07. Code is available as supplementary material to this paper.
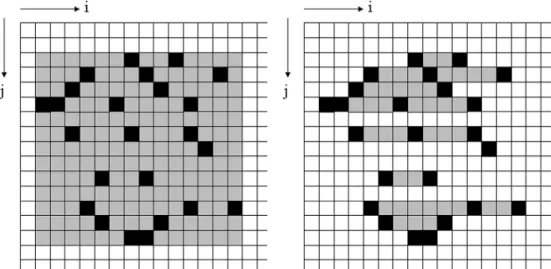
Fig. 3.Illustration of two different strategies for reading data from source arrays (see Section3.2.2). The grids represent the source data and the black grid cells represent the data required to populate the Target domain. The“pixel-by-pixel”strategy reads data from each individual black cell one-by-one, using a separate read operation for each required cell. The“bounding-box”strategy (left) reads all the black and grey cells in a single read operation; the grey cells are then discarded. The“scanline”strategy (right) uses a separate read operation for all cells with the samejcoordinate, on the assumption that each operation is reading a contiguous block of data from disk; again the grey cells are discarded. Wefind that the scanline strategy is usually optimal when individual read operations are cheap (i.e. the source data is held locally in an uncompressed format) or where source grids are very large (for which the bounding box strategy would require very large amounts of memory). The bounding-box algorithm is most useful where the data are held in a compressed format (such as HDF5 or NetCDF4), or where the data are held on a remote OPeNDAP server; in these cases, individual read operations carry a large overhead.
users indicates that the features that are most appreciated include the ability to create animations (a process that is often time-consuming in existing community tools), the automatic genera-tion of velocityfields, the ability to view data in multiple plot types (maps, timeseries, transects, sections) and the immediacy and interactivity of the system, enabling curiosity-driven exploration of large data.
5. Software availability
The ncWMS software is available fromhttp://ncwms.sf.net as
open source software with a liberal licence (modified BSD), which permits reuse of source code and binaries for any purpose, provided that the original copyright notice is included with any redistribu-tion of source. The same website contains full documentaredistribu-tion on installation and configuration, together with a set of Frequently-Asked Questions. Developer documentation is provided in the form of Javadoc comments and text within the source code itself. An active mailing list (linked from the website) is the primary means of user and developer support.
6. Conclusions
We have described the design, implementation and capabilities of ncWMS, a widely-used Web Map Service implementation for multidimensional gridded environmental data. Extensions to the WMS specification are proposed and implemented to enable useful
capabilities, whilst retaining backward compatibility with the WMS specification (versions 1.1.1 and 1.3.0). We have placed considerable emphasis on optimizing the performance of the system in order to enable interactive visualization applications.
We have identified aspects of the WMS specification that need to be constrained in order to increase interoperability, and aspects in which the specification could be extended in future. These as-pects are discussed in more detail in Section2and include:
1. Defining how a hierarchy of Layers can be mapped to a multi-dimensional dataset;
2. Constraining the behaviour ofGetFeatureInfo;
3. Defining how to use ELEVATION, TIME and custom dimensions
to address different kinds of vertical and temporal axes; 4. Including metadata items such as units of measure in the
Ca-pabilities document;
5. Generation of “non-map” plots from multidimensional data
(these could be implemented in various ways, or ruled out of scope of a core WMS specification); and
6. Investigating styling mechanisms, mapping between typical scientific use cases and specifications such as SLD/SE.
Matters such as these are subjects of active discussion within the OGC Met-Ocean Domain Working Group, which interacts directly with the WMS standardization group itself.
Future work on ncWMS will include: handling of data with un-certainties, non-gridded data (such as in situ observations), the Fig. 5.Examples of displaying data from ncWMS servers through a selection of third-party WMS client tools. Clockwise from top left: (1) The Australian Integrated Marine Observing System (IMOS). (2) Google Earth. (3) Quantum GIS Desktop 1.8.0. (4) The Pacific Islands Ocean Observing System (PacIOOS) Data Viewer; this client takes advantage of some of the WMS extensions implemented by ncWMS (see Section2).
automatic transformation of data using dimensionless vertical co-ordinates (e.g.“sigma”coordinates) into real-world coordinates; the handling of“unstructured”(triangle-based) grids, the use of SLD/SE to specify the style of images and the implementation of more visualization types, such as Hovmöller (Hovmöller, 1949) plots. Acknowledgements
We would like to thank all ncWMS users for providing impor-tant feedback, suggestions and code contributions to the project. In particular we would like to thank John Caron, Ethan Davis and Marcos Hermida (all of UCAR Unidata) and Pauline Mak (of the Australian Ocean Data Network) for all their work on integrating ncWMS with the THREDDS Data Server. We are grateful to Jane Lewis for helpful comments on this manuscript. We gratefully acknowledgefinancial support from the Technology Strategy Board (DEWS project), the European Commission (projects MERSEA, MyOcean and MyOcean2) and the UK Natural Environment Research Council (project SHAVER).
Appendix A. Supplementary data
Supplementary data related to this article can be found athttp:// dx.doi.org/10.1016/j.envsoft.2013.04.002.
References
de la Beaujardiere, J. (Ed.), 2002. OpenGISÒ Web Map Server Implementation Specification Version 1.1.1. Open Geospatial Consortium Inc.. document 01e 068r3.
de la Beaujardiere, J. (Ed.), 2006. OpenGISÒWeb Map Server Implementation Speci-fication Version 1.3.0. Open Geospatial Consortium Inc.. document 06e042.
Blower, J.D., Haines, K., Santokhee, A., Liu, C., 2009a. GODIVA2: interactive visuali-zation of environmental data on the web. Philosophical Transactions of the Royal Society A 367, 1035e1039.
Blower, J.D., Blanc, F., Clancy, R., Cornillon, P., Donlon, C., Hacker, P., Haines, K., Hankin, S.C., Loubrieu, T., Pouliquen, S., Price, M., Pugh, T., Srinivasan, A., 2009b. Serving GODAE data and products to the ocean community. Oceanography 22 (3), 70e79.
Blower, J.D., Clegg, A., 2011. Fast regridding of large, complex geospatial datasets. In: Proceedings of the 2nd International Conference on Computing for Geospatial Research & Applications. COM.Geo’11. ACM, Washington, DC, pp. 30:1e30:6. Cornillon, P., Gallagher, J., Sgouros, T., 2003. OPeNDAP: accessing data in a
distrib-uted, heterogeneous environment. Data Science Journal 2, 164e174. Domenico, B. (Ed.), 2011. OGC Network Common Data Form (NetCDF) Core
Encoding Standard Version 1.0. Open Geospatial Consortium Inc.. document 10e090r3.
Domenico, B., Nativi, S. (Eds.), 2012. CF-netCDF3 Data Model Extension Standard. Open Geospatial Consortium Inc.. document 11e165r2.
Fox, P., Hendler, J., 2011. Changing the equation on scientific data visualization. Science 331 (6018), 705e708.
Gemmell, A.L., Barciela, R.M., Blower, J.D., Haines, K., Harpham, Q., Millard, K., Price, M.R., Saulter, A., 2011. An ECOOP web portal for visualising and comparing distributed coastal oceanography model and in situ data. Ocean Science 7, 445e454.http://dx.doi.org/10.5194/os-7-445-2011.
Hovmöller, E., 1949. The trough-and-ridge diagram. Tellus 1 (2), 62e66. Hunter, J.D., 2007. Matplotlib: a 2D graphics environment. Computing in Science &
Engineering 9 (3), 90e95.
Lupp, M. (Ed.), 2007. Styled Layer Descriptor Profile of the Web Map Service Implementation Specification Version 1.1.0. Open Geospatial Consortium Inc.. document 05e078r4.
Mueller, M. (Ed.), 2006. Symbology Encoding Implementation Specification Version 1.1.0. Open Geospatial Consortium Inc.. document 05e077r4.
Nativi, S., et al., 2008. Unidata’s common data model mapping to the ISO 19123 data model. Earth Science Informatics 1 (2), 59e78.
Panagos, P., et al., 2008. Soil organic carbon content indicators and web mapping applications. Environmental Modelling & Software 23 (9), 1207e1209. Signell, R.P., et al., 2008. Collaboration tools and techniques for large model
data-sets. Journal of Marine Systems 69, 154e161.
Sun, X., et al., 2012. Development of a web-based visualization platform for climate research using Google Earth. Computers & Geosciences 47, 160e168. Zhao, Y., et al., 2012. A hierarchical organization approach of multi-dimensional
remote sensing data for lightweight Web Map Services. Earth Science Infor-matics 5 (1), 61e75.