Issue 1
Technology for Learning in the Middle Grades:
April 2018
Evaluating Digital Math Tools in the Field
Fiona M. Hollands
Teachers College, Columbia University, [email protected]
Yilin Pan
Teachers College, Columbia University, [email protected]
Follow this and additional works at:
https://scholarworks.uvm.edu/mgreview
Part of the
Education Commons
This Research is brought to you for free and open access by the College of Education and Social Services at ScholarWorks @ UVM. It has been accepted for inclusion in Middle Grades Review by an authorized editor of ScholarWorks @ UVM. For more information, please contact [email protected].
Recommended Citation
Hollands, Fiona M. and Pan, Yilin (2018) "Evaluating Digital Math Tools in the Field,"Middle Grades Review: Vol. 4 : Iss. 1 , Article 8. Available at:https://scholarworks.uvm.edu/mgreview/vol4/iss1/8
Evaluating Digital Math Tools in the Field
Fiona M. Hollands, Teachers College, Columbia University
Yilin Pan, Teachers College, Columbia University Abstract
Many school districts have adopted digital tools to supplement or replace teacher-led instruction, usually based on the premise that these tools can provide more personalized or individualized experiences for students and at lower cost. Rigorously evaluating whether such initiatives promote better student outcomes in the field is difficult as most schools and teachers are unwilling to enforce rigorous study designs such as randomized control trials. We used study designs that were feasible in practice to assess whether two digital math tools, eSpark and IXL, were associated with improvements in 3rd – 6th grade student test scores in math. We also investigated the resource requirements and costs of implementing eSpark and IXL to assess whether these tools represent a valuable use of resources. We find that while IXL is substantially less costly to implement than eSpark, its use is not significantly associated with students’ math performance.
Introduction
Many schools and districts have adopted digital math tools or applications (apps) to provide students with opportunities for practice, to supplement teacher-led instruction or, in some cases, to partially replace it (Carr, 2012; Hu, 2011; Quillen, 2011). Goals for the use of such tools include increasing student engagement in school; providing more equitable, personalized or individualized instruction; improving test scores, or bringing the classroom into line technologically with the students’ world and their future workplaces (Edwards, 2012; Edwards, Smith, & Wirt, 2012; Harper &
Milman, 2016; Ke, 2008; McKenna, 2012; Rosen & Beck-Hill, 2012). Rigorously evaluating whether use of digital tools promotes better student outcomes is challenging in a school setting (Cavanagh, 2015) but necessary to determine whether such tools represent a valuable use of limited resources. Furthermore, under the Every Student Succeeds Act (ESSA) (United States Congress, 2015), schools and districts are expected to use federal funds for evidence-based activities, strategies, and interventions. Evidence is defined according to four tiers of rigor, with the highest - Tier 1 - including randomized controlled trials, and the lowest requiring a well-defined theory of action or logic model with efforts underway to
demonstrate effectiveness.
In practice, few schools and districts are willing to engage in rigorous experimental studies to evaluate real-world classroom activities. Fewer
still track the full array of resources required to implement educational tools with fidelity and their associated costs. Consequently, cost-effectiveness and other types of return on investment analyses are rare, resulting in a dearth of information for education decision-makers who are considering the adoption of digital tools as alternatives to traditional instructional materials. Some school districts have established strategies to systematically pilot new products, perhaps for a semester or one school year, before deciding whether to scale up use across the district (Adams-Bass,
Atchison, & Moore, 2015). While these pilot studies often provide valuable insights on feasibility of implementation and the receptivity of students and teachers to the use of a new tool, the study designs are usually insufficiently rigorous to offer reliable evidence on whether the tool has a causal impact on learning. It is difficult to separate the effects of technology from simultaneously-introduced changes in pedagogical practice or the use of data to drive instruction. In situations where a digital tool is adopted by a whole district at once, evaluating success is limited to comparing student performance before and after implementation, against national norms, or against students in other districts, further diminishing the
confidence with which effects can be attributed to the specific tool. Lack of fidelity of
implementation of technology-based interventions is frequently a problem and further obscures the results of impact studies (Shapley, Sheehan, Maloney, & Caranikas-Walker, 2010).
Formal studies of digital math tools indicate that impact on students’ math achievement is mixed. Among the computer-based or web-based interventions that have been reviewed by What Works Clearinghouse, three have shown positive or potentially positive effects on math
achievement: Odyssey Math (Grade 4-8), I CAN Learn (Grade 8), and DreamBox Learning (K-1). Three interventions are identified as having mixed or non-discernible effects: Accelerated Math (Grade 2-9), PLATO (Grade 6), and I CAN Learn Algebra (Grade 8). Computer-based tutoring systems have generally been found to be effective (Rittle-Johnson & Jordan, 2016; Kulik & Fletcher, 2016), as has web-based math homework with immediate feedback, hints and step-by-step scaffolding (Mendicino, Razzaq, & Heffernan, 2009); and video games for learning fractions (Chung, Choi, Baker, & Cai, 2014). Other studies report uneven results, for example, Ready, Meier, Horton, Mineo, and Yusaitis Pike (2013) and Cole, Kemple and Segeritz (2012) concluded that the personalized learning platform Teach to One: Math improves middle school math performance for some students but not others. Fien et al. (2016) find that a gaming intervention for first graders helps improve math performance on proximal
measures, but not on distal outcome measures. Lack of impact may, in some cases, be due to the tools simply “digitizing the status quo” (Meier, 2015, p.5) rather than improving on traditional teaching practices. Additionally, if digital tools provide automated feedback indicating that answers are incorrect without explaining misconceptions, students may lose rather than gain opportunities to learn. None of these studies address the costs of implementing the digital math tools, making it impossible to assess which ones are cost-effective relative to others, or to traditional modes of instruction.
It is clear that school districts cannot assume that technology tools will improve student performance, or do so cost-effectively. It is equally clear that few districts are prepared to engage in highly rigorous evaluations of new digital tools before adopting them. To demonstrate feasible methods of evaluating digital tools in the context of regular school practice, we present and compare evaluations of two widely used digital math tools, eSpark and IXL, as used in an American school district. We use propensity score matching and a
correlational analysis with statistical controls to provide evidence that should meet ESSA Tier 2 and 3 standards respectively to answer the
research questions: 1) is use of each tool
associated with gains in student performance in math; 2) what are the resource requirements and costs of implementing each tool? We first describe each tool and to what extent they have been studied and subsequently describe how they were implemented in the district’s schools and how we evaluated them.
eSpark
eSpark is an online, adaptive, iPad-based learning environment that provides a
personalized sequence of curated apps, videos, and challenges for students in math and reading. It is licensed to schools and districts and is used by approximately 65,000 PK-8 students in the United States. eSpark currently comprises approximately 1,000 apps from third-party providers, each vetted by a learning design team to ensure it aligns with the Common Core State Standards, provides authentic tasks, scaffolds learning, and is intuitive and engaging to use. eSpark is generally used by students during class time for 20 minutes at a time for a total of 1-2 hours per week. The results of a diagnostic assessment administered by each school, such as Star Math, iReady, Let’s Go Learn, or NWEA’s Measures of Academic Progress, are used by the eSpark vendor to determine each student’s starting level in the online environment and to map am individualized trajectory of activities. The eSpark algorithm differentiates instruction for students by assigning goals and apps to target each student’s specific weaknesses. Each unit or “quest” includes mastery-based quizzes and adapts in real time to the student’s
performance. At end of each quest, students record a “re-teaching” video to report out their learning and enforce reflection. The vendor regularly switches out apps that are rated poorly by students or do not appear to help students master the targeted skills.
The eSpark license price varies depending on the number of student users and the number of teachers being supported. It includes a mobile device management system, 24/7 technical support for teachers and district technology personnel by phone or email, and online tutorial videos. At the beginning of the school year, teachers email the vendor their class rosters and the vendor uploads them into teacher
dashboards. Secure file exchanges are used to provide the vendor with diagnostic assessment results. The digital dashboards allow teachers to review their students’ activities and
performance. Administrators may access an additional dashboard which provides an
overview of activity in the school or district. The vendor sends weekly emails to each teacher recommending action items for specific students. The company also conducts data analysis several times per year on the students’ performance on the activities presented by the tool in order to present the school or district with various metrics of student growth in math. Training for teachers is customized to the district and may be face-to-face or virtual. It includes a product overview, instruction on how to implement eSpark in the classroom, and how to troubleshoot common problems. Teachers are also taught how to navigate the online teacher dashboard and strategies for using data analytics to differentiate instruction in the live classroom. While teacher intervention is not required to direct each student’s trajectory through the eSpark quests, teachers are able to over-ride eSpark assignments using a drag and drop feature in the dashboard. The 1-2 minute video that students record at the end of each quest allows teachers to assess each student individually.
Although eSpark Learning’s website posts numerous case studies of districts attesting to eSpark’s usability and feasibility of
implementation, prior independent research on eSpark has been limited. Setren (2014)
conducted a randomized controlled trial with students in Grades 6-8 in Boston and found a positive effect size of 0.206 for student performance in the math component of the Massachusetts Comprehensive Assessment System. Nolan (2016) found no impact of eSpark on the kindergarten readiness of young, at-risk students, but also found that students did not use eSpark as much as intended.
IXL
IXL is an interactive, online, math app which facilitates practice and reinforcement of skills learned in the classroom. According to the vendor, its apps for language arts, social studies, science, and math are used by six million students worldwide. The company’s website advertises the license at $249 per classroom per year for up to 25 students, the equivalent of $12.45 per student for a classroom of 20 students. The fee is negotiable for large quantities. License fees include a one-hour training webinar for teachers and year-long
support from an account manager and a technical support partner. The app offers between 76 and 359 math skills per grade from pre-K through Grade 8, in addition to skills for algebra, geometry, and calculus. Each skill is tied to a Common Core State Standard.
Easily-accessible data dashboards allow teachers to monitor each student’s time spent and
performance on specific skills. The dashboards identify students who are struggling with a particular skill, for example, dividing fractions, making it easy for the teacher to target students for individualized instruction during class time. The vendor automatically sends weekly emails informing each teacher how much time
individual students have worked on IXL, at what grade level the students are practicing each skill, and how much time the class has collectively spent using the tool.
We could not identify any peer-reviewed journal articles reporting rigorously-designed studies of IXL. However, its impact on math achievement has been investigated in several masters’ theses and doctoral dissertations. Donawerth (2013) found that low-achieving elementary math students who used IXL to learn multiplication facts during before-school lab sessions
performed better on the fourth grade California Standardized Test. However, it is not clear how much of the impact was due to IXL rather than the extension of the school day or to the
additional presence of a Title I teacher. Schuetz (2016) found no difference in the performance or engagement levels of second grade students who used IXL in math classes, as compared with students engaging in a paper-and-pencil math intervention. Longnecker (2013) similarly found no improvement in Grade 6-8 student math performance when IXL was used as a
supplement in the classroom and for homework. In some instances, the IXL students performed worse than the comparison group which participated in traditional direct math instruction.
Methods
We studied eSpark and IXL in schools in a town district of almost 9,000 students in the
northeast United States. The district has a low rate of poverty with 15% of students eligible for free or reduced-price lunch (FRL). Thirty-six percent of students are from minority groups, 11% have disabilities, and 5% are English Language Learners.
eSpark
One elementary school provided eSpark to all 105 third, fourth, and fifth graders to
supplement math instruction during the 2013-14 academic year. Teachers were instructed to implement eSpark with their students for 20 minutes on each of three days per week, for a total of one hour per week. Because each classroom had fewer iPads than students, the teachers created rotation schedules for the students to take turns working on eSpark while the teacher worked with the rest of the class. We collected login frequency from the vendor to assess fidelity of implementation. In Grade 3, students used eSpark an average of 1.8 times per week over 22 weeks in one classroom and 1.8 times per week over 23 weeks in the second classroom. In Grade 4, students used eSpark an average of 1.6 times per week over 22 weeks in one classroom, and 1.4 times per week over 21 weeks in the second classroom. In Grade 5, students used eSpark an average of 1.9 times per week over 24 weeks in one classroom and 3 times per week over 24 weeks in the second classroom. The login data cannot accurately capture time-on-task because students work on a variety of apps within eSpark. If we assume that students spent an average of 20 minutes at each login, we estimate that across all six classrooms using eSpark, the average amount of eSpark use was 14.42 hours per student during 2013-14, with a low of slightly under 10 hours and a high of 24 hours.
We collected data on student gains on the “Let’s Go Learn” math assessment between late November/early December 2013 and June 2014 for the 105 students at the treatment school and for 198 third, fourth, and fifth graders at a comparison school in which no digital math tools were being used. The comparison school was the most similar school in the district to the treatment school across a range of demographic and performance variables. For example, 1% of students in each school were African American; 10% were Hispanic in the treatment school vs. 12% in the comparison school; both had fewer than 5% of students receiving free or reduced lunch (FRL); in both schools, fewer than 10% of students qualified for Special Education; and, in both schools, 95% of the students were
proficient in math on state standardized tests. The Let’s Go Learn post-test scores were compared with pre-test scores to assess the gain over the school year. We used propensity score
matching to compare the gains for each of 99 students in the treatment school for whom demographic data, pre-test, and post-test scores were available with the gains achieved by one of 132 students from the control school for whom these data were also available. The matched control group consisted of the “nearest
neighbor” for each student using eSpark based on a distance measure defined as the probability of participating in eSpark conditional on a number of individual student demographic variables: grade, pre-test score, gender, special education status, FRL status, and race. Appendix A reports the characteristics of the treatment and control groups before and after matching. For the 99 pairs of matched students, we regressed pre-post score gains on the treatment variable (use or no use of eSpark), controlling for grade level, pre-test score, gender, special education status, FRL status, and race. Because students were not randomly assigned to treatment or control conditions, other factors that could affect student math performance, such as home use of digital math tools or the teacher’s classroom instruction, are not accounted for in our model. As a result, we cannot be certain that any relationship detected between eSpark use and gains on the Let’s Go Learn assessment are causal in nature.
IXL
By 2015-16, all students in the district possessed an iPad or Chromebook loaded with wide range of educational apps including IXL. None of the schools agreed to refrain from using IXL in order to serve as a control group for a study to investigate whether use of the tool was
associated with student gains in math. Nor did they want to add more tests to the schedule given the district’s new requirement that each school administer Star Math and Reading assessments at least three times per year. While the district was keen to assess whether IXL could serve as a less costly alternative to eSpark, a study parallel to the eSpark study was not practically feasible. In the absence of a comparison group, we conducted a regression analysis to investigate the association between the amount of time 4th and 6th grade students spent using IXL and the students’ gains on the district-administered Star Math assessment (a test created by Renaissance Learning). During the 2015-16 school year, over 90% of students in Grades 1-7 in the district used IXL.
Teachers all followed the district’s math
curriculum which is based on the Common Core State Standards, and used the Math in Focus: Singapore Math textbook, workbooks, and online materials as the main set of math teaching resources. In addition, the teachers used a variety of online resources and apps to supplement instruction. Teachers assigned specific skills for students to work on in IXL either as independent practice during class or for homework. The amount of time for which IXL use was assigned varied across teachers, and students were often given the choice among various apps and among online and offline activities. Several teachers reported assigning IXL use for 10-15 minutes between one and five times per week.
We obtained from the IXL vendor detailed data on use of the math tool for all 1,308 fourth and sixth grade students in the district. The data indicated that, on average, students used IXL during 2015-16 for 8.5 hours. The range of use was very wide with 4% of students showing no use while others used IXL for many hours, up to 73 hours in one case. On average, students each attempted just over 1,300 IXL problems, practiced 36 different math skills, reached proficiency (defined as a score of 70%) in 27 of these 36 skills, and mastery (a score of 100%) on 17 of the 27 proficient skills. Data from the previous school year for the same 1,308 students showed that they used IXL much less during 2014-15, an average of one half-hour each. To assess the relationship between IXL use and math performance, we calculated each student’s pre-post gains on the Star Math assessment from the beginning to the end of the school year, and regressed this gain against the number of minutes of IXL use during the intervening period. Using multiple linear regression models, we controlled for a number of potentially confounding variables in order to eliminate them as the source of differences in gains. The student-level control variables were: grade level, gender, race, ethnicity, FRL status, special education status, English as a Second Language (ESL) status, math Response to Intervention (RtI) status, reading RtI status, math score on the 2014-15 Smarter Balanced Assessment,
1Note that due to its high license costs, eSpark was not included in the district’s digital toolbox in 2015-16 but a few schools underwrote the costs of the licenses for some of their students. Among the fourth
minutes of IXL use in 2014-15, and number of days the student logged into eSpark1 during the 2015-16 school year. Teacher-level variables included in the regressions were: gender, race, ethnicity, highest level of education, and years of teaching experience. Despite our efforts to control for confounding variables, we did not have data on use of every math tool available to students and, without random assignment of students to treatment and control conditions, could not account for unobserved factors such as the student’s level of motivation. As a result we cannot claim causality in the relationship between IXL use and math achievement. Sources of cost data
The standard methodology for estimating costs for the purposes of economic evaluations of educational interventions is the “ingredients method” developed by Levin (1975) and further refined by Levin and McEwan (2001). This approach estimates the opportunity costs of all resource components - personnel, materials and equipment, facilities and other inputs - required to implement an intervention. It has been applied to a wide range of educational interventions including computer-assisted instruction (Levin & Woo, 1981; Levin, Glass, & Meister, 1987), blended learning programs (Hollands, 2012), and massive open online courses (Hollands & Tirthali, 2014). We used the ingredients approach to estimate the costs of implementing eSpark and IXL and to compare the two programs with respect to cost per student. Our goal was to establish the costs of implementing these programs relative to business-as-usual. In theory, use of such tools may reduce costs if they are used to replace teacher-led instruction or to reduce the amount of time teachers spend preparing lessons or grading homework. They may also increase costs if they are used as supplements to existing instruction or increase the amount of preparation and grading time.
To understand how eSpark and IXL were integrated into instruction and what personnel and other resources were required for
implementation, we interviewed six teachers, a principal, and an instructional coach at the
graders included in this study, 125 used eSpark starting in late March 2016 until the end of the school year. Some of these students appear to have had access for only a week or less.
district’s elementary schools, and four math teachers at middle schools. Interview protocols included questions about frequency and duration of student use of digital math tools in the classroom and for homework, training and technical support provided over the year, teachers’ use of the data dashboards, and
amount of time spent by the teachers themselves using the tools. We purposefully asked teachers to indicate whether time spent on these tools was additional to their regular preparation and grading work, or replaced it to any extent. We also interviewed the district’s director of educational technology to understand the technical demands for supporting use of digital tools across the district. Personnel from both vendors provided us with details about their respective products, including information about training and support that is covered by the license fees. Information about actual license fees paid was provided by the district office. From the interview data, we established the amount of each ingredient needed to implement the digital math tools. Using a free, online tool, CostOut, which is designed to facilitate the estimation of costs of educational programs (Hollands, Hanisch-Cerda, Levin, Belfield, Menon, Shand, Pan, Bakir, & Cheng, 2015), we identified national average prices for each resource, for example, national average elementary teacher and principal salaries. We used national average prices for salaries rather than those specific to this particular district for two reasons. First, national averages provide a more useful benchmark for other districts. Second, this avoids asking for sensitive
information about compensation. Salary levels in CostOut are derived from publicly available national databases such as the Schools and Staffing Survey published by the U.S.
Department of Education’s National Center for Educational Statistics. We applied a fringe benefits rate of 50.38% of salary based on Bureau of Labor Statistics data for public elementary and secondary school employees. Using the number of hours interviewees reported spending on eSpark and IXL, we calculated the percentage of full time equivalent use for each ingredient and entered these numbers into CostOut. CostOut calculates the cost of each ingredient by multiplying
percentage of use by the full time equivalent
2 See formula on p.28 of Hollands, Hanisch-Cerda, Menon, Levin, & Belfield, 2015.
cost. For materials and equipment such as iPads or headphones, we obtained prices from national vendor websites and spread the costs over the typical lifespan reported by our interviewees. For facilities costs, we relied on construction prices in CostOut derived from School Planning and Management magazine, uprated them 33% for furnishing and equipment, and amortized the costs over 30 years2. Costs were estimated in 2016 dollars.
Results
eSpark
In our evaluation of eSpark, the average pre-test scores for the 99 matched pairs of students on the Let’s Go Learn assessment was 4.18 and the average post-test score was 4.72, yielding an average gain of 0.54. After controlling for grade level, pre-test scores, gender, special education status, FRL status, and race, the average pre-post gain in grade level achievement on the Let’s Go Learn assessment for the 99 students who used eSpark was 0.159 points greater than the gains observed in the matched control group (p<0.01, n=198). Students used eSpark for an average of 14.42 hours.
IXL
In our evaluation of IXL, the average student gain in score on the Star Math Assessment over a period of approximately 37 weeks during the 2015-16 academic year was 63 points. The students scored 713 on average at the beginning of the school year and 776 on average by the end of the year. The regression analysis we
conducted to assess the relationship between the amount of IXL use and gains on the Star Math assessment for 1,191 students with complete data on outcome variable and covariates indicated that one minute of IXL use is associated with a 0.004 point gain on Star Math. For one hour of IXL use, this equates to a 0.231 point gain on Star Math. This result is not significant at the 5% level. The 1,191 students each used IXL for 8.95 hours on average.
eSpark and IXL Implementation Costs Costs of implementing eSpark in 2013-14 are summarized in Table 1 and are detailed by ingredient in Table 2. A key finding from our teacher interviews was that the use of eSpark in
2013-14 added to the teachers’ workload by 10-90 minutes each per week. The teachers initially participated in a demonstration of eSpark and a training session, during which time substitute teachers were hired to teach their classes. Throughout the year, teachers spent time reviewing eSpark analytics, reading weekly emails summarizing student activity, assessing student videos at the end of each quest, and adjusting student trajectories in eSpark. A principal and an assistant principal also
participated in the training. The principal spent additional time negotiating eSpark license fees, maintaining the school’s relationship with the vendor, organizing professional development, and managing logistics for eSpark
implementation. School-based Media Technical Assistants helped eSpark personnel set up iPads with the app at the beginning of the year and engaged in trouble-shooting throughout the year. At the central district office, the Chief Information Officer, Director of Educational Technology, Director of Academic Curriculum, and a Project Director spent small amounts of time meeting with the vendor, reviewing the license agreement, assessing accessibility, privacy, and compliance issues, evaluating eSpark’s academic value and compatibility with the district’s curriculum, and coordinating with the vendor and other district personnel. In total, personnel time accounted for almost 60% of the costs of implementing eSpark in 2013-14. Almost 40% of eSpark costs were attributable to materials and equipment, primarily the software license fee of $100 per student. Costs of iPads and accessories such as keyboards, cases, styluses, headphones, and charging equipment were minimal because we pro-rated them to reflect the portion of time for which they were used for eSpark. We based this on an average use of 14.42 hours per student for eSpark during the year, assuming that the iPads were usable 1,440 hours per year (8 hours per school day) for a variety of educational purposes. Similarly, costs of wi-fi and iPad insurance were pro-rated and accounted for less than 1% of the total costs.
Finally, because eSpark was used during regular class time, we did not add costs of
facilities except for the teacher training time. Facilities accounted for less than 1% of total costs. Total costs of implementing IXL in 2015-16, as summarized in Table 1 and detailed in Table 2, were $57 per student. Costs were primarily attributable to personnel time, while the license fee was less than $4 per student. IXL was used by almost 5,800 students across the district allowing some economies of scale for fixed costs. For example, although district office personnel spent a similar amount of time vetting IXL in 2015-16 as they did for eSpark in 2013-14, the costs of their time could be spread among 5,800 students rather than 105 students. However, the demands on teacher time and on equipment remained substantial and were not reduced as a result of greater scale. Although teachers received no formal IXL training, they spent 2-3 hours at the beginning of the year exploring the tool and importing class rosters to create analytics dashboards. Subsequently, teachers spent 10-15 minutes per day identifying relevant IXL strands and other online math activities to assign to students. We attributed 1/5 of this time to IXL based on the average number of math tools the teachers reported using. In addition, teachers each spent 15-20 minutes per week reviewing IXL data analytics.
We attributed 5% of the Media Technical Assistants’ time during the year to IXL for setting it up as part of the digital toolbox, resolving license and access issues, and trouble-shooting throughout the year. Implementation of IXL did not demand time from school principals and assistant principals. In total, personnel costs accounted for 85% of IXL implementation costs. Costs for materials and equipment (mostly iPads and accessories), and for wi-fi and iPad insurance were similar to those for eSpark in 2013-14. However, because students used IXL only for an average of 9 hours during the year, the pro-rated amounts were slightly smaller than for eSpark, which was used for 14.42 hours per student on average.
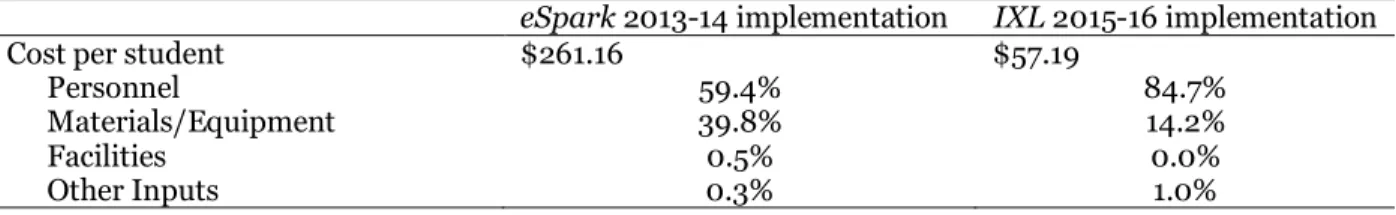
Table 1. Summary table of costs for eSpark and IXL
eSpark 2013-14 implementation IXL 2015-16 implementation
Cost per student $261.16 $57.19
Personnel 59.4% 84.7%
Materials/Equipment 39.8% 14.2%
Facilities 0.5% 0.0%
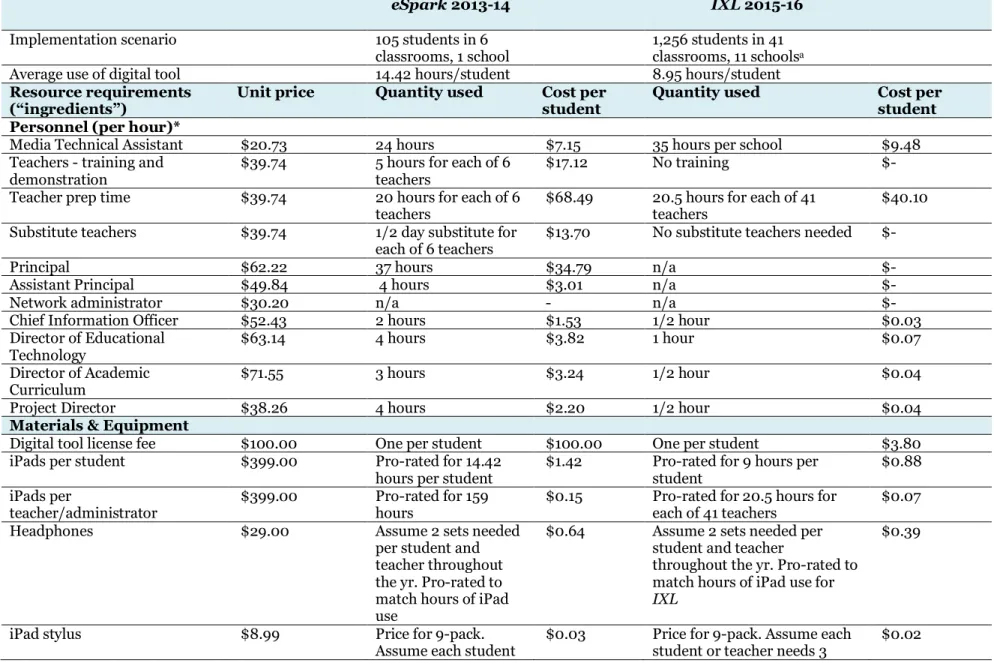
Table 2. Resource requirements and costs for implementation of eSpark and IXL
eSpark 2013-14 IXL 2015-16
Implementation scenario 105 students in 6
classrooms, 1 school 1,256 students in 41 classrooms, 11 schoolsa Average use of digital tool 14.42 hours/student 8.95 hours/student
Resource requirements
(“ingredients”) Unit price Quantity used Cost per student Quantity used Cost per student Personnel (per hour)*
Media Technical Assistant $20.73 24 hours $7.15 35 hours per school $9.48 Teachers - training and
demonstration
$39.74 5 hours for each of 6 teachers
$17.12 No training $-
Teacher prep time $39.74 20 hours for each of 6
teachers $68.49 20.5 hours for each of 41 teachers $40.10 Substitute teachers $39.74 1/2 day substitute for
each of 6 teachers $13.70 No substitute teachers needed $-
Principal $62.22 37 hours $34.79 n/a $-
Assistant Principal $49.84 4 hours $3.01 n/a $-
Network administrator $30.20 n/a - n/a $-
Chief Information Officer $52.43 2 hours $1.53 1/2 hour $0.03
Director of Educational
Technology $63.14 4 hours $3.82 1 hour $0.07
Director of Academic
Curriculum $71.55 3 hours $3.24 1/2 hour $0.04
Project Director $38.26 4 hours $2.20 1/2 hour $0.04
Materials & Equipment
Digital tool license fee $100.00 One per student $100.00 One per student $3.80 iPads per student $399.00 Pro-rated for 14.42
hours per student $1.42 Pro-rated for 9 hours per student $0.88 iPads per
teacher/administrator $399.00 Pro-rated for 159 hours $0.15 Pro-rated for 20.5 hours for each of 41 teachers $0.07 Headphones $29.00 Assume 2 sets needed
per student and teacher throughout the yr. Pro-rated to match hours of iPad use
$0.64 Assume 2 sets needed per student and teacher
throughout the yr. Pro-rated to match hours of iPad use for
IXL
$0.39
iPad stylus $8.99 Price for 9-pack.
or teacher needs 3 styluses per yr. Pro-rated to match hours of iPad use for eSpark
styluses per yr. Pro-rated to match hours of iPad use for
IXL
iPad protective case $79.00 Pro-rated to match hours of iPad use for
eSpark
$0.31 Pro-rated to match hours of
iPad use for IXL $0.19
Multiport charger for
classroom $170.00 10-tablet charger. Assume 1 for each of 6 classrooms and 1/8 of costs for eSpark given other uses of iPads
$0.43 10-tablet charger. Assume 1 for each of 41 classrooms and 1/8 of costs for IXL given other uses of iPads
$0.25
Screen cleaners $24.99 100-pack. Assume 1
per student and teacher per week. 1/8 of these costs ascribed to eSpark given other uses of iPads
$0.79 100-pack. Assume 1 per student and teacher per week. 1/8 of these costs ascribed to
IXL given other uses of iPads
$1.16
iPad keyboard $69.95 Pro-rated to match
hours of eSpark use $0.28 Pro-rated to match hours of IXL use $0.17
Magnifying glass $9.69 n/a - n/a $-
Facilities
Training room $284,172.00 12 hours total for 3 training sessions. Amortized over 30 yrs
$1.23 n/a $-
Other resources
Wi-fi and internet access $23.44 Pro-rated to match
hours of eSpark use $0.26 Pro-rated to match hours of IXL use $0.16 iPad insurance and tech
support $99.00 Apple Care for iPads amortized over 2 yrs. Pro-rated to match hours of eSpark use by students, teachers and administrators
$0.57 Apple Care for iPads amortized over 2 yrs. Pro-rated to match hours of IXL use by students, teachers and administrators
$0.34
Total cost per student $261.16 $57.19
* Personnel ingredients are shown as base salary per hour but 50.38% fringe benefits are added to obtain total costs.
Note. Costs of iPads, keyboards, iPad cases and multiport chargers are amortized over 3 years (see formula on p.28 of Hollands, Hanisch-Cerda, Menon, Levin, & Belfield, 2015) unless otherwise noted. a4% of the 1,308 fourth and sixth grade students in the district did not use IXL. We spread costs only across those who did use it.
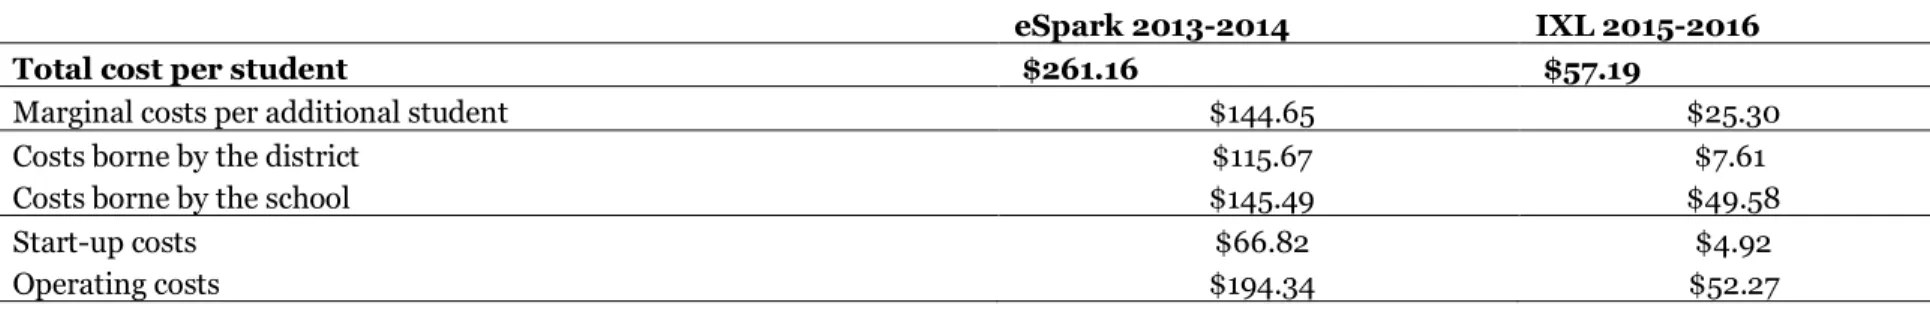
In addition to estimating total costs of implementation for each tool, we estimated the marginal costs for one additional student using each tool. These are summarized in Table 3 and detailed in Table 4. We also show in these tables how the costs are distributed across the schools and district and which ones are start-up costs and operating costs. For eSpark, 26% of the costs are start-up vs. 74% operating;
44% of the costs are borne by the district vs. 56% by the school; and marginal costs of one additional student using eSpark are high, at 55% of the total costs per student. For IXL, 9% of the costs are start-up vs. 91% operating; 13% are borne by the district and 87% by the schools; and marginal costs of one additional student using IXL are 44% of the total costs per student.
Table 3: Summary, marginal costs per additional student; costs for school vs. district; and start-up vs. operating costs for eSpark and IXL
eSpark 2013-2014 IXL 2015-2016
Total cost per student $261.16 $57.19
Marginal costs per additional student $144.65 $25.30
Costs borne by the district $115.67 $7.61
Costs borne by the school $145.49 $49.58
Start-up costs $66.82 $4.92
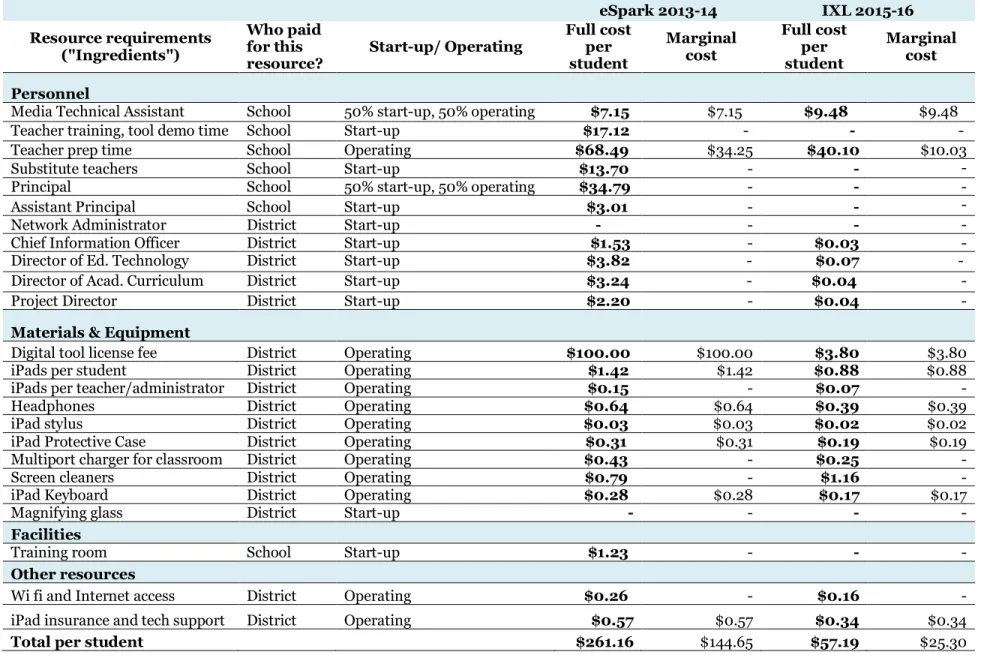
Table 4. Ingredients: who paid for each resource, start-up vs. operating cost, and marginal costs eSpark 2013-14 IXL 2015-16 Resource requirements ("Ingredients") Who paid for this
resource? Start-up/ Operating
Full cost per student Marginal cost Full cost per student Marginal cost Personnel
Media Technical Assistant School 50% start-up, 50% operating $7.15 $7.15 $9.48 $9.48 Teacher training, tool demo time School Start-up $17.12 - - -
Teacher prep time School Operating $68.49 $34.25 $40.10 $10.03
Substitute teachers School Start-up $13.70 - - -
Principal School 50% start-up, 50% operating $34.79 - - -
Assistant Principal School Start-up $3.01 - - -
Network Administrator District Start-up - - - -
Chief Information Officer District Start-up $1.53 - $0.03 -
Director of Ed. Technology District Start-up $3.82 - $0.07 - Director of Acad. Curriculum District Start-up $3.24 - $0.04 -
Project Director District Start-up $2.20 - $0.04 -
Materials & Equipment
Digital tool license fee District Operating $100.00 $100.00 $3.80 $3.80
iPads per student District Operating $1.42 $1.42 $0.88 $0.88
iPads per teacher/administrator District Operating $0.15 - $0.07 -
Headphones District Operating $0.64 $0.64 $0.39 $0.39
iPad stylus District Operating $0.03 $0.03 $0.02 $0.02
iPad Protective Case District Operating $0.31 $0.31 $0.19 $0.19
Multiport charger for classroom District Operating $0.43 - $0.25 -
Screen cleaners District Operating $0.79 - $1.16 -
iPad Keyboard District Operating $0.28 $0.28 $0.17 $0.17
Magnifying glass District Start-up - - - -
Facilities
Training room School Start-up $1.23 - - -
Other resources
Wi fi and Internet access District Operating $0.26 - $0.16 -
iPad insurance and tech support District Operating $0.57 $0.57 $0.34 $0.34
Discussion
We found that eSpark costs approximately 4.5 times more than IXL to implement but is associated with statistically significant gains on the Let’s Go Learn math assessment while IXL is not associated with gains on Star Math. This comparison would be more direct if both tools were evaluated using the same pre- and post-assessment, and we generally recommend this strategy wherever feasible. We expect that similar results might be found in other school contexts because this was a “field study” in which the interventions were integrated into the teachers’ regular classroom practices as opposed to being enforced according to a strict study protocol which is unlikely to be maintained once the study is completed.
A possible explanation for the lack of association between use of IXL and better performance on the Star Math assessment is that the types of problems students are asked to solve in IXL are different from those in the Star Math
assessment. Fourth and sixth grade teachers who were interviewed as part of this study expressed the view that while IXL is useful for students to practice and reinforce math skills learned in the classroom, it is less helpful for teaching new topics or applying concepts to complex, multi-step problems. They noted that while Star Math assessments and the Smarter Balanced Assessment rely on the same skill base as IXL, they include more rigorous word
problems, exemplars, and “really challenging questions.”
For both tools, operating costs represent a high percentage of the total costs per student which means that cost will not fall substantially after the first year. In addition, the marginal costs for one additional student using each tool are also quite high primarily because the licenses are charged per student and teacher time increases for reviewing individual student data analytics and work products such as the eSpark videos. The cost results would likely be lower for eSpark
going forward as license costs have dropped from $100 per student in 2013 to around $35 per student. Costs of teacher time would vary by context depending on the extent to which teachers take the time to review the data analytics available from each tool and the
eSpark videos.
If eSpark and IXL digital math tools were used as a partial substitute for existing teacher-led instruction as opposed to a supplement, they would be less costly to implement. However, student performance might suffer as a result of less teacher involvement. Given the teachers’ reported strategy of using classroom time to target students struggling with specific math skills, a future study should investigate whether students in classrooms using digital tools receive more personalized instruction from their
teachers than in non-digital classrooms, and whether this impacts student performance. If it is the case that digital tools are as effective as teacher-led instruction for most students and simultaneously allow the teacher to dedicate more time to address problem areas with individual students during class, they may serve as a useful resource to improve outcomes overall. In order to tease out the effect of using the digital tool per se from the effects of the teacher personalizing instruction as a result of the tool, it would be necessary to have three types of classroom to compare results: business-as-usual classrooms with no digital tools; classrooms using digital tools in which the teacher uses the tool analytics to target individual students for help with particular skills; and classrooms using digital tools in which the teacher refrains from delivering personalized instruction based on tool analytics.
Conclusion
It is apparent that digital tools may not always have pedagogical value that merits the costs involved with their acquisition and
implementation. Digital tools that are adaptive and require students to report out on what they have learned may be more helpful than tools that simply allow students to practice math skills in a more engaging way than pen and paper worksheets. Overall, the advertised license costs of digital tools may seem low in comparison to the costs of traditional instructional materials sold by textbook publishers, but they grossly underestimate the true costs of implementation. Decision-makers at schools and district offices would be wise to also consider the personnel time involved in initially making the tools available, and in ongoing monitoring of their use, in addition to the costs of purchasing and maintaining the devices on which the digital tools operate. It is also clear that digital tools can add substantially to teachers’ preparation time burden rather than reduce it, as often presumed.
School districts should select digital tools and assessment instruments to align with the district’s learning objectives for students. If the goal is to improve performance on the Star Math Assessment or the Smarter Balanced
Assessment, the district should invest in tools that address the skills assessed in these tests. If the goal is to personalize learning for students, careful thought must be given to
implementation. For example, teachers should
be trained to leverage the data dashboards to develop strategies for addressing individual student needs. The time commitment to review the digital data must be factored into allowances for teacher preparation time. Furthermore, districts should heed the advice of teachers we interviewed: if teachers are to personalize learning for students, professional development should model this by being personalized to each teacher.
References
Adams-Bass, V., Atchison, D., Moore, L. (2015).
Pilot-to-purchase project: Piloting ed-tech products in K-12 public schools. A report from the University of California Davis School of Education to Digital Promise. Retrieved from
http://digitalpromise.org/wp-content/uploads/2016/02/UCDavis_Ed TechPilotReport.pdf
Carr, J. M. (2012). Does math achievement h’APP’en when iPads and game-based learning are incorporated into fifth-grade mathematics instruction? Journal of Information Technology Education: Research, 11(1), 269-286.
Cavanagh, S. (2015). Districts struggle to judge ed-tech pilot projects. Education Week, 35(14), 10.
Chung, G. K. W. K., Choi, K., Baker, E. L., & Cai, L. (2014). The effects of math video games on learning: A randomized evaluation study with innovative
impact estimation techniques (CRESST
Report 841). Los Angeles, CA:
University of California, National Center for Research on Evaluation, Standards, and Student Testing.
Cole, R., Kemple, J. J., & Segeritz, M. D. (2012). Assessing the early impact of School of One: Evidence from three school-wide pilots. Society for Research on Educational Effectiveness, 36. Donawerth, A. S. (2013). Bridging the gap:
fourth grade before-school computer math lab and its impact on California standardized test scores (Doctoral dissertation). Retrieved from ProQuest Dissertations & Theses Global. (UMI Number: 1586255).
Edwards, M. (2012, February). Our digital conversion: The introduction of a 1-to-1
laptop initiative is only part of a sweeping districtwide commitment to the learning of every student. School Administrator, 69(2), 20-24. Edwards, M., Smith, S., & Wirt, T. (2012). Go
Digital. Learning & Leading with Technology, 40(2), 12-15.
Fien, H., Doabler, C. T., Nelson, N. J., Kosty, D. B., Clarke, B., & Baker, S. K. (2015). An examination of the promise of the NumberShire Level 1 gaming intervention for improving student mathematics outcomes. Journal of Research on Educational Effectiveness, 9(4), 635-661.
Glassett, K., & Schrum, L. (2009). Teacher beliefs and student achievement in technology-rich classroom
environments. International Journal of Technology in Teaching and Learning, (5), 138-153.
Harper, B., & Milman, N. B. (2016). One-to-one technology in K–12 classrooms: A review of the literature from 2004 through 2014. Journal of Research on
Technology in Education, 48(2), 129-142.
Hollands, F.M. (2012). Using cost-effectiveness
analysis to evaluate School of One.
Paper presented at the Annual Meeting of the American Educational Research Association, Vancouver, Canada.
Hollands, F.M., Hanisch-Cerda, B., Levin, H. M.,
Belfield, C.R., Menon, A., Shand, R.,
Pan, Y., Bakir, I., & Cheng, H.
(2015). CostOut - the CBCSE Cost Tool
Kit. Center for Benefit-Cost Studies of Education, Teachers College, Columbia University. Retrieved
from: www.cbcsecosttoolkit.org
Hollands, F., Hanisch-Cerda, B., Menon, A., Levin, H. & Belfield, C. (2015). User manual for CostOut - the CBCSE Cost
Tool Kit. Center for Benefit-Cost Studies of Education, Teachers College,
Columbia University.
Hollands, F. & Tirthali, D. (2014). Resource requirements and costs of developing
and delivering MOOCs. The
International Review of Research in
Open and Distance Learning, 15(5),
113-132
Hu, W. (2011, January 4). Math that moves: Schools embrace the iPad. The New York Times.
Ke, F. (2008). A case study of computer gaming for math: Engaged learning from gameplay? Computers &
Education, 51(4), 1609-1620. Kulik, J. A., & Fletcher, J. D. (2016).
Effectiveness of intelligent tutoring systems: A meta-analytic review. Review of Educational Research, 86(1), 42-78. Levin, H. M. (1975). Cost-effectiveness analysis in evaluation research. In M. Guttentag & E. L.Struening (Eds.), Handbook of evaluation research (Vol. 2; pp. 346– 368). Beverly Hills, CA: Sage.
Levin, H. M., Glass, G. V., & Meister, G. (1987). Cost-effectiveness of computer-assisted instruction. Evaluation Review, 11(1), 50-72.
Levin, H. M., & McEwan, P. J. (2001). Cost-effectiveness analysis: Methods and applications (2nd ed.). Thousand Oaks, CA: Sage Publications.
Levin, H. M., &Woo, L. (1981). The costs of computer-assisted instruction.
Economics of Education Review, 1, 1– 25.
Longnecker, R. W. (2013). IXL.com—measuring the effects of internet-based math instruction on the math achievement of middle school students (Doctoral dissertation).Retrieved from ProQuest Dissertations & Theses Global. (Order No. 3565664).
McKenna, C. (2012). There’s an app for that: How two elementary classrooms used iPads to enhance student learning.
Education, 2(5), 136-142.
Meier, E. (2015). Beyond a digital status quo: re-conceptualizing online learning
opportunities. Occasional Paper Series, 2015 (34). Retrieved from
https://educate.bankstreet.edu/occasio nal-paper-series/vol2015/iss34/2 Mendicino, M., Razzaq, L., & Heffernan, N. T.
(2009). A comparison of traditional
homework to computer-supported homework. Journal of Research on Technology in Education, 41(3), 331-359.
Nolan, J. P. (2016). Implementation of iPads for at-risk pre-kindergarten students
(Doctoral dissertation). Retrieved from ProQuest Dissertations & Theses Global. (Order No. 10139651).
Quillen, I. (2011). Math educators see the right angles for digital tools. Education Week, 30(35), S4-S6.
Ready, D. D., Meier, E. B., Horton, D., Mineo, C. M., & Yusaitis Pike, J. M. (2013).
Student mathematics performance in year one implementation of Teach to One: Math. New York: Center for Technology and School Change. Retrieved from
http://digitallearningnow.com/site/upl oads/2013/11/TeachtoOneReport_CTSC _Fall2013_Final.pdf
Rittle-Johnson, B., & Jordan, N. C. (2016).
Synthesis of IES-funded research on
mathematics: 2002–2013. (NCER
2016-2003). Washington, DC: National Center for Education Research, Institute of Education Sciences, U.S. Department of Education.
Rosen, Y., & Beck-Hill, D. (2012). Intertwining digital content and a one-to-one laptop environment in teaching and learning: lessons from the Time to Know
program. Journal of Research on Technology in Education, 44, 225-241. Schuetz, R. L. (2016). Is technology the answer?
Investigating students' achievement and engagement in mathematics
(Doctoral dissertation). Retrieved from ProQuest Dissertations & Theses Global. (Order No. 10096196).
Setren, E. (2014). The impact of a personalized tablet educational program.
Massachusetts Institute of Technology. (PowerPoint Presentation).
Shapley, K.S., Sheehan, D., Maloney, C., & Caranikas-Walker, F. (2010). Evaluating the implementation fidelity of
technology immersion and its
relationship with student achievement.
Journal of Technology, Learning, and Assessment, 9(4).
United States Congress. (2015). Every Student Succeeds Act: Conference report (to accompany S. 1177). Washington: U.S. Government Publishing Office.
Appendix A
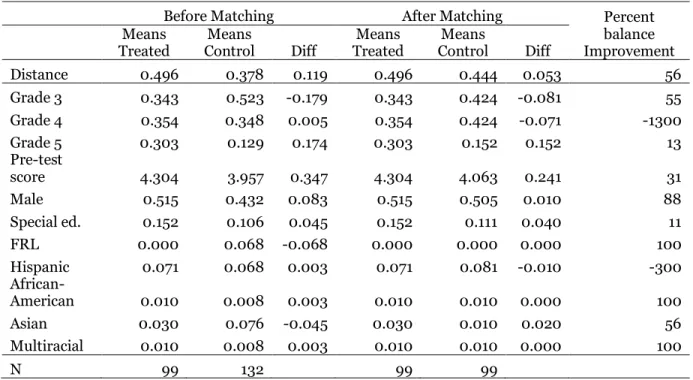
Characteristics of Treatment and Control Groups Before and After Matching
The balance between eSpark students and non-eSpark students for most demographic variables improved
after matching (See Table A1). Two exceptions are the percentage of fourth graders and the percentage of Hispanic students. The pool of fifth graders with no missing data included 30 treatment students but only 17 control students. As a result, some of the fifth-grade treatment students were matched with fourth grade control students, leading to an increase in the percentage of fourth graders in the control group after matching. As fourth and fifth graders in the control school averaged very similar gains in the assessment (0.34 vs 0.33 points respectively) this mismatch is unlikely to affect the findings regarding
correlation between eSpark use and test score gains. The number of Hispanic students in both groups was
minimal: 7 in the treatment school and 9 in the control school before matching, and 8 after matching. Because of the small number of Hispanic students, a decrease of one in the control group after matching results in a large but practically immaterial change in the percent balance.
We found no reason to believe that the 6 treatment students for whom either test score data or demographic data were missing differed systematically from the 99 students for whom all data were available. However, among fifth graders in the control school, over half the students in the original sample were missing demographic data. We found that, compared to the fifth graders who remained in the matching pool, these students showed smaller gains from pre- to post-assessment (0.26 vs. 0.46 points on the Let’s Go Learn assessment). This non-randomness in the missing data for the control students quite
likely leads to an underestimate of the correlation between eSpark and the observed test score gains.
Table A1. Characteristics of treatment and control groups before and after matching
Before Matching After Matching Percent
balance Improvement Means
Treated Control Means Diff Treated Means Control Means Diff
Distance 0.496 0.378 0.119 0.496 0.444 0.053 56 Grade 3 0.343 0.523 -0.179 0.343 0.424 -0.081 55 Grade 4 0.354 0.348 0.005 0.354 0.424 -0.071 -1300 Grade 5 0.303 0.129 0.174 0.303 0.152 0.152 13 Pre-test score 4.304 3.957 0.347 4.304 4.063 0.241 31 Male 0.515 0.432 0.083 0.515 0.505 0.010 88 Special ed. 0.152 0.106 0.045 0.152 0.111 0.040 11 FRL 0.000 0.068 -0.068 0.000 0.000 0.000 100 Hispanic 0.071 0.068 0.003 0.071 0.081 -0.010 -300 African-American 0.010 0.008 0.003 0.010 0.010 0.000 100 Asian 0.030 0.076 -0.045 0.030 0.010 0.020 56 Multiracial 0.010 0.008 0.003 0.010 0.010 0.000 100 N 99 132 99 99
Notes. Distance is the propensity score estimated by a logistic regression, defined as the probability of
receiving treatment conditional on the demographic characteristics. The percent balance improvement is
defined as 100((|a|-|b|)/|a|), where a is the difference in means before matching and b is the difference