The Short- And Long-Term
Performance Of Privatization
Initial Public Offerings In Europe
Haykel Hamdi, Ph.D., University Paris Assas, France Duc Khuong Nguyen, Ph.D., IPAG Business School, France Hassan Obeid, Ph.D., European Business School – Paris, France
ABSTRACT
This article investigates the return behavior of privatization initial public offerings (PIPOs) in Eu-rope over both the short- and long-run horizons. Using data from a sample of 162 PIPOs over the period 1986-2008, we show that European PIPOs outperform, in terms of risk-adjusted abnormal returns, a benchmark market index and a portfolio composed of 162 European private IPOs, re-gardless of the horizon of analysis. Our results are important for both investors and policymakers with respect to their investment and privatization decisions, and also allow a better understanding of the financial performance behavior of the privatized state-owned enterprises.
Keywords: Privatization IPOs; PIPO; Short- And Long-Run Performance; CAR; BHAR
1. INTRODUCTION
rivatization, characterized by the possible entry of private capital to different degrees, is a striking phenomenon of the global economy since early 1970’s. It grows more rapidly in the industrialized countries than in the developing and transitional countries. According Kikeri et al. (1992), more than 80 countries have actively been engaged in the privatization programs between 1980 and 1992 with more than 8500 privatized public firms of which 2000 firms operated in countries having borrowed from the World Bank. Bortolotti and Milella (2008) show that 4000 privatizations have been successfully carried out all around the world over a short period from 1997 till 2004, and that they brought to governments not less than US$ 1350 billion dollars. The Western Europe is the most important region in terms of operations totaling half of the global receipts. The market seems to keep its dynamics despite the global financial crisis 2007-2009 and the year 2008 is ranked seventh over the last 20 years with more than US$ 76 billion of receipts (Choi et al., 2010).
Privatization is motivated by various reasons, but the most important ones include the inefficiency of public enterprises and budget constraints, particularly during periods of economic recession. It is seen as a solution to a better allocation of resources and to improve the performance of public enterprises through reducing the political interference in the decision-making process, increasing incentives to the management level as well as imposing financial discipline. A better understanding of the impacts of privatization should greatly facilitate the conduct of sound economic policies. As privatization methods, previous studies have noted that they are often determined by the objectives set by governments and the particular need of the country in question. Apart from the fact that privati-zation can be partial or total, some countries prefer initial public offerings for the total transfer of “public to private” ownership, while the others rather adopt a privatization strategy that targets private capital by selling shares of pub-lic enterprises to specific groups of investors. Between these two methods, there are privatizations that are made through initial public offerings (PIPO) and private sectors (Boubakri and Cosset, 1998). This variety of privatization methods may make the results across countries very specific and different.
To date, several authors have focused on the impact of privatization on the performance of privatized firms. Attention was first paid to the comparison of the financial and operational performance before and after privatization
programs. The analysis looks at different samples of countries and is based on financial ratios such as profitability, sales (output), productivity, net income and distribution of dividends. The non-exhaustive list of work may include, amongst others, Megginson et al. (1994), Boubakri and Cosset (1998) and D’Souza et al. (2007). These studies have commonly shown that the performance measures improve over the post-privatization period, even after controlling for the specificities of the national economy. They have also highlighted the impact of privatization on the mecha-nisms of governance of the privatized firms as well as on its financial and operational performance.
The impact of privatization on stock returns of the privatized firms by public offerings is another interesting research topic since it has direct managerial implications.1 Previous studies in this strand of research include, amongst others, Farinos et al. (2007) for the Spanish market, Aussenegg and Jelic (2007) for transitional countries in Central Europe, Florio and Manzoni (2004) for the UK market, Paudyal and al. (1998) for Malaysian market, and Megginson et al. (2000) for a sample of multiple countries. Whatever the monitored samples are (several or individ-ual countries), these studies generally show that: i) the transformation of a state enterprise into a private one by a public equity offering is accompanied by a substantial reduction on the level of debts and a significant improvement of the operating performance, measured by the turnover, sales per employee, and the level of profitability (D’Souza
and al., 2005; D’Souza and Megginson, 1999); ii) the privatization of public enterprises through the stock market led
to a short term underestimation at various degrees depending on the samples, but this underestimation is statistically
significant (Jelic and Briston, 2003; Huang and Levich, 2003; Ausenegg, 2000; Choi and Nam, 1998); iii) there is no
consensus on the long term performance (long-run performance) of the PIPO firms to the extent that some studies have found an outperformance (e.g., Megginson et al., 2000 ; Choi et al., 2000 ; Boubakri and Cosset, 2000), while
the others conclude on insignificant abnormal returns (e.g., Comstock et al., 2003; Jelic and Briston, 1999; Menyah
et al., 1995).2
The evidence of PIPO underpricing in previous studies can be explained by substantial costs of going pub-lic process and stock market listing (Ritter, 1987; Grinblatt and Titman, 1998). Afterwards, the newly listed firms will be able to follow the market rhythm and their market prices reflect the real financial situation of the enterprise. This amounts to say that these PIPO firms may benefit from financial markets in terms of fund raising to achieve a superior performance to the private firms having the same characteristics. Only a few studies have compared the PIPO firms and the private firms. Several authors, e.g., Dewenter and Malatesta (1997), find that the phenomenon of underpricing is not more pronounced for public firms than for the private ones following the IPOs. In their study on the Malaysian market, Paudyal et al. (1998) show that the short-term returns of public firms are on average larger than those of the private firms.
We contribute to the related literature by examining the short- and long-term performance of European firms that have been privatized through IPOs. At the empirical level, we adopt two approaches often used in the literature: the cumulative abnormal returns (CAR) and the abnormal returns based on the “buy and hold” strategy (BHAR). While the first approach allows us to detect the existence of abnormal returns during the event window, the second offers the opportunity to detect the abnormal returns at the end of this period. Furthermore, these two approaches offer the possibility of analyzing the change in the performance of the studied firms before and after privatization. To control the robustness of the results, we compare the abnormal returns of the studied firms to a reference sample of listed private firms. Unlike previous studies, we standardize the adjusted abnormal returns by their respective risk levels in order to avoid potential biases.
Our empirical evidence shows that the sample of PIPO firms outperforms the reference sample of listed private firms over the period 1986-2008 and over the short- and long-term horizons. These results are consistent with those of most existing studies including Aussenegg (2000), and Perotti (1995). They contradict, however, those
1
For brevity, we do not present the results of the theoretical and empirical studies on IPOs here. The interested readers can refer to Ljungqvist (2007), and Gajewski and Gresse (2006) for a comprehensive review of the literature on this topic. However, it is worth noting that most studies on this topic found two essential phenomena. The first is that the newly listed enterprises are undervalued. The short-term market performance depends, for a large part, on the IPO cost that includes, among others, the cost of the underpricing. This is manifested by a positive and significant difference between the first listed price and the offer price. The second phenomenon is related to the fact that these enterprises tend to have a lower long-run performance than the matched enterprises.
2
of Comstock et al. (2003), Jelic and Briston (1999), and Menyah etal. (1995) concerning the analysis of the long-term performance. IPOs are thus a way to restructure public enterprises and to make them more efficient.
The rest of this article is structured as follows. Section 2 describes the data used and the research methodol-ogy. Section 3 reports and discusses the results. Section 4 concludes the article.
2. DATA AND EMPIRICAL METHOD 2.1 Data
Our sample consists of European firms that are privatized through IPOs as well as the IPO private firms which constitute the reference sample. Privatizations were identified in 14 European countries: Germany, Austria, Belgium, Denmark, Spain, Finland, France, Great Britain, Greece, Ireland, Italy, Netherlands, Portugal and Sweden.
The stock price data are expressed in US dollars and obtained from Thomson One Banker and Infinancials over a
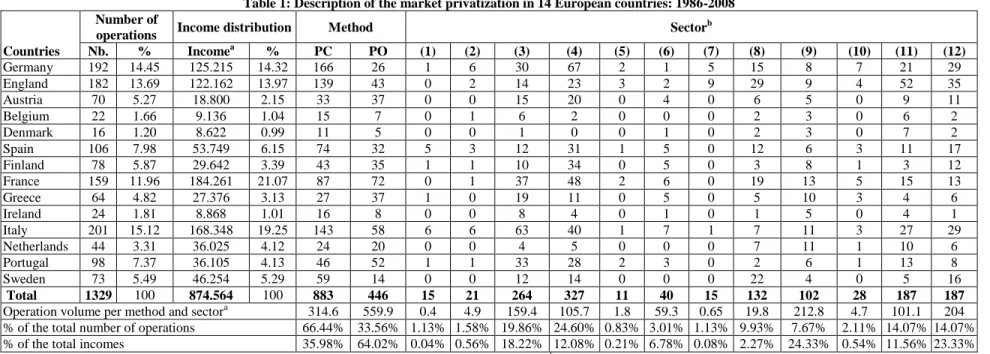
period of 36 months after privatization. Table 1 shows the number of operations and the corresponding receipts per country and per business sector. Over the period 1986-2008, there are 1329 privatizations with a total receipt of 874.564 trillion USD. Germany, France, Italy and England are the most active markets and account for approximate-ly 70% of receipts. According to the privatization method, we record 883 operations privatized by private capitals and 446 operations privatized through IPOs. The telecommunications sector ranks first in terms of privatization receipts (24.33%), followed by the utilities sector (23.33%).
Our final sample includes only 162 PIPO firms because of three main reasons: the lack of data on privat-ized firms; mergers and acquisitions of some firms and the consideration of only PIPO firms. We make, over the same period, a reference (matching) sample of 162 European firms that are comparable to firms of the PIPO sample in terms of size and activity.
2.2 Empirical method
We seek to measure and analyze the stock market performance of the privatized firms over a period ranging from one month to 36 months after privatization. In the finance literature, there are two methods to calculate the stock returns: the cumulative abnormal returns (CAR) and the “buy and hold” abnormal returns (BHAR). While the first method allows us to check whether the average abnormal return is significantly different from zero during the event, the second method tests whether the average abnormal return at the end of the event period is significantly different from zero. Barber and Lyon (1997) and Lyon and al. (1999) suggest the use of the BHAR method, whereas Fama (1998), and Mitchell and Stafford (2000) favor the CAR method together with calendar-time portfolios. This study uses both methods to evaluate the abnormal returns of PIPO firms over the short and long terms. We also benchmark their performance against that of a reference sample of listed private firms.
3. RESULTS AND INTERPRETATIONS
We conduct a three-step analysis. We first compare the stock returns (Rit), the abnormal returns (ARit), the
cumulative abnormal returns (CARit) of the PIPO firms with those of the listed private firms that form the reference
sample (Rbt, ARbtand CARbt). We then test the hypothesis of equality of the cumulative abnormal returns between
the two samples under consideration. Finally, we examine the null hypothesis according to which the difference of the buy and hold abnormal returns (BHAR) is equal to zero.
3.1 Analysis of the abnormal returns and the cumulative abnormal returns
We first compare, at each time t, the average return of the PIPO firms with that of the firms in the reference
control sample over a period from 1 to 36 months. The results in Table 1 indicate that the PIPO sample achieves positive returns in the first month following the IPO, which thus confirms the hypothesis of underpricing. Loughran et al. (1994), and Aussenegg and Jelic (2007) obtain similar results using different datasets. This underpricing no longer exists over the medium- and long-term horizons as the continuing increase in the market performance cannot be confirmed. By calculating the sum of the average return differentials over 36 months, we find a superiority of the PIPO firms (+52.32%), but the null hypothesis of mean equality is rejected.
Table 1: Description of the market privatization in 14 European countries: 1986-2008
Countries
Number of
operations Income distribution Method Sector
b Nb. % Incomea % PC PO (1) (2) (3) (4) (5) (6) (7) (8) (9) (10) (11) (12) Germany 192 14.45 125.215 14.32 166 26 1 6 30 67 2 1 5 15 8 7 21 29 England 182 13.69 122.162 13.97 139 43 0 2 14 23 3 2 9 29 9 4 52 35 Austria 70 5.27 18.800 2.15 33 37 0 0 15 20 0 4 0 6 5 0 9 11 Belgium 22 1.66 9.136 1.04 15 7 0 1 6 2 0 0 0 2 3 0 6 2 Denmark 16 1.20 8.622 0.99 11 5 0 0 1 0 0 1 0 2 3 0 7 2 Spain 106 7.98 53.749 6.15 74 32 5 3 12 31 1 5 0 12 6 3 11 17 Finland 78 5.87 29.642 3.39 43 35 1 1 10 34 0 5 0 3 8 1 3 12 France 159 11.96 184.261 21.07 87 72 0 1 37 48 2 6 0 19 13 5 15 13 Greece 64 4.82 27.376 3.13 27 37 1 0 19 11 0 5 0 5 10 3 4 6 Ireland 24 1.81 8.868 1.01 16 8 0 0 8 4 0 1 0 1 5 0 4 1 Italy 201 15.12 168.348 19.25 143 58 6 6 63 40 1 7 1 7 11 3 27 29 Netherlands 44 3.31 36.025 4.12 24 20 0 0 4 5 0 0 0 7 11 1 10 6 Portugal 98 7.37 36.105 4.13 46 52 1 1 33 28 2 3 0 2 6 1 13 8 Sweden 73 5.49 46.254 5.29 59 14 0 0 12 14 0 0 0 22 4 0 5 16 Total 1329 100 874.564 100 883 446 15 21 264 327 11 40 15 132 102 28 187 187
Operation volume per method and sectora 314.6 559.9 0.4 4.9 159.4 105.7 1.8 59.3 0.65 19.8 212.8 4.7 101.1 204 % of the total number of operations 66.44% 33.56% 1.13% 1.58% 19.86% 24.60% 0.83% 3.01% 1.13% 9.93% 7.67% 2.11% 14.07% 14.07% % of the total incomes 35.98% 64.02% 0.04% 0.56% 18.22% 12.08% 0.21% 6.78% 0.08% 2.27% 24.33% 0.54% 11.56% 23.33% Notes: PC: private capitals; PO: public offerings; a indicates that the amounts are in billions of USD; b indicates the different business sectors: (1)Agriculture, (2) Construction, (3) Finance and Real Estate, (4) Manufacture, (5) Natural Resources, (6) Petroleum, (7) Public Administration, (8) Services, (9) Telecommunications, (10) Commerce, (11) Transport, (12) Utilities.
Table 1 - Comparison of stock returns: Rit(PIPO sample) against Rbt (reference sample)
Date Group statistics T-test for mean equality
Sample Obs. Average Standard deviation Average return differentials t-stat. p-value
T1 1 162 0.0960 0.082 0.0810 0.6371 0.5291 2 162 0.0150 0.094 T6 1 162 0.0760 0.081 0.0600 1.0702 0.2925 2 162 0.0160 0.100 T12 1 162 0.0586 0.201 0.0706 0.9873 0.3307 2 162 -0.0120 0.179 T18 1 162 -0.0251 0.158 -0.0145 0.9123 0.3681 2 162 -0.0106 0.106 T24 1 162 0.0330 0.059 -0.0260 -0.5551 0.5829 2 162 0.0590 0.206 T30 1 162 0.0074 0.269 0.0012 -0.2763 0.7847 2 162 0.0062 0.487 T36 1 162 0.0162 0.115 0.0111 -1.3225 0.1954 2 162 0.0251 0.101
Notes: the calculation was done for each of the 36 months, but we only report the results for 7 months to conserve space. Sample 1: PIPO firms; Sample 2: listed private firms. The average return differentials refer to the difference between average return of sample 1and that of sample 2.
We now turn to compare the abnormal returns of the PIPO sample (ARit) with those of the reference sample (ARbt). The abnormal returns are measured by the difference between firm i’s return and stock market return.
it mt
it m R R AR ( ) (1)
bt mt
bt m R R AR ( ) (2)In Eqs. (1)-(2), Rmt is the return on the Dow Jones Stoxx Europe 600 index, which represents the overall
performance of 600 firms (small, medium and large market capitalization) listed in 18 European countries. The empirical results in Table 2 indicate that PIPO sample realized lower returns than private firm sample during the first month following the IPO. This finding is in line with the previous studies showing that PIPO firms are less efficient than the listed private firms (Vieira and Serra, 2006). Although the difference between PIPO returns and
private firm returns takes a positive value from the 23rd month, it is not significant at the 5% level. The systematic
lack of significance does not allow us to definitively conclude on the superior performance of the PIPO sample over the reference sample.
Table 2 - Comparison of abnormal returns: ARit (PIPO sample) against ARbt (reference sample)
Date Group statistics T-test for mean equality
Sample Obs. Average Standard deviation Average return differentials t-stat. p-value
T1 1 162 0.0066 0.0553 -0.0271 0.9564 0.3479 2 162 0.0337 0.1068 T6 1 162 -0.0027 0.0787 -0.0186 0.6778 0.5025 2 162 0.0159 0.0854 T12 1 162 -0.0084 0.0944 -0.0233 0.7939 0.4329 2 162 0.0149 0.0812 T18 1 162 -0.0009 0.0460 -0.0260 1.3430 0.1894 2 162 0.0251 0.0679 T24 1 162 0.0560 0.1205 +0.0226 -0.6682 0.5093 2 162 0.0334 0.0783 T30 1 162 0.0072 0.2275 +0.0260 -0.4540 0.6544 2 162 -0.0188 0.0854 T36 1 162 0.0411 0.0947 +0.0461 -1.5159 0.1389 2 162 -0.0050 0.0875
Notes: See notes of Table 1.
Table 3 presents a more elaborated comparison of cumulative abnormal returns over a period of τ months. We find a remarkable increase in the performance of the PIPO firms. The cumulative return differentials are mostly
positive in favor of the PIPO sample, but are not statistically significant. These results are thus in line with our pre-vious analysis on returns and abnormal returns.
Table 3 - Comparison of cumulative abnormal returns: CARit(PIPO sample) against CARbt (reference sample)
Date Group statistics Test-t for average equality
Sample Obs. Average Standard deviation Cumulative return differentials t-stat. p-value
T1 1 162 0.0066 0.0553 -0.0271 0.9423 0.3262 2 162 0.0337 0.1068 T6 1 162 0.0364 0.0682 -0.0300 0.5994 0.4548 2 162 0.0664 0.0796 T12 1 162 0.0869 0.0892 0.0154 0.8132 0.5162 2 162 0.0715 0.0795 T18 1 162 0.1060 0.0476 0.0154 0.9232 0.1785 2 162 0.0906 0.0716 T24 1 162 0.0881 0.1109 -0.0419 -0.6256 0.5256 2 162 0.1300 0.0695 T30 1 162 0.1451 0.2263 0.0201 -0.4245 0.5625 2 162 0.1250 0.0796 T36 1 162 0.2026 0.0952 0.0773 -1.2325 0.1215 2 162 0.1253 0.0799
Notes: See notes of Table 1.
Even though our results allow us to show that the PIPO firms have achieved a substantial improvement in market performance over the 36-month period following their IPOs, their performance is not significantly higher than that of the listed private firms.
3.2 Test of nullity of the cumulative abnormal returns
We now use a more robust test proposed by Barber and Lyon (1997) to examine whether the cumulative abnormal returns are different from zero. We determine the cumulative abnormal returns (CARs) as follows:
T t it mt T t it it m AR m R R CAR 1 1 ) ( ) ( (3.1)
T t bt mt T t bt bt m AR m R R CAR 1 1 ) ( ) ( (3.2)
T t it bt T t it it b AR b R R CAR 1 1 ) ( ) ( (3.3)where Rit, Rbt, and Rmtrefer to the average stock return of the PIPO sample, the average stock return of the
refer-ence sample, and the stock market return. t denotes the time period. According to Ritter (1991) and Barber and Lyon
(1997), we examine the significance of the CARs using the following test statistics:
Cov t Var t n CAR t t t ) 1 ( * (4)
where nt is the number of firms in the sample for the month t. Var represents the average variance of the abnormal
returns of the considered sample over the 36-month period and Cov represents the first-order autocovariance of the
abnormal returns.
Table 4 reports the results. The CARit(m) are significantly different from zero for the first several months
(2nd, 4th, 5th, 7th and 11th month), showing that the PIPO firms perform better than the market in the short term. This is equally an evidence of IPO underpricing owing to the cost of going public as well as the governmental strategy
that aims to ease the privatization of inefficient public firms. The null hypothesis of CAR nullity cannot be rejected from the 12th month. This result suggests that over time the PIPO firms align with a normal functioning of listed firms and achieve the same performance as the market average.
Table 4 - Test of nullity of CARs
Month 1 2 3 4 5 6 7 8 9 10 11 12 CARit(m) 0.296 2.326* 0.589 2.158* 2.065* 1.312 2.102* 0.821 0.879 0.528 2.201* 1.123 CARit(b) 1.628 1.536 1.756 1.562 0.852 1.526 1.235 1.253 1.254 1.125 1.254 1.325 CARbt(m) 0.754 0.526 0.365 0.550 0.215 0.623 -0.365 -0.365 -0.956 -0.542 -0.754 -0.852 Month 13 14 15 16 17 18 19 20 21 22 23 24 CARit(m) 1.053 1.145 1.321 1.041 1.129 1.035 1.162 1.162 1.216 1.667 1.187 1.203 CARit(b) 1.425 2.145 * 2.054* 1.950 2.152* 1.698 2.029* 2.187* 2.232* 1.961 2.058* 2.139* CARbt(m) -0.812 -0.712 -0.745 -0.625 -0.745 -0.967 -1.085 -0.982 -1.059 -1.365 -1.159 -1.023 Month 25 26 27 28 29 30 31 32 33 34 35 36 CARit(m) 1.562 1.203 1.108 1.025 0.987 0.745 1.008 0.925 0.845 0.749 0.662 0.762 CARit(b) 1.925 1.754 1.245 2.012* 1.765 1.529 1.487 1.385 1.425 1.209 1.192 1.289 CARbt(m) -0.958 -1.108 -0.852 -0.528 -0.628 -0.784 -0.859 -0.496 -0.287 -0.487 -0.298 -0.309 Notes: this table shows the ratios of Students (statistic-t) of the nullity test of CAR. * indicates the rejection of the null hypothesis at the level of 5%.
The test results for CARit(b) are more significant than for CARit(m). 9 of 36 months have significant
abnor-mal returns, suggesting the medium-term outperformance of the PIPO firms (from the 12th month to 28th month) over the listed private firms. The results related to CARbt(m) indicate that stock returns of the private firms tend to
align more with the market as all the CARbt(m) coefficients are not significantly different from zero.
Taken together, the tests on CARs suggest that stock returns of the PIPO firms are higher than those of the
private firms in the medium-term horizon.
3.3 Test based on the “buy and hold” abnormal returns (BHAR)
Barber and Lyon (1997) suggest the use of the buy and hold abnormal returns (BHAR) to avoid potential
biases in measuring the long-run performance of PIPO firms. Two possible biases, most often cited in literature,
include the pricing of new issues and the portfolio’s rebalancing (Kothari and Warner, 1997).3 The BHAR approach
compares the long-run performance between event firms (PIPO firms) and reference firms (listed private firms) through calculating the difference between their long-run buy-and-hold returns over the same period.
More specifically, we define the BHAR for firm i over a period of T months as
T t bt T t it T b T i iT b BHR BHR r r BHAR 1 1 , , (1 ) 1 (1 ) 1 ) ( (5) T t mt T t it T m T i iT m BHR BHR r r BHAR 1 1 , , (1 ) 1 (1 ) 1 ) ( (6) T t mt T t bt T m T b bT m BHR BHR r r BHAR 1 1 , , (1 ) 1 (1 ) 1 ) (
where BHRi,T, BHRb,T and BHRm,T are the buy and hold return of the sample firm (PIPO), the buy and hold return of the reference firm, and the buy and hold return of the market index.
3
Blume and Stambaugh (1983) point out the rebalancing bias. They show that there is an upward bias in the measurement of benchmark portfolio returns formed by small businesses because of asynchronous transactions and of the price range rebounded when the benchmark portfolio is rebalanced. The upward bias affects the measurement of the abnormal returns because the studied portfolio is not perfectly rebalanced.
We then test the null hypothesis that the BHARs are equal to zero using the skewness-adjusted t* statistic proposed by Lyon and al. (1999). This statistic is defined as
) ˆ 6 1 ˆ 3 1 ( 2 *
S S n t (7) where t BHAR t BHAR S for t = 1, 12, 18, 24, 30 and 36 months,
3 1 3 ) ( ˆ t BHAR n i it t n BHAR BHAR
is an estimator of the
skew-ness coefficient, and n is the number of firms in the sample.
Table 5 shows the obtained results for the time periods of 6, 12, 18, 24, 30 and 36 months following the privatization. We find evidence of short-term outperformance of the PIPO firms over the market after 6-month peri-od and over the matching firms after 6-month and 12-month periperi-ods. For these time periperi-ods, the null hypothesis of
nullity of BHARs in Eqs (5)-(6) cannot be rejected. Our results thus confirm partially the studies of Perotti (1995),
Perotti and Guney (1993), and Jenkinson and Mayer (1988), which document a strong performance of the PIPO firms. The test applied to BHARbt(m) does not give rise to any significant difference in the buy and hold returns
between listed private firms and the market index.
Table 5 – Test of nullity of BHARs
t BHARiT(m) Skewness t-statistic BHARiT(b) Skewness t-statistic BHARbT(m) Skewness Statistic- t
6 0.032* -0.062 2.003 0.092* -0.142 1.991 -0.016 0.312 0.314 12 0.056 0.056 -0.192 0.162* -1.413 2.005 -0.052 -1.452 -1.223 18 0.096 -0.106 1.212 0.609 0.298 0.967 -0.032 0.356 -1.479 24 0.79 0.526 1.224 0.008 -0.003 0.332 0.096 -0.029 0.081 30 -0.003 0.809 0.332 -0.996 0.259 1.852 0.083 0.491 0.965 36 -0.015 0.653 1.289 0.129 0.154 1.885 0.063 0.452 0.873
Notes: this table shows the ratios of Students (t-statistics) of the nullity test of the compound abnormal returns. * indicates the rejection of the null hypothesis at the level of 5%.
Overall, the findings from the BHAR approach are consistent with those from AR and CAR analyses. They
indicate the improved market performance of the PIPO firms in the short-run after being privatized. The explanatory factors include, among others, the market-oriented business management method, the IPO underpricing, and the information asymmetry between share issuers and other market participants (Rock, 1986; Baron, 1982). In case of PIPO firms, the willingness of the governments to succeed in its operations by devaluing its own shares is particular-ly underscored.
4. CONCLUSION
We investigate the performance of the European firms privatized by means of IPOs. The study is motivated by the lack of empirical works at the European level and the fact that most of privatization operations in Europe over the last decade were effectuated through IPOs. Our results show that stock returns of the PIPO firms are not signifi-cantly different from those of the listed matching firms. However, the analysis of cumulative abnormal returns re-veals the superior performance of the PIPO firms in the short-term, as compared to the matching firms. This result is confirmed by the tests on buy and hold abnormal returns. The evidence of improved short-term performance is sup-ported by the traditional view that governments try to devalue their holdings to succeed in their IPO operations (Loughran and al., 1994). It is also explained by the changes in the productive and organizational functioning within the firms after privatization (Ritter, 1991; Levis 1993).
AUTHOR INFORMATION
Haykel Hamdi, Ph.D., University Paris II Panthéon Assas, France. E-mail: [email protected]
Duc Khuong Nguyen, Ph.D., IPAG Business School, 184, Boulevard Saint-Germain, 75006 Paris, France. E-mail:
Hassan Obeid, Ph.D., European Business School – Paris, France. E-mail: [email protected] REFERENCES
1. Aussenegg, W. (2000). Privatisation versus Private Sector Initial Public Offering in Poland. Multinational
Finance Journal, 4(1/2), 69-97.
2. Aussenegg, W., Jelic, K. (2007). Operating Performance of Newly Privatized Firms in Central European
Transition Economies. European Financial Management, 13(5), 853-879.
3. Barber, B.M., Lyon, J.D. (1997). Detecting Long-Run Abnormal Stock Returns: The Empirical Power and
Specification of Test Statistics. Journal of Financial Economics, 43(3), 341-372.
4. Baron, D.P. (1982). A Model of the Demand for Investment Banking Advising and Distribution Services
for New Issues. Journal of Finance, 47, 955-976.
5. Blume, M.E., Stambaugh, R.F. (1983). Biases in Computed Returns - an Application to the Size Effect.
Journal of Financial Economics, 12, 387-404.
6. Bortolotti B., Milella V., (2008). Privatization in Western Europe: Stylized Facts, Outcomes, and Open
Issues. In G. Roland (ed.) Privatization Successes and Failures, Columbia University Press.
7. Boubakri, N., Cosset, J.C. (1998). The Financial and Operating Performance of Newly Privatized Firms:
Evidence from Developing Countries. Journal of Finance, 53(3), 1081-1110.
8. Boubakri, N., Cosset, J.C. (2000). The Aftermarket Performance of Privatization Offerings in Developing
Countries. Working Paper, HEC Montreal.
9. Choi, S.D., Lee, I., Megginson, W.L. (2010). Do Privatization IPOs Outperform in the Long Run?
Finan-cial Management, 39(1), 153-185.
10. Choi, S-D., Nam, S-K., (1998). The Short Run Performance of Privately and Publicly-Owned Firms:
Inter-national Evidence. Multinational Finance Journal, 2(3), 225-244.
11. Comstock, A., Kish, R., Vasconcellos, G. (2003). The Post-Privatization Performance of Former
State-Owned Enterprises. Journal of International Financial Markets, Institutions and Money, 13, 19-37.
12. D’Souza J., Megginson, W.L., (1999). The Financial and Operating Performance of Privatized Firms
dur-ing the 1990s. Journal of Finance, 4, 1397-1438.
13. D’Souza, J., Megginson, W.L., Nash, R.C. (2005). Effect of Institutional and Firm-specific Characteristics
on Post-privatization Performance: Evidence from Developed Countries. Journal of Corporate Finance,
11, 747-766.
14. D’Souza, J., Megginson, W.L., Nash, R.C. (2007). The Effects of Changes in Corporate Governance and
Restructurings on Operating Performance: Evidence from Privatizations. Global Finance Journal, 18(2),
157-184.
15. Dewenter, K.L., Malatesta, P.H. (1997). Public Offerings of State-owned and Privately-owned Enterprises:
An International Comparison. Journal of Finance, 52, 1659-1679.
16. Florio, M., Manzoni, K. (2004). Abnormal Returns of UK Privatizations: from Underpricing to
Outperfor-mance. Applied Economics, 36(2), 119-136.
17. Gajewski, J-F., Gresse, C. (2006). A survey of the European IPO market. European Capital Market
Insti-tute, Centre for European Policy Studies.
18. Grinblatt, M., Titman, S. (1998). Financial Market and Corporate Strategy. Irwin Professional Publishing.
19. Huang, Q., Levich, R.M. (2003). Underpricing of New Equity Offerings by Privatized Firms: An
Interna-tional Test. International Journal of Theoretical and Applied Finance, 6(1), 1-30.
20. Jelic, R., Briston, R. (1999). Hungarian Privatization Strategy and Financial Performance of Privatized
Companies. Journal of Business Finance and Accounting, 26, 1319-1357.
21. Jelic, R., Briston, R. (2003). Privatisation Initial Public Offerings: The Polish Experience. European
Fi-nancial Management, 9(4), 457-484.
22. Jenkinson, T., Mayer, C. (1988). The Privatization Process in France and the UK. European Economic
Review, 32, 482-490.
23. Kikeri, S., Nellis, J., Shirley, M. (1992). Privatization: the Lessons of Experience. World Bank
Publica-tions, Washington, DC.
24. Levis, M. (1993). The Long-Run Performance of Initial Public Offerings: The U.K. Experience. Financial
25. Ljungqvist, A. (2007).IPO Underpricing. In B. Espen Eckbo (ed.) Handbook of Empirical Corporate Fnance, Elsevier/North-Holland), pp. 375-422.
26. Loughran, T., Ritter, J.R., Rydqvist, K. (1994). Initial Public Offerings: International Insights.
Pacific-Basin Finance Journal, 2, 165-199.
27. Lyon, J.D., Barber, B.M., Tsai, C.-L. (1999). Improved Methods for Tests of Long-Run Abnormal Stock
Returns. Journal of Finance, 54(1), 165-201.
28. Megginson, W.L., Nash, R.C., Netter, J.M., Schwartz, A.L. (2000). The Long-run Return to Investors in
Share Issue Privatizations. Financial Management, 29(1), 67-77.
29. Megginson, W.L., Nash, R.C., Van Randenborgh, M. (1994). The Financial and Operating Performance of
Newly Privatized Firms: an International Empirical Analysis. Journal of Finance, 69(2), 403-452.
30. Megginson, W.L., Netter, J.M. (2001). From State to Market: A Survey of Empirical Studies on
Privatiza-tion. Journal of Economic Literature, 39(2), 321-389.
31. Menyah, K., Paudyal, K., Inyangete, C.G. (1995). Subscriber Return, Underpricing, and Long-term
Per-formance of U.K. Privatization Initial Public Offers. Journal of Economics and Business, 47, 473-495.
32. Paudyal, K., Saadouni, B., Briston, R. (1998). Privatization Initial Public Offering in Malaysia: Initial
Pre-mium and Long-Term Performance. Pacific-Basin Finance Journal, 6, 427-451.
33. Perotti, E.C. (1995). Credible Privatization. American Economic Review, 85, 847-859.
34. Perotti, E.C., Guney, S.E. (1993). The Structure of Privatization Plans. Financial Management, 22, 84-98.
35. Ritter, J.R. (1987). The Costs of Going Public. Journal of Financial Economics, 19, 269-282.
36. Rock, K. (1986). Why New Issues are Underpriced. Journal of Financial Economics, 15, 187-212.
37. Vieira, C., Serra, A.P. (2006). Abnormal Returns in Privatization Public Offerings: The Case of Portuguese