1
Imperial College London
Department of Materials
Phase Stability in Steels under Electropulsing
Wenjun Lu
A dissertation submitted in partial fulfilment of requirements for the degree of Doctor of Philosophy of Imperial College London September 2015
3
STATEMENT OF COPYRIGHT
The copyright of this thesis rests with the author and is made available under a Creative Commons Attribution Non-Commercial No Derivatives licence. Researchers are free to copy, distribute to transmit the thesis on the condition that they attribute it, that they do not use it for commercial purposes and that they do not alter, transform or build upon it. For any reuse or redistribution, researchers must make clear to others the licence terms of this work.
4
DECLARATION OF ORIGINALITY
Wenjun Lu, hereby declare that the contents of this thesis “Phase Stability in Steels by Electropulsing” belongs to my own. Neither this thesis nor the work contained within have been submitted elsewhere for any other qualification. The contents of this thesis are the results of my own research conducted under the supervision of Prof. Rongshan Qin. All work of others has been acknowledged and referenced in the form of a list of sources.
5
Abstract
There are increasing interests to alternate the microstructure and hence the properties of steels that are applied in various environment conditions using a work-efficient and energy-saving manner. The desirable microstructure evolution is often not achievable by means of conventional thermo-mechanical processing and solid-state phase transition. This thesis has considered four fundamental engineering problems, namely (i) the possibility of anti-aging processing for the aged steels in service at high temperature, (ii) the recovery of the lost strength for the steels at high temperature, (iii) the suspension of crack initiation and propagation during cold-working of steels with eutectoid microstructures and (iv) the regaining of strength during tempering of a steel containing martensite. Phase stability in the processing environment is the primary concern in each of the list problems because it presents, in thermodynamically, the possibility to achieve the goals using the designed processing. Electropulsing processing has been considered and integrated with the conventional thermomechanical processing in the development of this PhD thesis. The so-called electropulsing treatment utilises electric current pulses with high peak current density and short pulse duration. Due to the nature of the short duration pulse, the energy consumption is very low. The high current density enables a very strong impact of electropulsing on the microstructure evolution and hence is work efficient.
Following results have been obtained through the study:
Using the appropriate electropulsing parameters, the formed secondary phase (e.g. χ -phase) by precipitation in 316L stainless steels at elevated temperature can be dissolved. Electropulsing processing can supress the precipitation and homogenize the alloying
6
elements in the stainless steel. The stability of the secondary phases in the stainless steel has been changed by the imposed electropulse.
Electropulsing treatment is able to alternate the delta-ferrite phase transition. This has been proved in the treatment of 2205 duplex stainless steel. The new format of phase transition causes strengthening of the steel at high temperature. The stability of phases in the steel has been affected by the applied electropulsing treatment.
For the light steels containing high aluminium composition, electropulsing is able to affect the thermodynamic stability and grain morphology of κ-carbide. This leads to significant improvement of steel formability.
Application of electropulsing processing to dual-phase automotive steel changes the stability of martensite phase. The processing improve the mechanical properties and refined the microstructure of this steel.
The fundamental understanding of the experimental observations has been developed based on the thermodynamic and kinetic analysis.
7
Acknowledgements
The author is grateful to Prof Rongshan Qin for his encouragement and supervision throughout this project. He would like to thank Prof Kenneth C. Mills and Dr Xinfang Zhang for fruitful discussions, and also to all members of the Steel Processing Group for their advice and help.
The author is grateful to TATA Steel and Engineering and Physical Sciences Research Council (EPSRC) for financial support of this research.
The author would like to express his acknowledgement to his family members, friends and colleagues for their support and encouragement. The author would be harder without their help and support during the three years PhD study.
8
“Developing the ability of thinking and judging independently instead of obtaining professional knowledge should be put in the first place.”
9
List of Figures
Figure 2.1: Schematic illustration of a linear relationship between flow stress and MFFP for a carbon steel.
Figure 2.2: The influence of secondary phases with different morphologies (spherical, pearlitic and elongated carbides) on the ductility of steel.
Figure 2.3: Schematic diagram of general corrosion process for steels under high-concentration chloride environments.
Figure 2.4: Schematic diagrams of molecular structure of (a) austenite (FCC) and (b) ferrite (BCC).
Figure 2.5: Schematic diagram of dislocation pile-up in (a) fine grain and (b) coarse grain. Figure 2.6: The relationship between yield stress and grain size of mild steel at 18 ºC.
Figure 2.7: The relations between true strain and grain size for 1100-Al and interstitial free steel.
Figure 2.8: Schematic drawings of nano-scale twinning with twin layer thickness (λ) and twin boundary spacing (∆), and a twin boundary structure.
Figure 2.9: Schematic showing of the dislocation motions in stage (1), stage (2) and stage (3). Figure. 2.10: The effect of EPT on microstructure and properties of polycrystalline metals and alloys.
10
Figure 2.11: The grain refinement of materials under EPT: The fabrication of ultrafine grained microstructure via solidification (high temperature) and the formation of nano-scale grains via crystallization or solid state phase transformation (low temperature).
Figure 2.12: Schematic diagrams of inclusion movement in alloys under EPT.
Figure 2.13: Schematic diagram of dislocation movement under EPT. The motion of dislocation can be effectively accelerated by transferring energy from electrons via collision. The direction of electrons is opposite to the direction of electric filed between anode and cathode.
Figure 2.14: A process of crack healing in a medium carbon steel under EPT. Left: A precrack is manually created in steel sample; middle: EPT is applied across the steel sample between anode and cathode; and Right: The precrack is partially healed under EPT.
Figure 2.15: A schematic diagram to describe relationships between EPT and microstructure evolutions in literature.
Figure 2.16: A schematic diagram of EPT on phase stability via changing Gibbs free energy:
0 e
G indicates the phase stability is favourable, whereas Ge 0 shows the phase stability is
disfavourable. Ge0 means no any influence on stability of phase in an electric-current free
system.
Figure 2.17: A schematic description of effects of EPT on four specific steels especially the phase stabilities. This includes the precipitation in 316L austenitic stainless steel, phase transformation in 2205 duplex stainless steel, cracking in duplex lightweight steel and softening in dual-phase steel.
11
Figure 3.2: Experimental set-up of EPT processing.
Figure 3.3: Photographs depicting sample preparation procedures: (a) a mounting machine with (b) Mounting power, (c) a grinding and polishing machine with (d) grinding and polishing lubricant, (e) chemical etching and (f) optical microscope.
Figure 3.4: Photographs showing (a) a SEM JEOL 6400 microscope with (b) WDS and (c) EBSD, and a SEM LEO microscope.
Figure 3.5: Photographs of (a) a sparking machine and (b) electro-jet polishing machine for TEM sample preparation, and (c) a TEM 2000FX microscope.
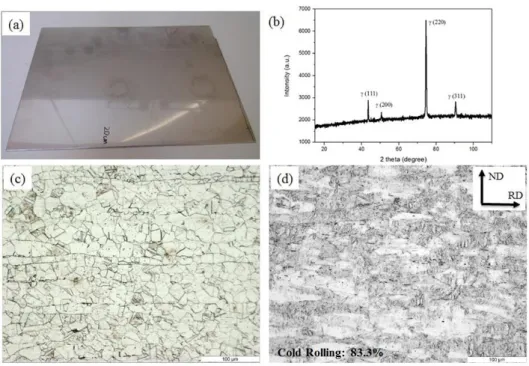
Figure 3.6: Photographs showing (a) a commercial 316L austenitic stainless steel plate, (b) a XRD spectra for as-received 316L stainless steel specimen, (c) an optical micrograph of hot-rolled steel specimen and (d) an optical micrograph of cold-hot-rolled steel specimen.
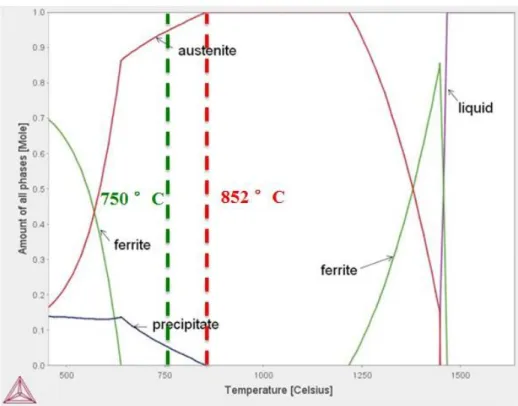
Figure 3.7: An equilibrium phase diagram of 316L stainless steels calculated using a commercial software, Thermo_Calc 3.0 with TCFE7 database.
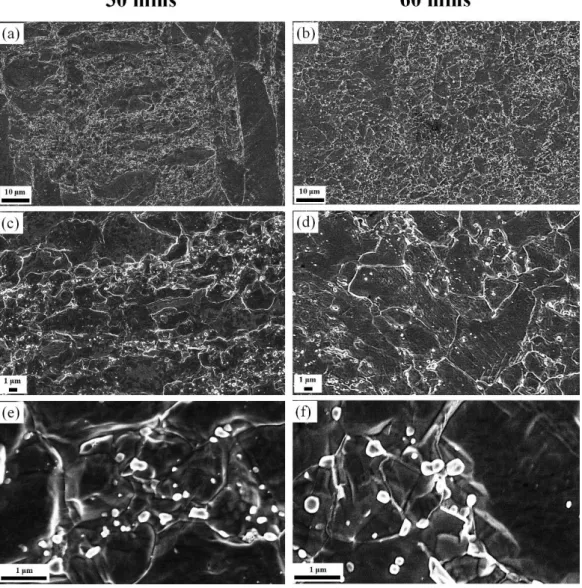
Figure 3.8: SEM micrographs of the cold rolled steel sample (83.3%) at 750 oC for (a), (c)
and (e) 30 mins and for (b), (d) and (f) 60 mins.
Figure 3.9: (a) Typical SEM micrograph of steel sample at 750 oC for 60 mins, and EDS
spectra for (b) white precipitates and (c) dark steel matrix.
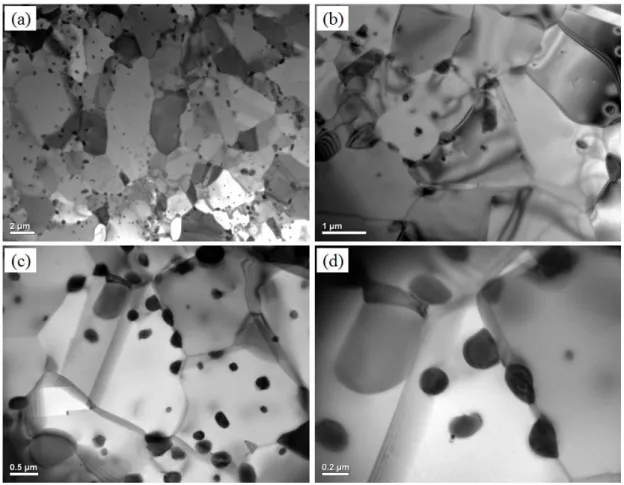
Figure 3.10: TEM micrographs for the steel sample microstructure annealed at 750 oC for 60
12
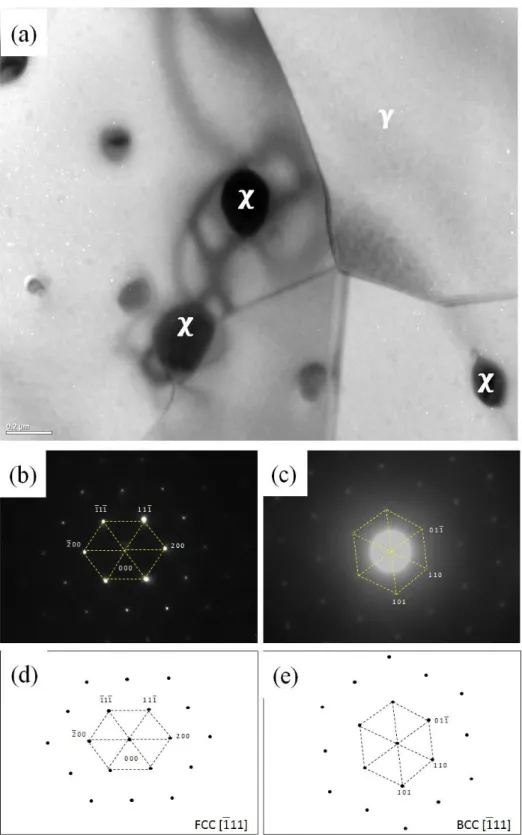
Figure 3.11: (a) TEM image for bright field of steel microstructure, (b) and (d) are the SADP of austenite matrix and its corresponding schematic diagram, respectively, and (c) and (e) are the SADP of χ phase and its corresponding schematic diagram, respectively.
Figure 3.12: SEM images of (a), (c) and (e) the distribution of χ phase in the sample without EPT; (b), (d) and (f) the distribution of χ phase in steel sample with EPT. (g) and (h) the number distribution of χ phase in steel samples without and with EPT, respectively.
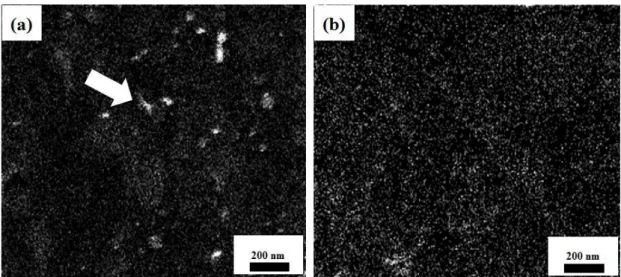
Figure 3.13: FIB-SIMS elementary mapping for Mo distribution in steel samples (a) without EPT and (b) with EPT.
Figure 3.14: EBSD mapping for grain size measurement: (a) and (c) steel sample without EPT at different magnifications; (b) and (d) steel sample with EPT at different magnifications.
Figure 3.15: EBSD mapping for grain boundary portion measurement: (a) and (c) steel sample without EPT at different magnifications; (b) and (d) steel sample with EPT at different magnifications.
Figure 3.16: Schematic diagrams of spherical precipitate in steel matrix under EPT. (a) represents the distribution of current across the microstructure consisting of a precipitate (B) and steel matrix (A): the electrical conductivity of precipitate is the same as steel matrix). The current lines directly pass the precipitate and matrix without any changing. (b) shows the distribution of current across the microstructure consisting of a precipitate (C) and steel matrix (A): the electrical conductivity of a precipitate is less than that of steel matrix. The current lines are altered due to the discrepancy of electrical conductivity between precipitate and matrix.
13
Figure 3.17: Gibbs free energy change as a function of temperature for χ-phase and austenite. The red line represent the phase transformation temperature (χ-phase ↔ austenite), whereas the green line correspond to the operation temperature of current experiment.
Figure 4.1: A schematic diagram illustrates the microstructure of 2205 duplex stainless steel consisting of austenite (blue) and delta-ferrite phases (orange).
Figure 4.2: A steel specimen (2×1.5×15 mm) and its microstructure on longitudinal plane (contains both delta-ferrite and austenite). Note: ED is electric current direction (marked by orange arrow), ND is normal direction, TD is transverse direction and RD is rolling direction. Figure 4.3: Schematic diagram of the experimental set up for EPT.
Figure 4.4: Equilibrium phase diagram of a 2205 duplex stainless steel calculated by MTDATA with TCFE4 database. The blue, red and black lines represent the sigma, austenite and delta-ferrite phases, respectively.
Figure 4.5: SEM images for steel samples without EPT ((a) and (c)) and with EPT ((b) and (d)) in the longitudinal plane.
Figure 4.6: XRD spectra of steel samples without EPT and with EPT at 835C.
Figure 4.7: EBSD map for phase fraction measurement: (a) steel sample without EPT and (b) steel sample with EPT. Red region represents austenite, green region corresponds to delta-ferrite and white region is sigma phase.
Figure 4.8: EBSD mapping for grain size measurement: (a) steel sample without EPT and (b) steel sample with EPT.
14
Figure 4.9: EBSD maps for Σ3 grain boundary distribution measurement: (a) steel sample without EPT and (b) steel sample with EPT.
Figure 4.10: EDS spectra for austenite, delta-ferrite and sigma phases in the duplex stainless steel treated at 835 ºC (a) without EPT and (b) with EPT. The positions 1, 2 and 3 correspond to the sigma, austenite and delta-ferrite phases, respectively.
Figure 4.11: Vickers hardness of the samples without and with EPT.
Figure 4.12: A schematic diagram showing the diffusion mechanisms of alloying elements between delta-ferrite and austenite at high temperature treatment. The sigma phase and secondary austenite precipitate along the phase boundary between austenite and delta-ferrite. Figure 4.13: Electrical resistivity of iron as a function of temperature. Note: Tc is , Tα → γ is
transformation temperature from α-ferrite to -phase, Tγ → δ is transformation temperature
from -phase to δ-ferrite and Tm is melting point.
Figure 4.14: Schematic diagrams showing the effect of applying EPT on the phase transformation. (a) the original microstructure of alloy contains phase (B) and phase (A); (b) the phase transformation (i.e. the phase fraction change) is moved forward when the electrical conductivity of B is less than A; (c) the phase transformation is unaltered when the electrical conductivity of B is equal to A; (d) the phase transformation is retarded when the electrical conductivity of B is greater than A.
Figure 5.1: A schematic diagram showing the relationship between (Dα/Dγ) ratio and
temperature.
Figure 5.2: SEM micrographs of steel specimens annealed at (a-b) 600 oC for 6h, (c-d) 700 oC for 6h and (e-f) 800 oC for 6h.
15
Figure 5.3: SEM micrographs of (a) the nano-ordered κ-carbide within austenite and (c) the rod-like κ-carbide within ferrite; TEM bright images of (b) the nano-ordered κ-carbide within austenite and (d) the rod-like carbide within ferrite; (e) the SADP of the nano-ordered κ-carbide within austenite and their schematic diagram of SADP and (f) the SADP of rod-like κ-carbide within austenite and their schematic diagram of SADP.
Figure 5.4: (a) XRD spectra for steel specimens annealed at 600-800 oC for 6h, (b) the
calculated volume fraction of phases (austenite, ferrite and κ-carbide) via XRD results and (c) the Vickers hardness value of steel specimens annealed at 600-800 oC for ferrite and austenite
regions.
Figure 5.5: (a) SEM micrograph of the specific region contains three phases: austenite + ferrite, austenite + κ-carbide and carbide free austenite, (b) chemical compositions of alloying elements (Mn, Al and Fe) across the area marked by the red line, (c) a schematic diagram of lattice mismatch for 2 × 2 × 2 cells between κ-carbide and austenite, and (d) a schematic diagram of lattice mismatch for 2 × 2 × 2 cells between κ-carbide and ferrite.
Figure 5.6: Schematic diagram showing a standard κ-carbide crystal structure.
Figure 5.7: Photographs showing a process for steelmaking using induction furnace: (a) an induction furnace, (b) melting the steel and (c) waiting for the steel to cool.
Figure 5.8: Schematic diagram showing the preheat treatment, rolling and annealing parameters for Fe-26Mn-9Al-0.75C (wt.%) steel specimens.
Figure 5.9: (a) Optical, (b) SEM, (c) TEM pictures, (d)-(e) diffraction patterns analysis of austenite and (f)-(g) diffraction patterns analysis of ferrite in the cold rolled specimen. All yellow arrows represent the cold rolling directions.
16
Figure 5.11: X-ray diffraction spectra (Cu Kα incident radiation) of steel specimens annealed at
500-1000 oC.
Figure 5.12: The volume fraction of each phase and theVickers hardness of sample as a function of temperature.
Figure 5.13: A schematic drawing of a stress-strain curve for the steel sample annealed at 600
oC for 6h.
Figure 5.14: SEM micrographs showing (a) the microstructure evolutions of A1 annealed at 500 oC for 6 h, (b) κ-carbides precipitated at the phase boundary between α and γ, (c) lamellar
κ-carbides starting to form at the grain boundary of γ and (d) particulate κ-carbides precipitated within α. Note: the position 1, 2 and 3 represent the austenite, phase boundary and ferrite, respectively.
Figure 5.15: SEM micrographs showing (a) the microstructure evolutions of A2 annealed at 600 oC
for 6 h ,(b) κ-carbides coarsen at the phase boundary between α and γ, (c) lamellar κ-carbides fully precipitated by eutectiod decomposition within and γ and (d) particular κ-carbides coarsen within α.
Figure 5.16: SEM micrographs illustrating (a) the microstructure evolution of sample A5 annealed at 700 oC for 6 h, (b) κ-carbides continually coarsen at the phase boundary between α and γ, (c) lamellar
κ-carbides starting to spherodize and (d) particulate κ-carbides continually coarsening at grain boundary of α as band shape and in the grain interior as needle shape.
Figure 5.17: SEM micrographs illustrating (a) the microstructure evolutions of A8 annealed at 800
oC for 6 h, (b) κ-carbides dissolving completely at the phase boundary between α and γ, (c) spherical
κ-carbides partially dissolving within the austenite matrix and (d) all κ-carbides dissolving within the ferrite matrix.
17
Figure 5.18: SEM micrographs illustrating (a) the microstructure evolution of sample A11, annealed at 900 oC for 6 h and (b) the microstructure evolution of sample A12 annealed at 1000 oC for 6 h. All
κ-carbides in either position 1, 2 or 3 are dissolved completely.
Figure 5.19: A schematic graph showing the 5 stages of microstructure evolution of steel specimens as a function of temperature.
Figure 5.20: (a) TEM bright field image of A2 steel specimen, (b) SADP and (c) its corresponding schematic diagram of the N-W orientation relationship between κ-carbide and ferrite.
Figure 5.21: TEM micrographs in A11 steel show (a) bright field image of austenite and (b) its associated SADP; (c) bright field image of ferrite and (d) its corresponding SADP.
Figure 5.22: SEM micrographs of the (a-b) A2 with different magnifications, (c-d) A3 with different magnifications and (e-f) A4 with different magnifications, and they show that lamellar κ-carbides are continually coarsening in the steel matrix at 600 oC for 6 to 100h. Figure 5.23: SEM micrographs of the (a-b) A5 with different magnifications, (c-d) A6 with different magnifications and (e-f) A7 with different magnifications, and they show that lamellar κ-carbides are transformed into spherical particles within austenite region and some boundary κ-carbide and needle -shaped κ-carbide start to precipitate in ferrite region at 700
oC for 6 to 100h.
Figure 5.24: SEM micrographs of the (a-b) A8 with different magnification, (c-d) A9 with different magnification, (e-f) A10 with different magnification. They show that the spherical κ-carbide within the austenite region is growing continually and all κ-carbide in the ferrite region dissolves at 800 oC for 6 to 100h.
18
Figure 5.25: Vickers hardness of κ-carbide with (a) lamellar- shaped carbide in austenite at 600 oC for 6-100 h, (b) spherical- shaped carbide in austenite at 700 oC for 6-100 h and (c) spherical- shaped carbide in austenite at 800 oC for 6-100 h.
Figure 5.26: Diagrams showing (a) the growth rate of κ-carbide and (b) the increase in hardness rate as functions of temperature.
Figure 5.27: Diagrams showing calculated equilibrium concentration of (a) C, (b) Al and (c) Mn in ferrite and austenite using Thermo-Calc software.
Figure 5.28: Diagram showing the relationship between the phase ratio, γ/α and temperature for C, Al and Mn in Fe-26Mn-9Al-0.75C steel.
Figure 5.29: A schematic graph of diffusion coefficient as a function of temperature for C, Al and Mn in steels.
Figure 5.30: (a) XRD spectra of (111)γ peaks and (b) the d-spacing of (111)γ peaks as a
function of temperature; (c) XRD spectra of (110)α peaks and the d-spacing of (110)α peaks
as a function of temperature. The red lines indicate the dissolution temperature of κ-carbides. Figure 5.31: Schematic diagrams showing the EPT experiment.
Figure 5.32: Optical micrographs of steel specimens (a) with 26Mn (b) with 34Mn, and their corresponding SEM images for microstructure (c) with 26Mn (d) with 34Mn. The TEM micrographs of (e) lamellar κ-carbide and (f) nano-ordered κ-carbide and their corresponding (g) SADP between lamellar κ-carbide and ferrite matrix, and (h) SADP between nano-ordered κ-carbide and austenite matrix.
Figure 5.33: SEM micrographs of steel specimens (a) without and (b) with EPT. Most of lamellar κ-carbides are fragmented into nano-sized spherical κ-carbide particles. The EBSD
19
maps of steel specimen with EPT (c-d) at different magnifications. The average grain size of steel specimen after EPT is appromately 1.46 μm.
Figure 5.34: TEM bright images of steel samples (a and c) without EPT and (b and d) with EPT. Selected area diffraction patterns of (e) κ-carbide, (f) ferrite and (g and h) the N-W orientation relationship between κ-carbide and ferrite and its corresponding schematic diagram, respectively.
Figure 6.1: Four stages in the softening process for the tempering of martenite in dual-phase steels.
Figure 6.2: Schematic diagrams showing (a) experimental set-up of EPT; (b) a dog-bone shape sample (length: 24 mm; width: 5 mm and thickness: 0.5 mm); (c) an optical microstructure of dual-phase steel consisting of ferrite and martensite and (d) a XRD spectrum showing only body centred cubic phases (ferrite or martensite) exist in the steel sample. Note: F is ferrite and M is martensite.
Figure 6.3: SEM images of steel samples (a and c) without EPT at different magnifications, (b and d) with EPT at different magnifications; TEM bright images of steel samples (e) without EPT and (f) with EPT; selected area diffraction pattern (SADP) for (g) martensite laths and (h) ferrite grains with cementite particle. Note: α’ is martensite, Tα’(α+θ) is tempering martensite and α is ferrite.
Figure 6.4: Diagram showing typical tensile engineering stress-strain curves of dual-phase steel samples (with and without EPT).
Figure 6.5: Diagrams showing a typical softening process contains four stages for the hardness of Fe-C martensitic steel tempered 1h at 100-700 oC and (b) the hardness of
dual-20
phase steels tempered at about 700 oC for 110 μs (EPT), 0.1s<t<1 s (non-isothermal
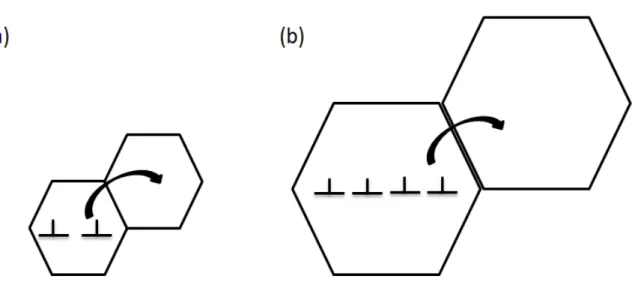
tempering), 300s (isothermal tempering) and 5400s (isothermal tempering), respectively. Figure 6.6: Diagrams showing (a) the microstructural evolution of dislocations in cold-formed steel sample, (b) the effect of EPT on intersection and annihilation of two partial dislocations and (c) the formation of ultrafine-grained ferrite with nano-cementite particles after EPT.
Tables
Table 2.1: Applications of electric-current treatments on precipitations in alloys. Table 2.2: Applications of EPT on phase transformations in alloys.
Table 2.3: Applications of EPT on grain refinement for alloys.
Table 2.4: Applications of EPT on grain rotation and texture for alloys.
Table 2.5: Applications of EPT on motion of electrically non-metallic particles in alloys. Table 2.6: Applications of EPT on dislocation movement in alloys.
Table 2.7: Applications of EPT on crack healing for alloys.
Table 4.1: The volume fraction of all phases (delta-ferrite, austenite and sigma phases) in steels without and with EPT.
Table 4.2: Chemical compositions of austenite, delta-ferrite and sigma phases measured by EDS for the steel samples without and with EPT.
21
Table 5.2: 5 phase transformation stages in Fe-26Mn-9Al-0.75C steel. Table 5.3: Factors related to diffusion coefficient of C, Mn and Al in steels. Table 5.4: Chemical compositions of two steels used in current experiment. Table 5.5: The thermomechanical processing parameters for two steels.
Table 6.1: Mechanical properties (e.g. yield stress, UTS and elongation) of steel samples without and with EPT.
Table 7.1: Thesis review consists of four main sections.
22
Symbols
EPT - electropulsing treatment
s
- yield strength 0
or
y - yield stress vH
- Vickers hardnessT
- dislocation's line tensionb
- burger vector
- interparticle spacing
- the constantG
- shear modulusr
- radiusMFFP - mean uninterrupted free ferrite path
d
- grain size0
- friction stress constantsy
K - unpinning parameters (breaking away of dislocation from interstitial sites) λ - twin layer thickness
23
∆ - twin boundary spacing
DPD – dynamic plastic deformation SPD – severe plastic deformation d.c. – direct current
a.c. alternative current
m
- mass p C - specific heat d
- density e
- electrical resistivityV
- volumeT
- temperature incrementj
- current densityt
- time interval ) t (
- maximum compressive forceE
- Young’s modulus of materialmax
T
- maximum temperature increment24
) t (
- dimensionless temperature increment (t)l - dimensionless thermal expansion
) t (
T
- instant temperature change
) t (
l
- instant thermal expansion
max
l
- maximum thermal expansionn
- density of conduction electrond
n
- density of defects d
- defect resistivity
- resistivity om
- free-electron mass *m
- effective electron masse
- elementary chargeE
- macroscopic electric field* wind
Z - effective valence
t
J
- atomic flux induced by temperaturea
25
D
- lattice diffusion coefficientN
- density of atom speciesa
D
- atomic diffusion coefficientf
- pulsed current frequency p
- duration of each pulsek
- gas constantT
- absolute temperatureEPT r
I - nucleation rate with EPT
o r
I - constant related to recrystallization
r
I - nucleation rate without EPT
- jump distanceo
n
- total number of atomsn
- number of nuclei under electric-current treatmentsv
- volume of material V R a R g 2 2 1 1 2 2 48 5 48 65 ln 2 3 - geometric factor)
,
(
1
2
- a factor26
1
- electrical conductivity of phase 12
- electrical conductivity of phase 2o
G
- Gibbs free energy without electric currente
G
- Gibbs free energy with electric currentc
G
- chemical free energyi
G
- interfacial energy sG
- strain-stress energyV
- infinitesimal volume S - infinitesimal displacement eF
- local electrophoresis force c
- density of conductive electron
d
v
- electron movement velocityt
- time for electrons movement H
- magnetic field strength
27
B - magnetic field
A - vector potential
r- random position of material
- magnetic permeabilityMa - pre-exponential factor dependent on the frequency of atom hipping and lattice distance
M - mobility
Ek - kinetic barrier
K - Boltzmann constant
M – mobility
A
- electrical conductivity of steel matrix A
B
- electrical conductivity of precipitate B
C
- electrical conductivity of precipitate B
Gtotal - total system free energy of 316L stainless steel without EPT chem
G
- chemical free energy of the bulk phasessurf
G
- surface energy
r jb - current density distribution before EPT
r ja 28 R - electrical resistance
i
X
- concentration of the ith solute ith - atom speciesi
N
- density of the ith atom species Ω - atom volumeX
- stress gradient
g - positive geometric factor for coarse grained materials
- volume of a nucleusA - frequency
Q - activation energy
- the surface energyL
- the spacing between pinning points FCC – face centred cubicBCC - body centred cubic
Tα → γ - transformation temperature from α-ferrite to -phase
Tγ → δ - transformation temperature from -phase to δ-ferrite
29
δ - delta-ferrite σ - sigma-phase
γ' - secondary austenite phase γ - austenite phase α - ferrite α’ - martensite θ - cementite Tα’(α+θ) - tempering martensite κ - kappa carbide χ – Chi phase d.c. - direct current a.c. - alternative current
- electrical conductivity of austenite
- electrical conductivity of ferrite
- electrical conductivity of cementite
- electrical conductivity of delta-ferrite
- electrical conductivity of chi-phase
30
- electrical conductivity of -carbide TEM - Transmission Electron Microscopy SEM - Scanning Electron Microscopy XRD - X-rays Diffraction
31
Content
Chapter 1 Introduction... 35
1.1. Background ... 35 1.2. Aims of the research ... 36 1.3. Outline of the thesis... 37
Chapter 2 Assessment of the literature ... 40
2.1 Microstructure and properties of steels ... 40 2.1.1 Precipitation ... 40 2.1.2 Solid-state phase transformation ... 46 2.1.3 Grain size effect ... 48 2.2 Effects of electropulsing on microstructure evolutions and properties ... 54 2.2.1 Precipitation ... 56 2.2.2 Phase transformation ... 60 2.2.3 Grain size ... 63 2.2.4 Grain orientation and texture ... 67 2.2.5 Control electrically non-metallic particles motion ... 71 2.2.6 Dislocation ... 73 2.2.7 Crack healing ... 76 2.2.8 Theoretical analysis of EPT ... 78
Chapter 3 Stability of chi-phase in austenitic stainless steel during pulsed electric
32
3.1 Introduction ... 91 3.2 Materials and methods ... 93 3.3 Experimental results ... 99 3.3.1 Effects of annealing on 316L stainless steel ... 99 3.3.2 Effects of EPT on 316L stainless steel ... 107 3.4 Discussion ... 113 3.4.1 Thermal effects of EPT on 316L stainless steels ... 113 3.4.2 Electric effects of EPT on 316L stainless steels ... 114 3.5 Conclusion ... 118
Chapter 4 Stability of delta-ferrite in 2205 duplex stainless steel with electropulsing .. 119
4.1 Introduction ... 119 4.2 Materials and methods ... 122 4.2.1 Materials selection and prior treatments ... 122 4.2.2 Experimental set-up of EPT ... 123 4.2.3 Metallographic observations and properties test ... 124 4.3 Experimental results ... 125 4.3.1 Thermodynamic calculation of equilibrium phase diagram ... 125 4.3.2 Microstructure observations ... 126 4.3.3 Property measurements... 133 4.4 Discussion ... 134 4.4.1 Thermal effect of EPT ... 134
33
4.4.2 Electric effect of EPT ... 135 4.5 Conclusions ... 142
Chapter 5 Stability of κ-carbide in duplex lightweight steels under electropulsing ... 144
5.1 Structure and properties of κ-carbides in duplex lightweight steels ... 144 5.1.1 Introduction ... 144 5.1.2 Materials and methods ... 145 5.1.3 Experimental results and discussion ... 146 5.1.4 Conclusion ... 155 5.2 κ-carbide hardening in a low-density high-Al high-Mn multiphase steel ... 156 5.2.1 Introduction ... 156 5.2.2 Materials and methods ... 160 5.2.3 Experimental results ... 164 5.2.4 Discussion ... 183 5.2.5 Conclusion ... 194 5.3 Electropulse-induced nanocrystallization of κ-carbide in duplex lightweight steels ... 195 5.3.1 Introduction ... 195 5.3.2 Materials and methods ... 197 5.3.3 Experimental results ... 200 5.3.4 Discussion ... 205 5.3.5 Conclusion ... 209
34
6.1 Introduction ... 210 6.2 Materials and methods ... 213 6.2.1 Material selections ... 213 6.2.2 Experimental setting ... 214 6.2.3 Microstructure observation ... 215 6.2.4 Property measurement ... 216 6.3 Results ... 216 6.3.1 Effects of EPT on microstructure evolutions ... 216 6.3.2 Effects of EPT on mechanical properties ... 218 6.4 Discussion ... 220 6.4.1 Thermal effect of EPT ... 220 6.4.2 Electric effect of EPT ... 222 6.5 Conclusions ... 226
Chapter 7 Conclusion ... 227 Chapter 8 Suggestions of future work ... 230 Reference ... 233 Chapter 9 Appendix ... 253
35
Chapter 1
Introduction
1.1. Background
Steels play an important role in improving the quality of life and servicing the manufacturing industry. This is achieved through its endless variety of microstructures and properties which can be produced by a series of complex routes such as, solid-state transformation (e.g. eutectoid transformation and spinodal decomposition) and thermo-mechanical processing (e.g. severe plastic deformation and dynamic plastic deformation) [1]. In comparison with other emerging, structural materials (e.g. Ti alloys, Ni alloys, Al alloys, Mg alloys and etc.), steels are high performance materials which have extraordinary properties. These properties include high strength, high ductility and good corrosion and oxidization resistance. In addition, steels have other attractive features, such as, low cost, high abundance of source materials (Fe and C) and good recyclability. These help steels to maintain its prime position in modern industry and society. The standard definition of steel is “Any iron based alloy, in which no other single element is present in excess of 30 % weight, and for which the iron content amounts to, at least, 55 % weight present and carbon is limited to a maximum of 2 % weight presenting” [2]. There are over 25000 different steels being developed by manipulating the microstructure evolution, phase transformations and alloying elements of the Fe-alloys in the world. Although steel is not a novel alloy (which frequently leads to a common misunderstanding that “everything in steel is established”) for those outside the field, the investigation of steel is probably the most challenging area in materials sciences, due to the many unknowns in steel design and processing.
Over the last decades, steels have been classified into various groups based on their microstructures and corresponding properties. A microstructure of steel matrix, with a wide
36
range of size and morphology of secondary phases and intermetallic compounds, frequently result in changes of the physical and chemical performance of steels at high temperatures. For instance, the segregation of alloying elements (e.g. Cr, Ni and Mo) around grain boundaries in stainless steel at high temperatures can introduce negative effects, such as pitting corrosion, thermal crack development and brittle transition of structure [1, 3]. Meanwhile, the phase transformation, initiated by various heat treatments, fundamentally changes the lattice structure and properties of steels [1]. Furthermore, on the basis of the Hall-Petch relationship [1], a microstructure with a smaller grain size induces higher strength in most polycrystalline steels. In addition, a promotion of dislocation mobility and reduction of residual stress within microstructures effectively enhance the formability of steels (especially, the ductility and superplasticity behaviour) during deformation. Therefore, microstructure evolution plays a dominant role in steel design and processing in order to achieve desired properties.
1.2. Aims of the research
The aim of this research was to develop a novel approach to achieve precise control of microstructure evolution in order to generate the desirable properties. The new approach changes the phase stability of the steels in the processing. Four fundamental problems are considered to seek the engineering implementation of the new processing, namely:
Ageing treatment: The segregation of alloying elements during the precipitation of chi-phase in 316L stainless steels.
Annealing treatment: The softening effect during delta-ferrite phase transformations in 2205 duplex stainless steels at high temperature.
Cold rolling: Crack initiation and propagation within eutectoid lamellar carbides in duplex lightweight steels (Fe-26Mn-9Al-0.75C).
37
Tempering treatment: The loss of strength during the tempering of martensite in dual-phase steels (DP600).
In order to minimize the detrimental effects of the above engineering problems in steel processing, the newly developed processing method is expected to be capable of (i) suppressing precipitation and thereby homogenising the alloying elements, (ii) introducing the strengthening effect during high temperature phase transformation, (iii) prohibiting crack- formation during cold deformation and (iv) delaying the loss of strength in tempering of martensite. In addition to this, the kinetics and thermodynamics involved in the processing are investigated. Electropusling treatment (EPT) has been implemented for purposes. EPT is unlike conventional methods but involves several modifiable parameters such as voltage (v), current density (A/m2), pulse duration (μs), pulse frequency (Hz) etc. It is capable of
providing accurate control of microstructure evolution and properties whilst maintaining high work-efficiency and low energy-consumption. EPT has been very successful in modifying microstructures for most of polycrystalline metals and alloys, and has been selected in this thesis to address the earlier list four problems for 316L stainless steels, 2205 duplex stainless steels, duplex lightweight steels (Fe-26Mn-9Al-0.75C) and dual-phase steels (DP600) respectively. There are no alternative solutions to address these problems to be found in the literature.
1.3. Outline of the thesis
The thesis is organised to demonstrate the investigation of the phase stability under EPT in four steels containing different phases and in service in different environments, which cover: (i) the suppression of precipitation by homogenizing alloying elements in 316L stainless steels, (ii) the promotion of high temperature phase transformation to strengthen 2205 duplex
38
stainless steel matrix, (iii) the enhancement of formability by refining carbides in duplex lightweight steels and (iv) the recovery of the loss of strength within tempering martensite in dual-phase steels. Following are brief descriptions for each investigation.
316L stainless steels
A treatment to suppress and dissolve the precipitates in 316L stainless steel in a temperature range between 650 oC and 850 oC has been investigated. There is no
published report on the effect of electric current on precipitates in austenitic stainless steels in the temperature range before this work. The effect of electric current on segregation of alloying elements has not been studied to date. There are no published data on the suppression and dissolution of precipitates using low power EPT (low current density ~6.3 ×10⁷ A/m2) in such alloys.
2205 duplex stainless steels
The 2205 duplex stainless steel containing high Cr and high Ni contents undergoes a eutectoid decomposition from delta-ferrite to austenite and sigma phases below 840 oC.
However, the steel loses its strength when the temperature attains 840 oC. Conventionally, changing the alloying additions has proved to be an effective way of altering delta-ferrite phase transformation behaviour (such as extending the temperature range for phase transformation). In the present work, low power EPT (using an electric current density around 5.0×10⁷ A/m2) has been utilized to stabilize the austenite and sigma phases and hence to strengthen the steels at high temperature.
Fe-26Mn-9Al-0.75C duplex lightweight steels
Fe-Mn-Al-C quaternary steel is a typical type of lightweight steel with low density (e.g. 6.47 g/m3, which gives 17.10 % density reduction in comparison with pure iron). It has
39
been extensively investigated in automotive and aerospace fields due to its excellent combination of strength and ductility, good corrosion and oxidization resistance in comparison with TWIP or TRIP steels. However, the formation of lamellar κ-carbide ((Fe,Mn)3AlC) in these lightweight steels causes catastrophic cracking during cold
forming. High power EPT (electric current density is around 1.92×10⁹ A/m2) has been
used here to (i) transform the lamellar κ-carbide to nano-sized spherical particles (about 110 µs) and (ii) refine the microstructure of ferrite matrix. This inhibits cracking during cold forming.
Dual-phase steels (DP600)
The dual-phase steel becomes soft during isothermal tempering of martensite. Recently, non-isothermal tempering has been implemented to decrease the softening process in dual-phase steels. The use of a high power EPT has been found to be able to enhance the strengthening effects via the formation of ultrafine-grained ferrite with nano-cementite particles in tempered martensitic-ferritic steels. To the best of my knowledge, EPT is the first candidate to provide a better solution for the softening problems encountered in the tempering of martensite than that achieved with isothermal and non-isothermal tempering.
In summary, EPT has been designed to control precipitation behaviour, phase transformation, formability and strengthening of steels. The fundamental understanding of the effect of EPT on the phase stability has been studied from kinetic and thermodynamic grounds. The application of EPT to the control of steel microstructure and properties has been outlined and discussed in this thesis.
40
Chapter 2
Assessment of the literature
The microstructure evolutions in precipitation and phase transformation, their effects on the steels properties, and the various approaches used in modifying the steels microstructures and the associated properties are introduced in Section 2.1. Section 2.2 introduces the backgrounds and applications of EPT on polycrystalline metals and alloys.
2.1 Microstructure and properties of steels 2.1.1 Precipitation
The generic precipitation behaviour in steels has been described well in textbooks [1]. This section focuses on the review of the microstructure evolutions during precipitation that affect the properties of steels.
Most of the bulk polycrystalline steels possess precipitates in their matrix after heat treatments. The precipitation temperature and the size, morphologies and crystallographic structure of precipitates are dependent on the composition of alloying elements [1]. The alloying elements such as C, Cr, Ni, Mo, V, W and Ti are frequently added into the steels to form various precipitates in order to modify the physical, chemical and mechanical properties of the steels [1]. In metallurgical fields, precipitates are generally referred as secondary phases or intermetallic compounds which have relative high thermal stability at high temperatures. For steels consist of different compositions of alloying elements, the precipitation mechanisms are described roughly as three routes with continuous increase of temperature and time [1]:
41
(1) The in-situ nucleation of precipitates [1]:
In the first route, the precipitates instantaneously nucleate on the interfaces between the cementite and ferrite phases. With continuous coarsening of the precipitates, the adjacent cementite provides more carbon to diffuse into these precipitates.
(2) The separation of nucleation of precipitates [1]:
With further increasing temperature and time, a huge amount of fine precipitates starts to nucleate at pre-existing, high density, dislocation regions in the steel matrix.
(3) The nucleation of precipitates at different types of grain boundaries [1]:
Precipitates eventually nucleate and coarsen at various types of specific areas such as the prior austenite grain boundaries, former martensitic lath boundaries and the new ferrite boundaries.
In addition, adding various types of alloying elements can effectively change the precipitation process. For example, adding Cr leads to a Cr carbides precipitation process to take place in the steel matrix under heat treatment. This is because Cr is a strong carbide former, which reacts with carbon to generate Cr carbides (e.g. Cr23C6). A typical precipitation sequence of
Cr carbides is as following [1]: 6 23 3 17 3
)
(
FeCr
C
Cr
C
Cr
C
Matrix
(2.1)When 4-6 wt.% Mo is added to the steel, the carbides precipitation sequence is expressed in Equation 2.2 [1].
C
M
C
M
C
Fe
3
2
6 (2.2)42
2.1.1.1 Precipitation and mechanical properties
Steels strengthening can be achieved by a number of mechanisms. Precipitation is one of them. In comparison with other strengthening methods such as solid-state phase transformation and microstructure refinement, the formation of precipitation can be controlled by adding various types of metallic alloying elements. Cementite (Fe3C) as one
typical example of precipitates is found frequently in steel matrix containing relatively high carbon concentration [1]. The morphologies of these precipitates are varied from lamellar structure to spherical particles depending on the heat treatments. Using an alternative heat treatments, the dispersion strengthening of precipitates can be optimized by a relation between the size of precipitates and mechanical properties (i.e. yield stress) [1]:
2
/
0
s
b
T
(2.3)where
s is the yield strength,
0 the yield stress,T
a dislocation's line tension, b theburger vector and the interparticle spacing. The presence of a directional relationship between spacing of precipitate and yield stress of steel apparently indicates the strengthening effect can be maximized by a significant reduction of precipitate spacing. In order to further accurately model the strengthening effect of precipitates (taking into account the size of precipitate), an empirical equation is expressed in Equation 2.4 [1]:
)
2
/
)
2
(
1
)(
2
2
ln(
4
0 sG
r
b
r
r
(2.4)43
where
is the constant,G
a shear modulus andr
the size of precipitate. A remarkable example of strengthening effect generated by the precipitation of lamellar cementite within ferrite matrix mathematically depicts a relationship between flow stress and mean uninterrupted free ferrite path (MFFP) in a carbon steel, as schematically illustrated in Figure 2.1 [4].Figure 2.1: Schematic illustration of a linear relationship between flow stress and MFFP for a carbon steel [4].
In addition, the occurrence of various volume fraction and morphology of precipitates in steel matrix can, by increasing ductility, benefit carbon steels which have high formability during
44
manufacturing process. For example, a low volume fraction of spherical cementite particle with high strength in carbon steel possesses relatively low potential to initiate crack forming and decohesion even at small strain in comparison with that of lamellar cementite [5]. This indicates that steels with a small amount of precipitates can sustain significant deformation before initiation and propagation of voids. Simultaneously, spherical precipitates have higher capability to withdraw substantial deformation reduction than that lamellar precipitates. Figure 2.2 depicts a standard true strain to fracture and volume of precipitates curve for a carbon steel [5].
Figure 2.2: The influence of secondary phases with different morphologies (spherical, pearlitic and elongated carbides) on the ductility of steel [5].
45
From Figure 2.2, it is obviously seen that the required strain to fracture is inversely proportional to the volume fraction of spheroidal carbides. This hints that the formability of steels can be maximized by keeping the volume fraction of precipitates at a relatively low level and controlling the morphology of precipitates as spherical particle.
2.1.1.2 Precipitation and chemical properties
Figure 2.3: Schematic diagram of general corrosion process for steels under high-concentration chloride environments.
Although the dispersion of precipitates in steel matrix benefits the mechanical properties such as strength and ductility, it still causes other detrimental effects in steel applications. For instance, a typical stainless steel with high concentration of alloying elements (e.g. Cr, Ni and Mo) is widely applied in many fields of automotive, subsea pipeline, medicine, food industry and nuclear power plants due to its extraordinary corrosion and oxidization resistance [1,
6-46
17]. This is mainly attributed to the high concentration of alloying elements such as Cr. The addition of Cr in stainless steels can generate a passive layer (Cr oxides, Cr2O3) that
efficiently covers the whole surface area of stainless steel to avoid corrosion attacking. However, this passive layer used to protect corrosion attacking can become invalid due to the segregation of alloying elements to form precipitates at some specific positions (e.g. grain boundary) under heat treatments. A standard process of corrosion initiation is vividly described in Figure 2.3.
2.1.2 Solid-state phase transformation
Phase transformation is one of the major means of the optimizing the steel properties. Steel, as one of the oldest multiphase alloys contains hundreds of various types of phases depending on the various alloying element additions and heat treatments. Two of the most common phase transformations include reconstructive phase transformation and displace phase transformation, exist in solid steels.
For a reconstructive phase transformation, the lattice structure is completely rearranged by breaking most of the atomic bonds to form a new lattice structure. This rearrangement of atoms is mainly controlled by the diffusion of atoms within lattice structure. Normally, the atom diffusion rate is higher at high temperature than that at low temperature. For iron, the phase transformation from delta-ferrite, with a body-centred-cubic (BCC) structure, to austenite with a face-centred-cubic (FCC) structure, occurs at a temperature about 1394 °C [1]. The lattice structure of delta-ferrite is completely changed via atomic rearrangement. Followed by the further reduction in temperature to about 912 °C, the austenite starts losing its stability and the phase transformation from austenite (FCC) to alpha-ferrite (BCC) is activated. During this phase transformation, the volume is increased by 0.21 cm3/mol because
47
the FCC structure is more compacted than the BCC structure [1]. Figure 2.4a and b present the crystallographic structures of FCC and BCC, respectively.
Figure 2.4: Schematic diagrams of molecular structure of (a) austenite (FCC) and (b) ferrite (BCC) [18].
Besides heat treatments, control of alloying elements such as carbon in steels can effectively control the phase transformation (e.g. an appropriate carbon composition in steel can have eutectoid phase transformation to generate a mixture of ferrite and cementite phases, called pearlite, from original austenite phase). The formation of pearlite structure can significantly enhance the mechanical properties such as yield stress, tensile strength and wear ability of the steels [1, 19].
At low temperature, the atom mobility is retarded. This retardation of atom diffusion makes the reconstructive phase transformation impossible. The displacive transformation takes place
48
in this occasion [1]. Instead of atom diffusion, a plastic transformation is involved to generate the new structure from the original structure.
Martensitic transformation as a typical displacive transformation has been investigated in steels [1]. The volume of a crystal is expanded by a transformation from FCC to BCC structures due to the density change. This causes the generation of internal stress inside the crystal [20]. The internal stress in the crystal is unable to be released at the low temperature. Instead of volume expansion, the shearing of crystal in a specific direction can effectively release internal stress during displacive transformation. As a result, a martensite phase is produced without changing solute composition from the original austenite. Martensite phase is one of common phases which significantly enhance the strength property of steels [21-23].
2.1.3 Grain size effect
The modification of the average grain size is one of the effective methods to alter the mechanical properties of steels. For example, a grain refinement of polycrystalline ferrite phase can enhance the strength of ferritic steels. [1]. The Hall-Petch relationship is an empirical relation between grain size and yield stress, which was proposed by Hall and Petch for a pure iron and is expressed as following [24-25]
2 1 0 Kyd y (2.5)
where
y is yield stress,d
is the grain size,
0 are friction stress constants for yield andhardness measurements, Ky is a coefficient. The grain size effect on strength can be roughly
referred to as dislocation movements and accumulations around grain boundaries in the materials. A fine grain size will result in an improvement of strength in comparison with a
49
coarse grain size. A schematic diagram of movements and accumulations of dislocations within fine and coarse grains are plotted in Figure 2.5a and b, respectively [1].
Figure 2.5: Schematic diagram of dislocation pile-up in (a) fine grain and (b) coarse grain.
The Hall-Petch relationship has been applied in many polycrystalline metals and alloys. Mild steel, for example, has shown the applicability of the relationship. A diagram describing the relation between yield stress and grain size for a mild steel is plotted in Figure 2.6 [26].
50
Figure 2.6: The relationship between yield stress and grain size of mild steel at 18 ºC [26].
Besides the strengthening effect, the grain size can also influence the ductility of materials. A significant reduction in ductility appears as the grain size is continuously decreased. There are two typical examples (1100-Al and interstitial free steel) depicting the relations between ductility (true strain) and grain size, as shown in Figure 2.7 [27].
51
Figure 2.7: The relations between true strain to fracture and grain size for 1100-Al and interstitial free steel [27].
Steels with nanoscale grain size have attracted significant attention. Nano-crystals have large interface areas to act as an effective barrier, to block the dislocation motion, and hence to increase the yield stress. However, the nanoscale grain refinement can also cause a completely opposite phenomenon on strengthening when the grain size is less than about 20 nm [1]. This opposite phenomenon leads to the failure of Hall-Petch relationship due to grain boundary sliding. This is because the grain boundary sliding will make it impossible accumulate of dislocations during deformation [1]. In order to overcome these barriers
52
induced by nano-crystallization (e.g. failure of Hall-Petch relationship), a suitable strategy to improve the strength and ductility of materials simultaneously is urgently required. The fabrication of nano-twinning may be one of potential methods which can reach the requirement. Nano-twinning (smallest feature size is less than 100 nm) as a coherent grain boundary with a high degree of symmetry, one side of which contains arrangement of atoms that are mirror reflections of those on the other side, separated by the twin composition plane (shown in Figure 2.8) have ultrahigh coherency with surrounding matrix [28]. Thus, the nano-twinning has good thermal, electrical and mechanical stabilities [28].
Figure 2.8: Schematic drawings of nano-scale twinning with twin layer thickness (λ) and twin boundary spacing (∆), and a twin boundary structure [28].
A higher percentage of nano-twinning fabricated in materials leads to a better balance of mechanical properties [29–32]. This is mainly attributed to the specific properties of twinning grain boundary. In comparison with normal grain boundary within nanoscale grains, a nano-twinning boundary not only has greater strengthening effect as blocking the motion of sessile
53
dislocations, but also enhances significantly the ductility as promoting extra slip system for climbing and sliding of glissile dislocations. The effects of nano-twinning on dislocation motion are described in Figure 2.9 comprehensively [28, 31].
Figure 2.9: Schematic showing of the dislocation motions in stage (1), stage (2) and stage (3) [28, 31].
In stage 1, if no twin boundary exists in the microstructure, the dislocation can move directly from left matrix to right matrix without changing of its direction. In stage 2, the strengthening effect can be initiated by the dissociation of Shockley partials when the dislocation slips across the twin boundary. This is because the Shockley partials can transmit though the twin
54
boundary into adjoining twins accompanied by the emission of a stacking fault ribbon or sessile locks at the twin boundary. Oppositely, softening effect can be generated by the emission of additional Shockley partials slip along twin boundary in the stage 3.
Fabrication of large amount of nanoscale twins during manufacturing of materials has attracted significant interests in recent years. Three methods, i.e. pulsed electrodeposition, sputter deposition and dynamic plastic deformation (DPD), have been utilized to achieve the goal for polycrystalline metals and alloys [28]. For example, the pulsed electrodeposition is used to generate nanoscale twinning in thin foil, where the twin layer thickness (about 100 nm) can be efficiently controlled by alternating the current density, deposition temperature and the ratio of on time/off time. Similarly, appropriate use of sputter deposition can also fabricate nanoscale twinning in thin foil. In comparison with the former two methods, DPD as one of thermo-mechanical processes reliably manufactures bulk materials with high density of nanoscale twinning. This is predominantly attributed to the competing mechanism (dislocation slip and deformation twinning) during plastic deformation. For a polycrystalline materials treated at cryogenic temperature and high strain rate, the twinning process will be dominant rather than dislocation slip. As a consequence, a high density nanoscale twinning is formed in bulk materials under DPD.
2.2 Effects of electropulsing on microstructure evolutions and properties
In this section, the background of EPT and its applications to optimize the microstructures and properties of polycrystalline metals and alloys are introduced. Figure 2.10 demonstrates the effect. It illustrates seven fundamental microstructure evolutions, precipitation [33–48], phase transformation [49–67], grain size [68–133], grain orientation [72, 79, 101, 102, 112, 134–148], motion of electrically non-metallic particles [72, 142, 144, 145, 149, 150],
55
dislocation [38, 45–47, 52–56, 61, 63–67, 73, 79–81, 86–88, 92, 93, 95, 98, 102, 105, 113, 116–125, 128, 129, 151–156] and cracking healing [151–161] are affected significantly by the application of EPT to materials for various conditions. Due to the specific properties of EPT (e.g. instantaneous method, high energy input and no production of pollutants), it has been widely used in many types of alloys such as steels, Ti alloys, Al alloys, Mg alloys, Ni alloys, Cu alloys, amorphous alloys, tungsten alloys, Zn-Al alloys, Ni-Ti alloys, metallic glass and thin films. EPT can effectively change their microstructures and corresponding properties with high work efficiency, low energy consumption and less impact on environments in comparison with other conventional methods [33–162]. The experimental observations, kinetic and thermodynamic understanding of EPT on the optimization of microstructures and properties for polycrystalline metals and alloys are summarized in this section.
56
Figure. 2.10: The effect of EPT on microstructure and properties of polycrystalline metals and alloys.
2.2.1 Precipitation
As previously mentioned in Section 2.1, precipitation can take place in polycrystalline metals and alloys during various heat treatments. Once precipitates nucleate within a materials matrix, the alloying elements will start to segregate. The segregation of alloying elements can significantly influence the properties of polycrystalline metals and alloys. Precipitates in metals and alloys are known for their beneficial or/detrimental roles during processing depending on their types, morphologies, size and density. In order to attain a good understanding about how the properties can be optimized by effective controlling of precipitates parameters, several metals and alloys including Al alloys, Mg alloys and steels are selected as model materials, which are treated by EPT at different process conditions. The change of microstructure evolutions and properties induced by precipitation via EPT are presented. Thereby the relationship between precipitation behaviours and EPT can be outlined and analysed definitely and thoughtfully, which may provide a promising direction for optimizing properties using precipitation under EPT and improving the reliability of materials.
In this section, a systemic introduction of the applications of EPT on precipitates in various metals and alloys is presented. This is to provide insight and understanding to the effects of electric current on precipitation behaviour.
57
2.2.1.1 EPT on precipitation behaviour
Since the first observation of abnormal precipitation under electric-current treatment in Al-3.98 wt% Cu alloy [37], many researchers have studied the phenomenon in Al alloys (2024 Al alloy [45], Al-3.3 wt% Mg alloy [44], Al-4 wt% Cu alloy [43], Al-5.6 wt% Zn alloy [42]), Mg alloys (Mg-3Al-1Zn alloy [38], Mg-6Al-1Zn alloy [33], Mg-9Al-1Zn alloy [34–36, 46, 47]) and steels (Low carbon steel and Fe-Mn-Si-Ni-Nb-C alloy [39–41, 48]). Once the electric-current treatments are applied to those alloys, the precipitation behaviour are significantly altered and the properties of the alloys are changed. Table 2.1 summarized the results reported in literature.
Table 2.1: Applications of electric-current treatments on precipitations in alloys.
Materials Treatments Precipitations Observations
Al-3.98 wt% Cu alloy d.c. current GP zones Promoted [37]
2024 Al alloy EPT T-phase Promoted [45]
Low carbon Nb steel EPT NbCN Promoted [48]
Fe-Mn-Si-Ni-Nb-C alloy EPT NbC Promoted [39–41]
Al-3.3 wt% Mg alloy d.c. current GP zones Retarded [44]
Al-4 wt% Cu alloy d.c. current GP zones Retarded [43]
Al-5.6 wt% Zn alloy a.c. current GP zones Retarded [42]
Mg-3Al-1Zn alloy EPT β-Mg17Al12 Retarded [38]
Mg-6Al-1Zn alloy EPT β-Mg17Al12 Retarded [33]
![Figure 2.2 depicts a standard true strain to fracture and volume of precipitates curve for a carbon steel [5]](https://thumb-us.123doks.com/thumbv2/123dok_us/1403346.2687865/44.892.181.712.512.917/figure-depicts-standard-strain-fracture-volume-precipitates-carbon.webp)
![Figure 2.6: The relationship between yield stress and grain size of mild steel at 18 ºC [26]](https://thumb-us.123doks.com/thumbv2/123dok_us/1403346.2687865/50.892.192.698.105.716/figure-relationship-yield-stress-grain-size-mild-steel.webp)
![Figure 2.7: The relations between true strain to fracture and grain size for 1100-Al and interstitial free steel [27]](https://thumb-us.123doks.com/thumbv2/123dok_us/1403346.2687865/51.892.124.766.117.661/figure-relations-true-strain-fracture-grain-interstitial-steel.webp)