Scaling
XenDesktop 7
to 5,000 users
with VMware
vSphere 5.1 (ESXi)
Citrix Solutions Lab Validated
Solutions Design Guide
Table of contents
Contents Citrix XenDesktop 7 6 Executive Summary 7 Project overview 7 Project goals 7 Conclusions 8Abbreviations and naming conventions 9
Hardware and software used 10
Software 10 Hardware 10
Solutions architecture 11
Users and locations 11
Main office (4,020 users) 11
Large branch office (600 users) 11
Small branch office (120 users) 11
Remote access (840 users) 11
User split 12
Desktop split 12
Storage infrastructure 12
Storage architecture design 13
Storage deployment 13
Network infrastructure 14
Network design 14
Datacenter and remote office LAN network architecture overview 15
WAN network architecture overview 15
Common infrastructure 16
Active Directory 16
Client infrastructure 17
VDI infrastructure modular design 17
Infrastructure deployment methodology 17
Modular block overview 17
Modular block sizing 18
Modular block infrastructure 19
Virtual desktop infrastructure virtualization 19
vCenter for VDI infrastructure and desktop hypervisor hosts 20
vCenter SQL 20
VDI infrastructure hypervisors 21
VDI Infrastructure VMs 21
Citrix XenDesktop Site structure 21
Citrix Infrastructure SQL 23
Web Portal – StoreFront 24
Profile management 24
Desktop virtualization 24
VDI desktops 25
PVS for VDI desktops 26
Hosted shared desktops 26
PVS for hosted shared desktops 26
Notes 26
VAMT for desktops 26
Test methodology 27
Test overview 27
Success criteria 27
Test tools 27
Test orchestration and workload generation 27
Performance data capture 28
In-session workload simulation 28
Conclusions 29
Notes and lessons learned 30
Appendix A: System inventory 32
Physical systems 32
Network appliances 33
Datacenter 33
Large branch office 33
Small branch office 33
Virtualized systems 34
XenDesktop infrastructure 34
Virtual desktops 35
Appendix B: Performance results 37
Storage performance 37
ESXi Server CPU performance 38
XenDesktop infrastructure VM performance 40
Boot storms 40
Memory 42 Networking 42
Steady state test 42
Logon phase 42
Steady state test 44
Memory 46 Networking 46
More and more enterprises are turning to desktop
virtualization as a solution to rising IT costs, security
concerns, and the user demands of BYOD and work
from anywhere, at any time, from any device. But can
a desktop virtualization solution support thousands
of users, both local and remote? How well does a
virtual desktop solution scale?
This document discusses the environment created in the Citrix Solutions Lab to successfully deploy and support 5000 virtual desktop users in a multi- branch environment.
The Solutions Lab was formed to design, architect, and test deployments of large scale Citrix virtualization solutions from end-point device to the datacenter, including multi-branch remote locations.
This document provides information about:
• The Design – How Citrix products and valued Citrix partner hardware were architected and configured to build a 5000 user, multi-branch solution
• The Conclusions – Based on test results, the conclusions the Solutions Lab team were able to draw and the lessons they learned
This document describes virtualization technology design and concepts. It covers the overall methodology for configuring and testing a real-world desktop virtualization environment to support a large number of users. This document does not provide step by step or detailed configuration instructions, but will define the architecture used in testing.
This document is intended for the IT professional with relevant experience in virtualization technologies, and provides guidance when designing large scale virtual desktop environments. In addition, IT and other business executives will gain a better understanding of what’s needed to deliver virtual desktops and applications to their users.
Citrix XenDesktop 7
XenDesktop delivers Windows apps and desktops as secure mobile services from a cloud-ready platform while simplifying management, reducing costs and enhancing security.
XenDesktop 7 is a simple way to enable employees to work from any device. Delivering the best mobile experience, XenDesktop gives people the freedom to shift work to a more optimal place—on whatever device they choose, accessing both apps and desktops whenever and wherever, over any network connection. When IT can react more quickly to the changing needs of the business and deliver both virtual apps and desktops from a single platform, it becomes a valuable asset to the business rather than just a cost. With XenDesktop 7, the business can: • Deliver secure access to mission-critical business apps and data from
mobile devices
• Empower employees by providing 24x7 self-service access to the applications they need from a simple enterprise app storefront
• Quickly add new employees, open new offices, and start offshore operations by providing a full function corporate desktop to new users in a matter of minutes • Easily support teleworking mandates and green initiatives while reducing facility
and travel expenses
• Manage applications, desktops and data centrally, making it easier to protect sensitive resources and adhere to regulatory compliance standards
• Recruit top talent from anywhere by offering flexibility and work-life balance by supporting anywhere computing on a variety of devices
• Seamlessly ensure high availability and enhance performance through integrated networking and branch optimization solutions
• Control the ever-increasing costs of annual PC refresh cycles by centrally managing and delivering virtual apps and desktops to any device, including low-cost thin clients
XenDesktop 7 is at the center of a remarkable transformation giving IT the power to mobilize the workforce while realizing lower costs, greater business agility, and virtual apps and desktops for any type of user.
Citrix solutions combine virtualization, networking, and cloud computing technologies to deliver a full portfolio of offerings that enable virtual workstyles for users and virtual datacenters for IT while putting IT at the center of
this transformation.
Key benefits
• Mobilize Windows apps and desktops for any device • Reduce costs of desktop management • Secure remote access to business-critical data • Unified architecture simplifies deployment
Executive Summary
This document details the design, deployment, and validation of the new Citrix Desktop Virtualization architecture available in XenDesktop 7.
Project overview
XenDesktop 7 integrates Citrix XenApp and VDI technologies into a unified architecture, providing operational and management efficiencies in regards to the design and deployment of desktop virtualization.
This project consisted of designing, building, and testing a XenDesktop environment to show how 5000 users can access services across multiple geographic locations, utilizing HP BL460c Gen8 blade servers, an EMC VNX7500 storage array, and VMware vSphere 5.1 with Citrix XenDesktop 7, NetScaler, and Branch Repeater technologies.
Project goals
This Desktop Virtualization test environment was built with the following goals in mind:
• Validate XenDesktop 7 within a 5000 user environment by leveraging the capabilities of XenDesktop 7 to deploy desktops and applications to three types of users; local, remote office, and remote access
• Create a modular design allowing for linear scalability and growth maintaining a balance of desktop types; in the test environment, 64% hosted shared desktops, 18% random VDI desktops, and 18% static VDI desktops with Personal vDisk (PvD) to allow for user customization
• Design the environment to be highly available and resilient to failure, where possible, while maintaining business continuity
• Validate that XenDesktop 7 can support different types of users in different geographic locations, such as branch office workers and remote access users, with a single pane of glass, centrally managed from the datacenter from deployment to daily operations
• Validate that the test environment would stay within the following defined guidelines, while not encountering the maximum capacity of any individual component within that environment
– No server CPU utilization average to be over 85% while under load – Storage to perform within EMC guidelines of response times under
10 milliseconds per request
– 5000 users connect, complete a test run, and logoff cleanly
LoginVSI 3.7 was used as the load generation tool for all users to verify the solution For more information about Login VSI, see the Login VSI website
Conclusions
• Testing validated that XenDesktop 7 delivered a resilient solution on VMware vSphere 5.1 supporting 5,000+ concurrent users deployed over a multi-branch solutions environment.
• StoreFront 2.0 successfully scales using an N+1 model.
• Provisioning Services (PVS) 7.0 successfully supported the multiple Flexcast models provided with XenDesktop 7.
• All infrastructure servers in the environment were successfully virtualized. • The new consolidated XenDesktop 7 interface greatly simplified the deployment
and management of different Flexcast models.
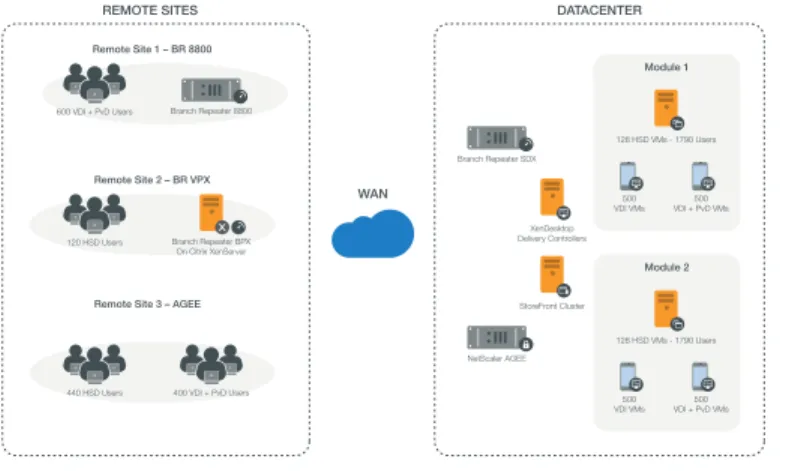
• Utilizing a modular design provides easy management and scalability. This white paper provides design considerations and guidelines for a mixed FlexCast model deployment. The diagram below provides a high level view of the environment tested.
Branch Repeater SDX
Remote Site 1 – BR 8800
REMOTE SITES DATACENTER
HEADQUARTERS SITE WAN 600 VDI + PvD Users 3020 HSD Users 1000 VDI Users Branch Repeater 8800 NetScaler AGEE XenDesktop Delivery Controllers Remote Site 2 – BR VPX 120 HSD Users StoreFront Cluster Branch Repeater BPX On Citrix XenServer
Remote Site 3 – AGEE
440 HSD Users 400 VDI + PvD Users
Module 1 Module 2 128 HSD VMs - 1790 Users 500 VDI VMs VDI + PvD VMs500 128 HSD VMs - 1790 Users 500 VDI VMs VDI + PvD VMs500
Abbreviations and naming conventions
The following abbreviations and naming conventions are used in this document.
AG Access Gateway
AGEE Access Gateway Enterprise Edition
BR Branch Repeater
CIFS Common Internet File System
DHCP Dynamic Host Configuration Protocol
DNS Domain Name System
HA High Availability
HDX High Definition eXperience
HSD Hosted Shared Desktop
IOPS Input/Output Operations Per Second
iSCSI Internet Small Computer System Interface
ISL Inter-Switch Link
NFS Network File System
NS NetScaler
NTP Network Time Protocol
PvD Personal vDisk
PVS Provisioning Services
RAID Redundant Array of Independent Disks
TCO Total Cost of Ownership
VDA Virtual Delivery Agent
VDI Virtual Desktop Infrastructure
vDisk Virtual Disk (Provisioning Services Streamed VM Image)
VLAN Virtual Local Area Network
VM Virtual Machine
VPX Virtual Appliance
WAN Wide Area Network
Hardware and software used
The following hardware and software was used in the test environment: Software
Component Version
Virtual Desktop Broker Citrix XenDesktop 7
VDI Desktop Provisioning Citrix Provisioning Services 7.0
Endpoint Client Citrix Receiver for Windows 4.0
User Profile Management Citrix User Profile Manager 5.0
VDI Personalization Citrix Personal vDisk 7.0
Web Portal Citrix StoreFront 2.0
Licensing Citrix License Server 11.11
Workload Generator Login VSI 3.7
Office Microsoft Office 2010 SP1
Virtual Desktop OS (VDI Desktops) Microsoft Windows 7 x64 SP1
Virtual Desktop OS (Hosted Shared Desktops)
Microsoft Windows Server 2012
Database Server Microsoft SQL Server 2012
VDI Hypervisor Management vCenter Server 5.1
VDI Hypervisor VMware vSphere 5.1 Enterprise Plus
Hardware
Component Version
Blade Servers • Infrastructure
• Virtual Desktop Hypervisors
HP ProLiant BL460c Gen8 HP ProLiant BL460c Gen8 Network Appliances
• WAN Optimization • Remote Access
Citrix Branch Repeater 8800, SDX, and VPX Citrix
NetScaler/Access Gateway Enterprise Edition Network Devices • Backbone Switch • Multi-layer Switches Cisco Nexus 7010K 8x32/10G HP H3C 5820, 580
Storage Systems EMC® VNX® 7500
Solutions architecture
The diagram below illustrates the architecture of the Citrix XenDesktop test environment. Each component deployed in the test environment is discussed in detail in this section.
Large Branch Office
Headquarters Datacenter
4020 Headquarters Users 600 Branch Users Active Directory
Branch Repeater 8800
Small Branch Office
120 Branch Users Active Directory Branch Repeater VPX
on Citrix XenServer
Remote Access Office
840 Remote Access Users
HP H3C 58xx
NetScaler AGEE
Branch Repeater SDX Active Directory
ESXi Provisioning Server 7.0
Desktop OS VDAs (Random VDI Desktops)(Static VDI DesktopsDesktop OS VDAs
with PvD)
Server OS VDAs (Hosted Shared Desktops)
XenDesktop 7
ESXi
Figure 2: XenDesktop 7 multi-site enterprise environment with 5K+ users
Users and locations
Main office (4,020 users)
The main office location required virtual desktop services with centralized system and desktop image management. Users within the main office comprised primarily task workers, provided with a mix of 3020 hosted shared desktops and 1000 random VDI desktops.
Large branch office (600 users)
Users in the large branch office location needed secure and accelerated remote access to the datacenter-based virtual desktops. These users comprised primarily engineering staff, provided with static VDI desktops (with PvD).
Small branch office (120 users)
Users in the small branch office location also needed secure and accelerated remote access to datacenter-based virtual desktops. These users comprised primarily sales and administration staff, provided with hosted shared desktops.
Remote access (840 users)
Access Gateway was chosen to provide secure, remote access to remote users. These users comprised a mix of staff, provided with a mix of 400 hosted shared desktops and 440 static VDI desktops (with PvD).
User split
Site Number of users Percentage of users
Main office 4020 72%
Remote 1560 28%
Desktop split
Model Number of desktops Percentage of desktops
Hosted shared desktop 3580 64%
Random VDI desktop 1000 18%
Static VDI desktop (with PvD)
1000 18%
The desktop type split was designed based on customer input. A large majority of customers deploy a significant amount of hosted shared desktops to users, because their needs are relatively simple. More complex task workers get a random VDI desktop instead of a hosted shared desktop. High-level workers who require the ability to personalize their desktops are provided with static VDI desktops (with PvD) to allow for that personalization. Rather than working with dedicated desktops, the static VDI desktop (with PvD) construct solves the personalization requirement whilst still providing a lower TCO.
Storage infrastructure
The EMC VNX family delivers industry leading innovation and enterprise
capabilities for file, block, and object storage in a scalable, easy-to-use solution. This next-generation storage platform combines powerful and flexible hardware with advanced efficiency, management, and protection software to meet the demanding needs of today’s enterprises.
All of this is available in a choice of systems ranging from affordable entry-level solutions to high performance, petabyte-capacity configurations servicing the most demanding application requirements. The VNX family includes the VNXe series, purpose-built for the IT generalist in smaller environments, and the VNX series, designed to meet the high-performance, high scalability, requirements of midsize and large enterprises.
The EMC VNX 7500 unified storage platform is at the top of the line of the VNX series. It is powered by Intel quad-core Xeon 5600 series processors and delivers five 9’s of availability. It is designed to deliver maximum performance and scalability for enterprises, enabling them to dramatically grow, share, and cost-effectively manage multi-protocol file and block systems. It supports up to 1000 drives and eight X-Blades (also known as Data Movers) for file protocol support.
A single EMC VNX 7500 appliance was utilized to provide storage for the test environment. The solution was validated using NFS for data storage of virtual desktops, SQL databases, and infrastructure virtual machines such as delivery
controllers, vCenter Servers, and other supporting services. CIFS was configured for profile management and for PVS vDisks.
Storage architecture design
In a large scale PVS deployment, the option typically chosen for the PVS write cache destination is “Cache on device hard drive” to achieve higher scalability and allow ease of manageability and agility.
In a virtualized environment, this cache area resides in the virtual hard disks attached to the virtual machines, and is IO intensive because, while the PVS servers absorb most of the read IOPS for the virtual desktops, all writes are redirected to the write cache area.
As the write cache area is write intensive by nature, Citrix recommends designating RAID 10 storage pools on the VNX for PVS write cache to minimize the RAID penalty incurred by RAID 5 or other similar RAID types. Because EMC VNX arrays support RAID 10 pools with multiples of eight drives, Citrix recommends using that drive count unit as the building block while the number of deployed desktops continues to scale.
In the test environment, the storage pools used to store PVS write cache for both hosted shared desktops and VDI desktops were made up of 64 and 24 SAS 15K drives respectively.
Storage deployment
Four data movers (storage filer heads) in a single EMC VNX 7500 were utilized, with two assigned to support virtual desktops, one assigned to infrastructure, and one configured for failover.
The following table defines the number of drives associated with each storage pool, the protocol used in accessing the pool, the RAID configuration, and whether
or not EMC VNX 7500 FAST™ Cache was used in accessing the pool. EMC FAST
Cache is a storage performance optimization feature that provides immediate access to frequently accessed data.
For more information see the EMC website.
Drive count
Drive
type Protocol RAID
FAST Cache Infrastructure VMs 10 SAS NFS 5 N SQL database/quorum 5 SAS NFS 5 N HSD/VDI desktop vDisk 5 SAS CIFS 5 Y
HSD Write Cache 64 SAS NFS 10 Y
Random VDI desktop Write Cache
24 SAS NFS 10 Y
Static VDI desktop Write Cache
Drive count
Drive
type Protocol RAID
FAST Cache
PvD 20 SAS NFS 5 Y
User Profiles 15 SAS CIFS 5 N
VNX system drives 4 SAS N/A 5 N/A
FAST Cache drives 10 SSD N/A 1 N/A
Hot spares 6 SAS N/A N/A N/A
Hot spare 1 SSD N/A N/A N/A
SAS used 171
The FAST Cache SSD drives were 200GB in size. Using EMC best practices, a maximum of 250 VMs was used for each NFS datastore in VSphere. Network infrastructure
The next consideration for this environment was the network architecture and design. The network architecture for the test environment included, but was not limited to, the creation of IP address requirements, VLAN configurations, required IP services, and server network configurations. Considerations regarding IP allocation, IP block assignment, and WAN Routing were extremely important in ensuring that the design maintained its modularity.
Large Branch Office
Headquarters Datacenter
4020 Headquarters Users 600 Branch Users
Branch Repeater 8800
Small Branch Office
120 Branch Users
Branch Repeater VPX on Citrix XenServer
Remote Access Office
840 Remote Access Users
HP H3C 58xx
NetScaler AGEE Branch Repeater SDX
Figure 3: Network diagram for XenDesktop 7 multi-site enterprise environment with 5K+ users
Network design
When planning the network environment, it was important to determine how many nodes would be needed at the beginning of the project and how many would need to be added throughout the lifetime of the project. Once known, planning of the IP address blocks could begin.
It is desirable to employ a modular approach to network VLAN design. Traffic separation is efficient for VDI IP considerations and alleviating bandwidth traffic concerns. If possible, create a separate VLAN for certain types of traffic. For example, a Storage VLAN for storage traffic (that is iSCSI, NFS, or CIFS), DMZ’s for certain external incoming traffic types, a server management VLAN (which may include Lights-Out capabilities and log gathering mechanisms), and Guest VLANs for virtual desktops. This type of design approach keeps layer 2 broadcasts to a minimum while not over-utilizing the CPU and memory resources of network devices.
Design considerations
As a design consideration, the chunks of desktop growth have an impact on how a network is designed. A /24 network allows for growth in chunks of 200 VDI desktops, while a /23 network allows for growth in chunks of 500 desktops. By planning the network design with growth and a buffer considered, blocks can be aggregated in chunks of /24’s, /23’s, and /22’s (1024 hosts) as needed.
Datacenter and remote office LAN network architecture overview
The Cisco Systems Nexus 7010K Core Switch with eight cards and 32 10GbE ports provided the datacenter multilayer switching and routing services. This switch also provided all routing, switching, and security services for the rest of the environment. H3C/HP 5820 10GbE switches served other 10GbE service ports. Also, 1GbE ports were served by H3C/HP 5801 1GbE switches with 10GbE uplinks.
For branch office sites, workgroup switching and routing were required. The 1GbE ports required were provided by H3C/HP 5801 1GbE switches, which incorporated 10GbE uplinks to the core infrastructure. No latencies were introduced to the LAN configuration.
WAN network architecture overview
The planning for the multisite WAN test environment included planning for VLAN and other network-based services, supporting both virtualized and physical systems, and providing for WAN, DMZ, and firewall connectivity. Planning also included placing network service appliances, such as Branch Repeater and NetScaler systems, in correct, logical network locations.
The test environment WAN routing at the datacenter was provided by a single Cisco core switch, as mentioned above. To meet the requirement for providing appliance-to-appliance ICA optimization for the XenDesktop virtual desktops access in the environment, BR-SDX appliances were deployed in a HA
configuration at the datacenter. Standalone BR appliances (8800-series and virtual appliances) were deployed at each of the branch office locations. Branch site Layer-3 routing and edge services were provided by H3C 58XX Series multi-layer switch router devices.
A Branch Repeater 8800-series appliance was selected for the large branch office (600 users) and a Branch Repeater virtual appliance (VPX) for the small branch office (120 users). A Branch Repeater SDX appliance Model 13505 was used to allow for a single connection point for remote Branch Repeater connections at the datacenter.
For remote access users, ICA Proxy and VPN services were required. To meet this requirement, a NetScaler appliance with an Access Gateway Enterprise Edition license was deployed in the datacenter. LACP 802.3AD was used for all ISL’s between all devices.
Design considerations
Each network appliance is limited by the number of connections that they can support; most network appliances list the maximum number of TCP connections that they support. In the Citrix VDI environment, the ICA connection capacity of the Remote Access and WAN Acceleration devices needs to be considered. It is necessary to match this capacity with the site user requirements, while including a buffer for future site growth.
• To optimize storage communications in the environment, Citrix recommends using a dedicated VLAN for server to storage connections.
• Consider separating heavy network traffic in a dedicated VLAN so that it does not interfere with other traffic.
• Uplinks between all network switches at Layer 2 should employ 802.3ad LACP Ethernet aggregation for increased throughput and resiliency.
• To determine the overall bandwidth needed, it is necessary to know the
bandwidth required per session. The number of possible remote site sessions is directly proportional to the bandwidth.
Common infrastructure
The common infrastructure components, those normally already in place in a datacenter environment (including, but not limited to Active Directory, DNS, DHCP, and NTP), were hosted on VMs outside of the XenDesktop environment deployed for this test.
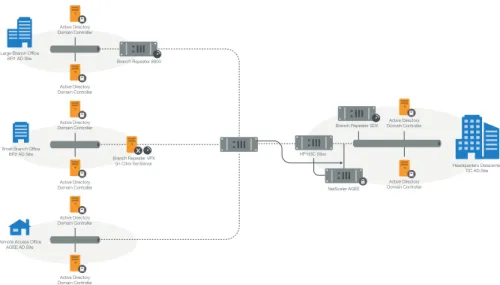
Active Directory
A Windows 2008 R2 four-site Active Directory with a Single Forest, Single Domain structure was deployed. Two Domain Controllers were deployed in each site for redundancy and each site hosted its own AD-integrated DNS and DHCP.
Active Directory Domain Controller Active Directory Domain Controller Active Directory Domain Controller Active Directory Domain Controller Large Branch Office
BR1 AD Site Headquarters Datacenter DC AD Site Active Directory Domain Controller Active Directory Domain Controller Branch Repeater 8800
Small Branch Office BR2 AD Site
Branch Repeater VPX on Citrix XenServer
Remote Access Office AGEE AD Site Branch Repeater SDX Active Directory Domain Controller Active Directory Domain Controller HP H3C 58xx NetScaler AGEE
Figure 4: Active Directory multi-site structure
Client infrastructure
A significant LoginVSI client environment was required for the test environments large-scale deployment. Almost 300 VSI client launchers were deployed for over 5000 independent ICA sessions. All client launcher systems were virtualized in a completely separate XenServer environment.
VDI infrastructure modular design
With the common infrastructure in place, the next step was to design, create, and configure the infrastructure that would support the first modular block. After that first block of users was built and tested an additional modular block was deployed. This section outlines the modular VDI infrastructure that was used along with the modular block sizing and configuration of the VSphere environment, vCenter, PVS, and SQL Server.
Infrastructure deployment methodology
Similar to the common infrastructure deployment methodology, the modular infrastructure utilized HP Insight Control for the deployment of the operating system. The VDI infrastructure was hosted on HP BL460c Gen8 blade servers.
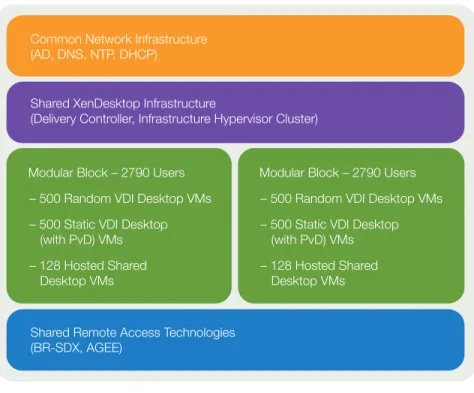
Modular block overview
One modular block (c-Block) contained one cluster for each desktop type (random VDI, static VDI (with PvD), and hosted shared) and the supporting infrastructure for them.
Common Network Infrastructure (AD, DNS, NTP, DHCP)
Shared Remote Access Technologies (BR-SDX, AGEE)
Shared XenDesktop Infrastructure
(Delivery Controller, Infrastructure Hypervisor Cluster)
Modular Block – 2790 Users – 500 Random VDI Desktop VMs – 500 Static VDI Desktop
(with PvD) VMs – 128 Hosted Shared
Desktop VMs
Modular Block – 2790 Users – 500 Random VDI Desktop VMs – 500 Static VDI Desktop
(with PvD) VMs – 128 Hosted Shared
Desktop VMs
Figure 5: Modular block diagram
Modular block sizing
When scaling up a VDI environment from a single server to a modular block, it is important to understand the hardware along with its capacity and performance capabilities and limitations. This is important not only for each component, but also for the entire system working together. Finding the optimal design involves multiple cycles of testing, troubleshooting, and resolution of issues. This leads to a design where every component within the system has the ability to handle the expected load easily.
In the test environment, the first step in this process was to determine single-server VM density. Based on this information, density numbers for a single cluster of users was calculated. Because there were three different FlexCast models in the test environment, three cluster sizes were defined as follows:
• For random VDI desktops, a single cluster consisted of six servers
• For static VDI desktops (with PvD), a single cluster also consisted of six servers, but the density was reduced slightly in order to provide a level of resiliency for the PvD infrastructure
Following on from those calculations, the three different clusters were combined to build a “modular block” (or c-Block) of users. In the test environment, each block was built to support 2790 users. Two of these blocks were combined to build the entire environment.
With static VDI desktops (with PvD), there is sometimes a concern over availability. In other environments, if a server running a desktop with PvD fails, the process of connecting an existing PvD to a new desktop can be time-consuming, unless there is some level of resiliency allowing that desktop to boot on a different server. To alleviate that concern in the test environment, the static VDI desktop (with PvD) clusters were configured for high availability. In the six-node clusters, only five Hosts were deployed, leaving one Host for failover. Load balancing across the cluster, however, resulted in all six Hosts running at approximately 60-70% of maximum capacity to accommodate a Host failure. This resulted in the servers running at approximately 85% of maximum capacity after a single Host failure (maintaining performance at the desired level) and at approximately 100% of capacity after a double Host failure.
Each cluster was hardware specific and each module included one cluster per desktop type, as follows:
• 16-blade cluster for Windows 2012 hosted shared desktops • 6-blade cluster for Windows 7 random VDI desktops
• 6-blade resilient cluster for Windows 7 static VDI desktops (with PvD)
Modular block infrastructure
The environment was built with two modular blocks, resulting in approximately 5500 net users.
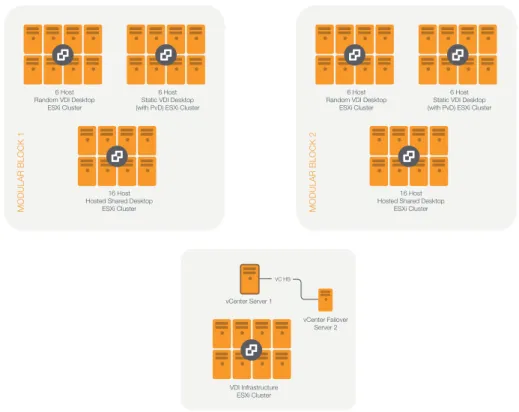
Virtual desktop infrastructure virtualization
6 Host Random VDI Desktop
ESXi Cluster
16 Host Hosted Shared Desktop
ESXi Cluster
MODULAR BLOCK 1
6 Host Static VDI Desktop (with PvD) ESXi Cluster
6 Host Random VDI Desktop
ESXi Cluster
16 Host Hosted Shared Desktop
ESXi Cluster
MODULAR BLOCK 2
6 Host Static VDI Desktop (with PvD) ESXi Cluster
vCenter Server 1 vCenter Failover Server 2 VC HB VDI Infrastructure ESXi Cluster
Figure 6: vCenter Server and ESXi Clusters management structure
vCenter for VDI infrastructure and desktop hypervisor hosts
The ESXi 5.1 hypervisor hosts in the test environment were managed by vCenter Server 5.1, configured as follows:
• vCenter Server was configured with High Availability protection provided by vCenter Server Heartbeat 6.5.
• The primary and secondary vCenter Servers were virtualized on separate ESXi hosts.
vCenter SQL
A SQL backend database was required for vCenter. A set of virtual SQL servers was utilized in the test environment, configured as follows:
• SQL servers ran on Windows 2008 R2 ESXi VMs.
• SQL Server 2008 R2 Database Mirroring was configured using three servers: – Principal, mirror, and witness
• EMC VNX 7500 NFS VMDK’s were used for database storage: – 100GB attached to both principal and mirror SQL server VMs
Note: To use Windows Server Failover Clustering with SQL Server would have required Block storage (Fibre Channel or iSCSI). In the test environment, only NFS storage was available and clustering was not utilized.
VDI infrastructure hypervisors
Infrastructure components, including Delivery Controllers and Provisioning Servers, were deployed on HP BL460c Gen8 blade servers running ESXi 5.1 in an 8-node ESXi cluster, configured as follows:
• VMWare Standard Virtual Switch (vSwitch) • Managed by the primary vCenter Server
• Shared Storage for infrastructure VMs hosted as an NFS datastore on EMC VNX 7500
VDI Infrastructure VMs
The VDI Infrastructure VMs were configured as follows: • Windows 2008 R2 SP1 was installed
• Given a static IP address and static DNS entry in the AD-integrated DNS RDS Licenses for Windows 2008 R2 (Infrastructure VMs) and Windows Server 2012 (hosted shared desktop VMs) were provided by a standalone Windows Server 2012 VM configured with the RD Licensing role. This VM was set up expressly to provide RDS licenses.
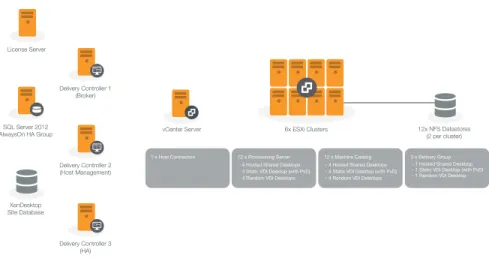
Citrix XenDesktop Site structure
The XenDesktop Site in the test environment was configured as a single XenDesktop 7 Site containing the following components:
• Three Delivery Controller VMs running on ESXi for HA (2 +1)
• The XenDesktop Site Database running as a SQL Server 2012 AlwaysOn High Availability Group
License Server
Delivery Controller 1 (Broker)
vCenter Server 6x ESXi Clusters Delivery Controller 2 (Host Management) Delivery Controller 3 (HA) SQL Server 2012 AlwaysOn HA Group XenDesktop Site Database 12x NFS Datastores (2 per cluster)
1 x Host Connection 12 x Provisioning Server - 4 Hosted Shared Desktops - 4 Static VDI Desktop (with PvD) - 4 Random VDI Desktops
12 x Machine Catalog - 4 Hosted Shared Desktops - 4 Static VDI Desktop (with PvD) - 4 Random VDI Desktops
3 x Delivery Group - 1 Hosted Shared Desktop) - 1 Static VDI Desktop (with PvD) - 1 Random VDI Desktop
Figure 7: XenDesktop Site structure
Citrix XenDesktop structure
To facilitate management and troubleshooting for the large, multi-connection, multi-cluster environment, XenDesktop was configured as follows:
• A single Machine Catalog per cluster/datastore:
– 2 Clusters for hosted shared desktops/2 NFS datastores each—4 Machine Catalogs
– 2 Clusters for random VDI desktops/2 NFS datastores each—4 Machine Catalogs
– 2 Clusters for static VDI desktops (with PvD)/2 NFS datastores each—4 Machine Catalogs
• One Delivery Group per desktop type
The connection between XenDesktop and vCenter Server was configured with custom advanced settings, as shown in the following table:
Setting Value
Max active actions: 96
Max new actions per minute: 80
Max power actions as percentage of desktops: 4%
Max Personal vDisk power actions as percentage: 10%
The default settings were adjusted primarily to accommodate the number of hosts vCenter was managing and to control the load on hypervisor hosts and Provisioning Servers for optimal performance during the boot storm. In this configuration the boot storm for all desktop VMs completed within approximately 30 minutes.
Citrix Infrastructure SQL
Three Windows 2008 R2 ESXi VMs were configured as a Windows Server Failover Cluster for the XenDesktop SQL server. SQL Server 2012 was configured as an AlwaysOn Availability Group. Storage for these VMs was provided by a dedicated NFS datastore per server to ensure high performance. A dedicated CIFS share was provided for data synchronization and backup purposes with an additional CIFS share used for the WSFC witness.
ESXi Cluster SQL Server 2012 AlwaysOn Group
SQL Server 2012 DB Storage NFS Volume SQL Server 2012 DB Storage NFS Volume SQL Server 2012 AlwaysOn Seed CIFS FileShare NFS Database
On ESXi NFS DatastoreOn ESXi NFS DatastoreOn ESXi
XenDesktop Site Database SQL Server 2012 Server 1 ESXi VM XenDesktop Site Database Replica AlwaysOn Listener IP NFS XenDesktop Site Database Replica SQL Server VM
2nd Drive VMDK 2nd Drive VMDKSQL Server VM 2nd Drive VMDKSQL Server VM XenDesktop Site Database Backup SQL Server 2012 DB Storage NFS Volume Windows Cluster Quorum CIFS FileShare EMC VNX 7500 SQL Server 2012 Server 2 ESXi VM SQL Server 2012 Server 3 ESXi VM
Web Portal – StoreFront
Web Portal services were delivered by three StoreFront 2.0 VMs deployed in the Infrastructure cluster. A dedicated active-passive pair of NetScaler VPX virtual appliances (with a single Virtual IP) was used to load-balance the StoreFront VMs. An additional stand-alone StoreFront VM was configured to allow for AGEE integration due to the limitations of the test harness.
NetScaler VPX
StoreFront Server
NetScaler VPX
StoreFront Server StoreFront Server StoreFront Server For AGEE NetScaler VIP
for StoreFront Load Balancing
Figure 9: StoreFront deployment
Profile management
Profile management was provided by Citrix Profile Management 5.0.
Three Profile management policies were created, one per desktop type, with the following settings: Policy Static VDI desktops with PvD Random VDI desktops Hosted shared desktops Delete locally cached profiles on logoff
Disabled Enabled Enabled
Profile streaming Enabled Enabled Enabled
Always cache Disabled Disabled Disabled
Active write back Enabled Enabled Enabled
Process logons of local administrators
Enabled Enabled Disabled
Desktop virtualization
• PXE NIC #1 as the first boot device in Boot Order • HP Power Regulator P-state set to Pmax • Jumbo Frames for storage connection to EMC • Four networks configured:
– Management – Storage – vMotion – Guest
Note: The Guest network was configured to provide one VLAN for each desktop cluster, as detailed below.
Desktop hypervisor clusters
The networking for the hypervisor clusters utilized a VMware Distributed Switch (VDS), configured as follows:
• Management VLAN • Storage VLAN • vMotion VLAN
• Guest 1 VLAN (hosted shared desktops) • Guest 2 VLAN (hosted shared desktops) • Guest 3 VLAN (VDI desktops)
Note: Guest VLAN for VDI desktops is the same across all clusters.
Desktop deployment
VDI desktops
VDI desktops were configured with 1000 in total, 500 per cluster for both random VDI desktops and static VDI desktops (with PvD). Each desktop was configured as follows: • Windows 7 x64 OS
• 1.5GB / 1 vCPU • VMXNet3 NIC
• 40GB HDD (Master/vDisk) • 3GB Windows Page File • 4GB Write Cache • Cache on Device HDD
PVS for VDI desktops
PVS 7.0 was virtualized in the VDI infrastructure cluster as a single PVS farm, containing: • 4 servers
• 1 site
• 1 vDisk store
• 2 vDisks (One each for static VDI desktops (with PvD) and random VDI desktops) • A single server thread per streamed virtual desktop VM
Hosted shared desktops
Hosted shared desktops were configured with 256 in total, 128 per cluster, allowing for 1790 sessions per chassis, 3580 sessions total. Each Host was configured as follows: • Windows Server 2012
• 12GB / 4 vCPU • VMXNet3 NIC
• 60GB HDD (Master/vDisk) • 18GB Windows Page File • 25GB Write Cache • Cache on Device HDD
PVS for hosted shared desktops
PVS 7.0 was virtualized in the VDI infrastructure cluster as a single PVS farm, containing: • 4 servers
• 2 x 2 sites (PVS site per VLAN = ESXi hosted shared desktop chassis) • 2 vDisk stores (One per cluster)
• 1 vDisk per store
Notes
• For hosted shared desktops, the Windows Page file was based on 1.5x RAM; for VDI desktops it was based on 2x RAM.
• For both hosted shared and VDI desktops, Write Cache was based on 2x RAM + 1. • Memory Ballooning was disabled for all desktop VMs as per best practices.
VAMT for desktops
Microsoft VAMT 3.0 was deployed to allow for both Windows and Microsoft Office activation verification.
Test methodology
All validation testing was performed on-site at the Citrix Solutions Lab.
The focus of testing was on capturing boot-up, user logon, user logoff, and steady state metrics during the entire process of the virtual desktop lifecycle.
Test metrics were gathered for all components under test such as the hypervisor, virtual desktop, and storage and from the workload generation system, Login VSI, to determine the overall success of a test run. Each test run would need to be within the threshold of the success criteria as defined below to consider it a passing run. A test procedure is followed to provide consistency between runs. Test overview
The following test procedure was used for each test run to ensure consistent results: • Before each test, all desktop VMs and clients were cleanly started.
• All desktop VMs and client launchers were Idled for an hour for consistent results. • Boot Phase – All desktop VMs needed to power on and register within one hour. • Logon Phase – All user sessions were launched and active in Login VSI within
one hour.
• Test Phase – At least two Login VSI loops were executed in each active session. • Logoff – All users logged off after VSI completion.
• Test run reports and data were generated. • All desktop VMs and clients were shut down. Success criteria
Performance metrics were used to ensure the systems were not overloaded during the different tests. The main success criteria for the 5000 user, multi-branch test was to have 5000 active desktop sessions, to have a successful in-session workload execution from start to finish, and to ensure no single component in the deployment became overloaded.
Test tools
Test orchestration and workload generation
The primary test tool used in the environment was Login VSI 3.7, consisting of the VSI Client Launcher, VSI Workload, VSI Console, and VSI Analyzer applications. Login VSI 3.7 was used as the test orchestration and workload generation system to create the load of multiple users accessing the XenDesktop 7 environment and executing a typical user workflow within a session.
After all users had logged on, the test was configured to simulate each user executing two Login VSI loops before logging off, with each loop 12-15 minutes long.
Login VSI Console and Analyzer were used to orchestrate the test launch and analyze test results for all executed test runs.
Performance data capture
Windows Performance Monitor was used to collect data for all major systems during each test run. This provided close to real-time performance monitoring during the test and in-depth historical data analysis after test completion. All desired data including systems metrics was collected and stored.
Citrix Command Center was used to collect data for Branch Repeater and NetScaler appliances.
In-session workload simulation
Login VSI is a publicly available tool from Login VSI B.V. that provides an in session workload representative of a typical user. A predefined “medium workload” that simulates “knowledge user working” was used for this test. Flash redirection was not enabled.
The predefined workload was used to simulate user activities during the test and to find the maximum number of active sessions that the environment was able to handle. The workload script was running on the server-side desktop and the generated traffic stream was almost purely downstream.
Conclusions
The primary objective of testing was to show that XenDesktop 7 could support 5000 users in a multi-branch configuration, using multiple FlexCast models and a modular hardware approach for scaling. As stated earlier, hosted shared desktops, random VDI desktops, and static VDI desktops (with PvD) were deployed in the datacenter and combinations of the three were deployed in the remote site locations. The defined success criteria were:
• No server CPU utilization average to be over 85% while under load • Storage to perform within EMC guidelines
• 5000 users connect, complete a test run, and disconnect cleanly
The testing was executed as planned, the success criteria were met, and it was shown that XenDesktop 7 did meet the initial objective.
Notes and lessons learned
All infrastructure servers in the test environment were virtualized, reducing the number of physical servers required.
Eight physical servers were used to support the required infrastructure VMs, including Delivery Controllers, PVS servers, and SQL Servers.
27 Infrastructure VMs were created to support testing: • XenDesktop
– 3 Delivery Controller VMs
– 3 SQL Server VMs with AlwaysOn features configured • PVS (Virtual)
– 4 VMs in a VDI desktop farm
– 4 VMs in a hosted shared desktop farm • Storefront
– 3 VMs in a cluster for both the datacenter and two remote sites – 1 VM for AGEE
• vCenter
– 2 vCenter VMs
– 2 vCenter SQL Server VMs – 1 Command Center VM
– 1 SQL Server VM for Command Center • NetScaler
– 2 NS VPX VMs • License Server VM
All XenDesktop 7 server components and the infrastructure required to support those components were virtualized.
The environment was oversized to prevent limitations in trying to achieve the 5000 user goal. The appendices provide performance data and guidelines as to where the test environment could have been sized more appropriately.
Virtualizing SQL Server 2012, including the AlwaysOn features, removed the SQL Server quorum requirement in some instances.
XenDesktop 7 includes a new environment test service. This service checks and validates certain aspects of an environment, such as network and server access,
during the installation process. This offers customers increased confidence that XenDesktop will deploy successfully. During deployment of the test environment, all checks were passed and all components were deployed successfully.
By default, XenDesktop 7 provides users with an optimized graphic experience. During testing, all desktops were configured to provide default optimized graphics experience with Desktop Composition enabled. No flash remoting was utilized. The test environment was designed using a modular architecture. Each module supported 2500 users. This modular approach allowed testing to begin at a small scale, using only a single module, before adding another module, configured in the same way, to obtain the desired 5000 user count. Following this process would have allowed the environment to scale past 5000 users easily. Citrix recommends designing a deployment using a modular architecture to enable customers to simplify scaling and management.
During testing, over 5500 sessions connected and executed successfully. Less than 1% of sessions failed to connect out of 5580 sessions started. The connection failures analyzed were commonly due to either networking or test tool timing issues.
Changes to workflow and version capabilities in Provisioning Services 7.0 improved both vDisk image management and VM deployment. vDisk versioning allows image files to be updated simply and quickly. Changes to the PVS Target Device Service enable the creation and formatting of the write cache drive automatically during VM deployment. Previous versions required the administrator to create the write cache drive manually as part of a template.
The default write cache vDisk model provisioned for ESXi in the XenDesktop Setup wizard is a “thin provisioned” vDisk.
For information about overriding the default types of write cache disks created by provisioning deployments on ESXi and the defaults for other hypervisors, see the Provisioning Services 7.0 content in eDocs.
Three StoreFront servers were configured in a cluster for the datacenter and remote branch sites. When evaluating the performance of the Storefront cluster it was concluded that two servers in a cluster would have been sufficient for the entire workload, allowing for both High Availability and a single StoreFront server failure.
A separate StoreFront server was created for Access Gateway users, because of the requirements of the test tool to use Python for certain user access. To prevent conflicts between Python and SFConnect, traffic was filtered through separate StoreFront servers.
From a hardware perspective, each Host was configured with 192GB of memory and each virtual desktop VM with 1.5GB of memory. This limited the maximum number of sessions per Host to 128, not allowing any memory for the Host itself. A conservative 10GB of memory was allowed for ESXi, ensuring 120 VMs could comfortably fit into the remaining memory. Hosts were configured in this way to
Appendix A: System inventory
Physical systems
HP BL 460c Gen8 with ESXi 5.1 x 56 • 32 for Hosted Shared Desktops (2 x 16) • 24 for XenDesktop Virtual Desktops (2 x 2 x 6) • 8 for Infrastructure Function Citrix Infrastructure Virtualization Static VDI Desktops (with PvD) Random VDI Desktops Hosted Shared Desktops Hardware Model HP BL460c Gen8 HP BL460c Gen8 HP BL460c Gen8 HP BL460c Gen8 Member Host Count 8 6 6 16 Number of Network Cards 8 in total; 4 utilized 8 in total; 4 utilized 8 in total; 4 utilized 8 in total; 4 utilized VLAN Configuration • Management • Storage • Guest • vMotion • Management • Storage • Guest • vMotion • Management • Storage • Guest • vMotion • Management • Storage • Guest • vMotion Shared Storage Protocol NFS v3 NFS v3 NFS v3 NFS v3 Shared Storage Type
EMC VNX 7500 EMC VNX 7500 EMC VNX 7500 EMC VNX 7500 Operating System VMWare ESXi 5.1 VMWare ESXi 5.1 VMWare ESXi 5.1 VMWare ESXi 5.1 HA/Resiliency Configuration No HA High Availability enabled No HA No HA
Network appliances
Datacenter
Branch Repeater SDX (x2)
Device Model Role Version
Branch Repeater SDX SDX-13505 Datacenter Branch Repeater • NetScaler 9.3, Build 58.5009 • Branch Repeater VPX 6.2.0, Build 112.308159 • XenServer 5.6.100-47011p NetScaler AGEE (x2)
Device Model Role Version
NetScaler MPX-10500 Datacenter Access Gateway
NetScaler 9.3, Build 60.3
NetScaler VPX
Device Model Role Version
NetScaler VPX for ESXi StoreFront Load Balancing
NetScaler 10, Build 74.4 Large branch office
Physical Branch Repeater 8800
Device Model Role Version
Branch Repeater Repeater 8820 SM88 Series 3
Remote Site Branch Repeater
Branch Repeater VPX 6.2.0, Build 112.308159 Small branch office
Virtual Branch Repeater
Device Model Role Version
Branch Repeater VPX on XenServer 5.6 Remote Site Virtual Branch Repeater
Branch Repeater VPX 6.2.0, Build 112.308159
Virtualized systems XenDesktop infrastructure Function Citrix XenDesktop Delivery Controller Citrix Provisioning Server Citrix License Server Citrix StoreFront Server (Main and Branch Office connections through Branch Repeater) Citrix StoreFront Server (Remote connections through AGEE) Hardware Model
ESXi VM ESXi VM ESXi VM ESXi VM ESXi VM Number of vCPUs 4 4 4 2 8 Number of Cores 1 1 1 1 1 Memory 8GB 16GB 4GB 2GB 8GB Network Configu-ration 1 Network Card 2 Network Cards: • 1 Manage-ment • 1 Streaming Network 2 Network Cards: • 1 Manage-ment • 1 Streaming Network 1 Network Card 1 Network Card Hard Drive 60GB 60GB 60GB 60GB 60GB Operating System Windows 2008 R2 Windows 2008 R2 Windows 2008 R2 Windows 2008 R2 Windows 2008 R2 Software Citrix XenDesktop 7 Citrix Provisioning Server 7.0 Citrix Licensing Server 11.11 Citrix StoreFront 2.0 Citrix StoreFront 2.0
Virtual desktops
Function Streamed Static Personalized Desktop (with PvD) Streamed Random Personalized Desktop Streamed Hosted Shared Desktop
Hardware Model ESXi VM ESXi VM ESXi VM
Number of vCPUs 1 1 4 Number of Cores 1 1 1 Memory 1.5GB 1.5GB 12GB Network Configuration
• 1 Network Card • 1 Network Card • 1 Network Card Hard Drive • 40GB Master
• 4GB Write Cache • 40GB Master • 4GB Write Cache • 60GB Master • 25GB Write Cache Operating System
Windows 7 x64 Windows 7 x64 Windows Server 2012 Software • Citrix Virtual Delivery
Agent 7.0 • Citrix Provisioning Services 7.0 Target Device Software • Login VSI 3.7 • Microsoft Office 2010
• Citrix Virtual Delivery Agent 7.0 • Citrix Provisioning Services 7.0 Target Device Software • Login VSI 3.7 • Microsoft Office 2010 • Citrix Virtual Delivery Agent 7.0 • Citrix Provisioning Services 7.0 Target Device Software • Login VSI 3.7 • Microsoft Office 2010
Other infrastructure Function SQL 2012 Server VMWare vCenter 5.1 SQL 2008 R2 for vCenter Citrix Command Center SQL 2008 R2 for Command Center Hardware Model
ESXi VM ESXi VM ESXi VM ESXi VM ESXi VM Number of vCPUs 4 4 4 4 4 Number of Cores 1 1 1 1 1 Memory 16GB 16GB 32GB 16GB 16GB Network Configu-ration 1 Network Card 2 Network Cards: • 1 Manage-ment • 1 Streaming Network 1 Network Card 1 Network Card 2 Network Cards: • 1 Manage-ment • 1 Streaming Network Hard Drive • 60GB for
OS and Applica-tions • 120GB for Database Storage 60GB • 60GB for OS and Applica-tions • 200GB for vCenter Database 60GB 60GB Operating System Windows 2008 R2 Windows 2008 R2 Windows 2008 R2 Windows 2008 R2 Windows 2008 R2 Software Microsoft SQL 2012 • VMWare vCenter 5.1 • VMware Heart Beat 6.5 Server 7.0 Microsoft SQL 2008 R2 x64, Cluster Node Citrix Com-mand Center 5.1 Microsoft SQL 2008 R2 x64
Appendix B: Performance results
Storage performance
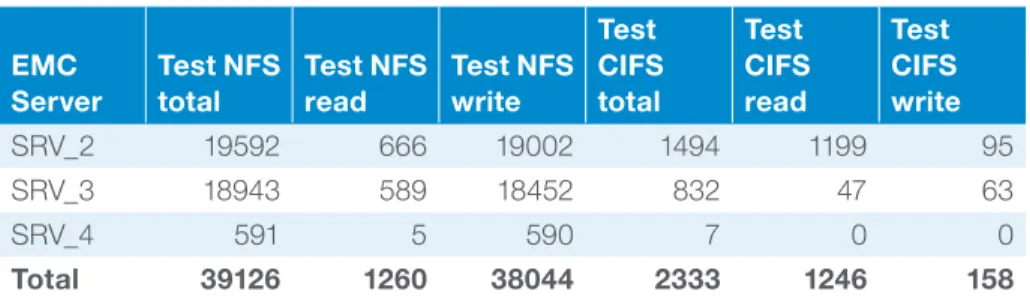
The EMC VNX 7500 provided the storage for the test environment. The VNX 7500 consisted of three Data Movers, labeled SRV_2, SRV_3, and SRV_4, supporting NFS volumes and CIFS shares. The FAST Cache capability of the VNX 7500 was leveraged to improve IOPS performance. SRV_2 and SRV_3 supported hosted shared desktops, VDI desktops, and the XenDesktop 7 infrastructure. SRV_4 supported the common infrastructure and clients.
EMC Server Boot NFS total Boot NFS read Boot NFS write Boot CIFS total Boot CIFS read Boot CIFS write SRV_2 20690 4991 17469 1742 1731 29 SRV_3 26009 5179 21928 144 140 0 SRV_4 371 11 371 7 0 0 Total 47070 10181 39768 1893 1871 29
Figure 11: Table showing boot storm IOPs peak load values during testing
EMC Server Test NFS total Test NFS read Test NFS write Test CIFS total Test CIFS read Test CIFS write SRV_2 19592 666 19002 1494 1199 95 SRV_3 18943 589 18452 832 47 63 SRV_4 591 5 590 7 0 0 Total 39126 1260 38044 2333 1246 158
Figure 12: Table showing max peak load during the 5,580 user test run
Login VSI test Boot storm test
EMC Server Average NFS read response time (ms) Average NFS write response time (ms) Average NFS read response time (ms) Average NFS write response time (ms) SRV_2 5.10917 6.23959 3.54133 2.53581 SRV_3 5.47006 7.29185 8.19353 6.18747
Figure 13: Table showing NFS read and write response time in milliseconds
When looking at read and write times for NFS, single digit response times are optimal. In the above table both read and write averages are in the single digit range, even during the boot process. Peaks during the boot and test runs did exceed the single digit recommendation, but overall performance was within acceptable boundaries.
EMC recommends keeping the number of VMs per data mover under 2000 VMs. The XenDesktop environment had around 2250 VMs total. Taking into account this information, SRV_ 4 workload could have been supported by SRV_2 and SRV_3, eliminating the need for one of the data movers.
For more information about EMC FAST Cache and VNX 7500, visit www.emc.com ESXi Server CPU performance
One of the success criteria for the test was to keep the CPU utilization across the physical servers under an 85% average utilization. The physical servers were broken out into roles, with clusters of ESXi servers assigned to each set of roles. For the hosted shared desktop, random VDI desktop, and static VDI desktop (with PvD) roles two clusters of servers were created. A single cluster was created for the VDI Infrastructure physical servers.
The following table shows the physical servers defined by roles, clusters, Average CPU Utilization across the clusters, and the CPU Utilization of each physical server within the role.
Generic
role Clusters
Test phase processor % (average) Random VDI Desktop VDINPVDCLS1 (ESXi) 69.69 VDINPVDCLS2 (ESXi) 68.65 Random VDI Desktop Per Server Averages Static VDI Desktop (with PvD) VDIPVDCLS1 (ESXi) 74.72 VDIPVDCLS2 (ESXi) 73.93
Static VDI Desktop (with PvD) Per Server Averages
Generic
role Clusters
Test phase processor % (average) Hosted Shared Desktop (SHDR2E04C1 (ESXi) 81.79 SHDR2E04C2 (ESXi) 81.34 Hosted Shared Desktop Per Server Averages VDI Infra-structure 5C1P2 (ESXi) 4.73 VDI Infrastructure Per Server Averages
Figure 14: ESXi host performance data
When looking at each role individually, the random VDI desktop servers were well below the 85% average and the individual physical servers showed room for growth. Although further testing would be required to verify, the data shows that either the number of physical servers could have been reduced by as many as two or each server could have supported additional users.
For the static VDI desktop (with PvD) servers, CPU utilization was higher due to PvD (as expected), but still under the desired guidelines. As with the random VDI desktop servers, more testing would be required but the data shows that either one physical server, at least, could be removed or the number of users per physical server could be increased.
It should be noted that Microsoft now recommends 2 GB of memory for Windows 7 64-Bit VMs. The test environment used 1.5GB. The physical servers had 192GB of memory, so going to 2 GB as recommended by Microsoft would limit the VDI servers to 96 VDI sessions as a maximum. A better number would be 90-92 to allow for operating system memory and prevent memory overcommit.
For the hosted shared desktop servers, CPU Utilization was within the desired guidelines.
Eight physical servers were allocated as VDI Infrastructure servers, to prevent the infrastructure from becoming a bottleneck. Evaluating the CPU data here and the VM performance data later in the appendix and with more testing to verify, the number of physical servers could have been reduced by as much as half. XenDesktop infrastructure VM performance
As stated previously, the XenDesktop infrastructure (StoreFront, PVS, Delivery Controllers, and vCenter Server) VMs were oversized to eliminate possible bottlenecks in performance while trying to achieve the 5000-user workload. The multiple VMS were load-balanced within each group. The following charts show the performance of individual VMs from each group; performance across other VMs in the groups was almost identical to those listed below.
Testing focused on two main areas, the boot storm, and the actual stress test run. During each test run CPU, memory, and networking performance were monitored.
Boot storms
Boot storms put a high stress level on the VMs involved. Through power management and planning most boot storms were avoided. In normal day-to-day operations boot time would be spread over several hours to prevent system overload. The StoreFront VM was not utilized during the boot storm. CPU, memory, and network utilization was close to zero for the StoreFront VM during the test.
CPU utilization
The following graphs show CPU utilization for XenDesktop infrastructure VMs during the boot storm.
Figure 16: CPU utilization for PVS VM (VDI Desktops) during boot storm
Figure 17: CPU utilization for vCenter Server VM during boot storm
Memory
PVS VM servers were configured with 16GB of memory with less than 15% of that memory utilized during the boot storms. The vCenter Server VM was configured with 16GB of RAM with less than 50% memory utilized during the boot storm. The Delivery Controller VM was configured with 8GB of memory and utilized an average of 55% during the boot storms.
Networking
The following table details the performance of the PVS NIC handling PXE traffic during the boot storm.
PVS VM NIC Bytes Received/ sec Bytes Sent/ sec Bytes Total/ sec Hosted Shared Desktops vmxnet3 Ethernet Adapter 7,696,759 374,775,734 377,569,552
VDI Desktops vmxnet3
Ethernet Adapter
5,317,918 359,490,570 361,074,115
For each PVS VM, the NIC was connected to a 3Gbps network, and utilized about 93% of the available bandwidth (377,569,552 Bytes = 2.8Gb/3Gb).
Networking for the vCenter Server VM was less that 400Mbps. For the Delivery Controller VM the network traffic was under 10Mbps.
For the boot storm process, the only concern raised was around memory utilization for the vCenter Server and Delivery Controller VMs.
Steady state test
During the steady state test, performance across both the login phase and the steady state test itself was monitored. All users were logged in over a 60 minute period. The graphs show that there was an immediate peak in CPU utilization followed by a drop to a more steady state during user login to the PVS VM running hosted shared desktops, while there was a heavier overall load during user login to the PVS VM running VDI desktops.
Logon phase
The following graphs show CPU utilization for XenDesktop infrastructure VMs during the login phase of the stress test.
Figure 19: CPU utilization for PVS VM (Hosted Shared Desktops) during the login phase
Figure 20: CPU utilization for PVS VM (VDI Desktops) during the login phase
Figure 22: CPU utilization for Delivery Controller VM during the login phase
Figure 23: CPU utilization for StoreFront VM during the login phase
Steady state test
The following graphs show CPU utilization for XenDesktop infrastructure VMs during the steady state test itself.
Figure 25: CPU utilization for PVS VM (VDI Desktops) during steady state test
Figure 26: CPU utilization for vCenter Server VM during steady state test
Figure 28: CPU utilization for StoreFront VM during steady state test
Memory
As with the boot storm, during the steady state test, less than 15% of memory was utilized on the PVS VMs; vCenter Server VM memory utilization was under 50%, and the Delivery Controller VM averaged 60%. Issues were found with the StoreFront VM. With only 2GB of memory it averaged 90% memory utilization.
Networking
During the steady state test, the PVS network traffic on the primary NIC peaked at 1.25Gbps for the Hosted Shared Desktop VMs and just under 2Gbps for the VDI Desktop VMs. For the vCenter Server VM, traffic was just under 200Mbps and for the Delivery Controller VMs it was just over 10Mbps.
About Citrix
Citrix (NASDAQ:CTXS) is the cloud company that enables mobile workstyles—empowering people to work and collaborate from anywhere, easily and securely. With market-leading solutions for mobility, desktop virtualization, cloud networking, cloud platforms, collaboration and data sharing, Citrix helps organizations achieve the speed and agility necessary to succeed in a mobile and dynamic world. Citrix products are in use at more than 260,000 organizations and by over 100 million users globally. Annual revenue in 2012 was $2.59 billion. Learn more at www.citrix.com. Copyright © 2013 Citrix Systems, Inc. All rights reserved. Citrix, XenDesktop, XenApp, NetScaler, MPX, VPX, Branch Repeater, FlexCast, Citrix Access Gateway and Citrix Provisioning Services are trademarks of Citrix Systems, Inc. and/or one of its subsidiaries, and may be registered in the U.S. and other countries. Other product and company names mentioned herein may be trademarks of their respective companies. Corporate Headquarters
Fort Lauderdale, FL, USA Silicon Valley Headquarters Santa Clara, CA, USA EMEA Headquarters Schaffhausen, Switzerland
India Development Center Bangalore, India
Online Division Headquarters Santa Barbara, CA, USA Pacific Headquarters Hong Kong, China
Latin America Headquarters Coral Gables, FL, USA UK Development Center Chalfont, United Kingdom Summary
None of the infrastructure VMs, other than the StoreFront VM which lacked sufficient memory, were overloaded or stressed during testing.
Looking at the data produced, the number of Delivery Controller and StoreFront VMs could have been reduced. For the PVS VMs, using a modular design requires at least two VMs but, looking at the data in the graphs above, the failure of a single PVS VM in one of the clusters would not have impacted the user experience. Further testing would be required to prove these hypotheses.