I
Blind Image Blur Estimation via Deep Learning
Ruomei Yan and Ling Shao,
Senior Member, IEEE
Abstract— Image blur kernel estimation is critical to blind image deblurring. Most existing approaches exploit handcrafted blur features that are optimized for a certain uniform blur across the image, which is unrealistic in a real blind deconvolution setting, where the blur type is often unknown. To deal with this issue, we aim at identifying the blur type for each input image patch, and then estimating the kernel parameter in this paper. A learning-based method using a pre-trained deep neural network (DNN) and a general regression neural network (GRNN) is proposed to first classify the blur type and then estimate its parameters, taking advantages of both the classification ability of DNN and the regression ability of GRNN. To the best of our knowledge, this is the first time that pre-trained DNN and GRNN have been applied to the problem of blur analysis. First, our method identifies the blur type from a mixed input of image patches corrupted by various blurs with different parameters. To this aim, a supervised DNN is trained to project the input samples into a discriminative feature space, in which the blur type can be easily classified. Then, for each blur type, the proposed GRNN estimates the blur parameters with very high accuracy. Experiments demonstrate the effectiveness of the proposed method in several tasks with better or competitive results compared with the state of the art on two standard image data sets, i.e., the Berkeley segmentation data set and the Pascal VOC 2007 data set. In addition, blur region segmen- tation and deblurring on a number of real photographs show that our method outperforms the previous techniques even for non-uniformly blurred images.
Index Terms— Blur classification, blur parameter estimation, blind image deblurring, general regression neural network.
I. INTRODUCTION
MAGE blur is a major source of image degradation, and deblurring has been a popular research topic in the field of image processing. Various reasons can cause image blur, such as the atmospheric turbulence (Gaussian blur), camera relative motion during exposure (motion blur), and lens aberrations (defocus blur) [1].
The restoration of blurred photographs, i.e., image deblur- ring, is the process of inferring latent sharp images with Manuscript received April 2, 2015; revised December 20, 2015; accepted February 2, 2016. Date of publication February 26, 2016; date of current version March 9, 2016. The associate editor coordinating the review of this manuscript and approving it for publication was Prof. Weisi Lin.
(Corresponding author: Ling Shao.)
R. Yan is with the College of Electronic and Information Engineer- ing, Nanjing University of Information Science and Technology, Nanjing 210044, China, and also with the Department of Electronic and Electrical Engineering, The University of Sheffield, Sheffield S1 3JD, U.K. (e-mail: [email protected]).
L. Shao is with the College of Electronic and Information Engineering, Nanjing University of Information Science and Technology, Nanjing 210044, China, and also with the Department of Computer Science and Digital Technologies, Northumbria University, Newcastle upon Tyne NE1 8ST, U.K. (e-mail: [email protected]).
inadequate information of the degradation model. There are different approaches to consider this problem. On the one hand, according to whether the blur kernel is known, deblurring methods can be categorized into blind and non-blind ([2]–[5]). Non-blind deblurring requires the prior knowledge of the blur kernel and its parameters, while in blind deblurring we assume that the blurring operator is unknown. In most situations of practical interest the Point Spread Function (PSF) is not acquired, so the application range of the blind deblurring [6] is much more common than that of the non-blind deblurring. In real applications, a single blurred image is usually the only input we have to deal with. Existing approaches for blind deblurring usually describe the blur kernel of the whole image as a single uniform model. The kernel estimation is carried out before the non- blind deconvolution step, which is the standard procedure of blind deblurring. One type of the classical blind deconvolution methods involve improving image priors in the maximum a-posteriori (MAP) estimation. In terms of image priors, sparsity priors ([3], [7]–[10]) and edge priors ([4], [11]) are commonly considered in the literature. These algorithms typically use an Expectation Maximization (EM) step, which updates the estimation of the blur kernel at one step and the sharp image at the other step. Although image prior based methods can successfully estimate the kernels as well as the latent sharp images, there are flaws which restrict their applications. The major flaw of sparsity priors is that they can only represent very small neighborhoods [12]. The edge prior methods, largely depending on the image content, will easily fail when the image content is homogeneous. In this paper, a “learned prior” based on the Fourier transform is proposed for the blur kernel estimation. The frequency domain feature and deep architectures solve the issue of no edges in some of the natural image patches. Though the input is patch-based, our framework can handle larger image patches compared to sparsity priors.
On the other hand, a blurred image can be either locally (non-uniform) or globally (uniform) blurred. In real applica- tions, locally blurred images are more common, for instance, due to multiple moving objects or different depths of field. In the previous work of Levin et al. [13], it is found that the assumption of uniform blur made by most algorithms is often violated. Therefore, we argue that significant attention should be paid to blur type classification, because the type of blur is usually unknown in photographs or various regions within a single picture. Despite its importance, only a limited number of methods have been proposed for blur type classification. One typical example is applying a Bayes Classifier using handcrafted blur features, for instance, local autocorrelation congruency [14]. Another similar method has been proposed
by Su et al. [15] based on the alpha channel feature, which has different circularity of the blur extension. Though both of them managed to detect local blurs in real images, their methods are based on handcrafted features.
Although the methods based on handcrafted features can perform well in the cases shown in [14] and [15], their applicability is still limited due to the diversity of natural images. Recently, many researchers have shifted their attention from the heuristic prior to the learned deep architecture. The deep hierarchical neural network roughly mimics the nature of the mammalian visual cortex, which has been applied in many vision tasks, such as object recognition, image classification, and even action recognition. In Jain et al.’s denoising work [16], they have shown the potential of using Convolu- tional Neural Network (CNN) for denoising images corrupted by Gaussian noise. In such an architecture, the learned weights and biases in the deep convolutional neural network are obtained through training on a sufficient number of natural images. At the testing stage, these parameters in the network act as “prior” information for the degraded images, which lead to better results than state-of-the-art denoising approaches. Another example is the blur extent metric developed by a multi-feature classifier based on Neural Networks (NN) [17]. Their results show that the combined learned features work better than most individual handcrafted features. Most previous deep architectures (NN, CNN) are trained on randomly initialized weights and gradually approximate a local optimum. Unfortunately, a bad initialization could sometimes yield a poor local optimum. To address this issue, we propose to use a Deep Belief Network (DBN) for the initialization of our Deep Neural Network (DNN). The reason why this pre-training could benefit the deep neural network has been studied in [18].
Inspired by the practical blur type classification in [14] and [15] and the merit of learned descriptors in [16] and [17], we propose the two-stage architecture for blur type classification and parameter identification. Targeting realistic blur estimation, we attempt to handle two difficulties in this paper. One of them is blind blur parameter estimation from a single (either locally or globally) blurred image without doing any deblurring. A two-stage framework is proposed: first, a pre-trained DNN is chosen for accomplishing the feature extraction and classification to determine the blur type; second, different samples with the same blur type will be sent to the corresponding GRNN blocks for the parameter estimation. A deep belief network is trained only for weight initialization in an unsupervised way. The DNN uses the weights and the backpropagation to ensure more effective training in a supervised way. The other challenge is the pixel-based blur segmentation using classified blur types. Similar to the first step in the above method, the proposed pre-trained DNN is applied for identifying blur types of all the patches within the same image.
This paper makes five contributions:
• To our knowledge, this is the first time that pre-trained DNN has been applied to the problem of blur analysis.
• A discriminative feature, derived from edge extraction on Fourier Transform coefficients, has been proposed
to preprocess blurred images before they are fed into the DNN.
• A two-stage framework is proposed to estimate the blur type and parameter for any given image patch degraded by spatially invariant blur of an unknown type.
• GRNN is first explored in this paper as a regression tool for blur parameter estimation after the blur type is determined.
• The proposed framework is also applied to real images for local blur classification.
II. RELATED WORK A.Previous Learning-Based Blur Analysis
An early popular method [19], which is a learning-based blur detector, has used combined features for the neural network. The basic idea is that blurry regions are less affected by low pass filtering compared to sharp regions. The filtering evolution based descriptors, the edge ratio, and the point spread function serve as region descriptors for the neural network.
Rather than using a single handcrafted feature, Liu et al. [14] proposed a learning-based method which combines several features together to form a more discriminative feature for blur detection. The first blur feature is the local power spectrum slope, which is based on the fact that the amplitude spectrum slope of a blurred image is steeper than that of a sharp image due to the loss of the high frequency information. The second feature is the gradient histogram span. This feature indicates the edge sharpness distribution by the gradient magnitude. The third feature is from the perspective of color saturation. Using the above three features, an image (or image patch) can be classified as blur or non-blur by training a Bayes classifier. Similarly, a motion blur descriptor, based on the local autocorrelation congruency, can be used as another feature for the Bayes classifier to distinguish motion blur from defocus blur. Later, improved handcrafted features for blur detection, classification, blurriness measure have been proposed [15], [20], leading to better results.
Another blur assessment algorithm employs multiple weak features to boost the performance of the final feature descrip- tor [17]. Their target is to measure how blurry an image is by classifying it as excellent, good, fair, poor or bad. Eight features are used as the input for a neural network. Those features are: frequency domain metric, spatial domain metric, perceptual blur metric, HVS based metric, local phase coherence, mean brightness level, variance of the HVS fre- quency response and contrast. The results have shown that the combined features work better than individual features under most circumstances.
B.Restricted Boltzmann Machines
An Restricted Boltzmann Machine (RBM) is a type of undi- rected graphical model which contains undirected, symmetric connections between the input layer (observations) and the hidden layer (representing features). There are no connec- tions between the nodes within each layer. Suppose that the
= −
input layer is hk−1, and the hidden layer is hk , k = 2, 3, 4 .. .. The probabilities in the representation model are determined by the energy of the joint configuration of the input layer and the output layer, which can be expressed as:
E(hk−1, hk ; θ) H. k−1 . Hk Hk−1 Hk wij hk−1hk − . b ihk−1 − . c jhk (1) i=1 j =1 i j i i=1 j j =1
Fig. 1. The proposed architecture: DNN is the first stage for blur type where θ = (w, b, c) denotes the model parameters, wij
represents the symmetric interaction term between unit i in the layer hk−1 and unit j in the layer hk . bi and c j are the
bias terms of the nodes i and j , respectively.
In an RBM, the output units are conditionally indepen- dent given the input states. So an unbiased sample from the posterior distribution can be obtained when an input data-vector is given, which can be expressed as:
P(h|v) = P(hi |v) (2) i
Since hi ∈ {0, 1}, the conditional distributions are given as: Hk−1
p(hk = 1|hk−1; θ) = σ(
.
wij hk−1 + c j ) (3)
classification, which has 3 output labels. GRNN is the blur PSF parameter estimation, which has different output labels for each blur type. P1, P2, and P3 are the estimated parameters, which can be seen in Sec. IV-C. B1, B2, and B3 are the features for Gaussian, motion, and defocus blur, respectively.
(a.k.a. the point spread function), ∗ indicates the convolution operator, and n is the additive noise.
In blind image deconvolution, it is not easy to recover the PSF from a single blurred image due to the loss of information during blurring [23]. Our goal is to classify the blurred patches into different blur types according to the blur related features and then we estimate blur parameters for each classified patch. Several blurring functions are considered in this paper as shown in Fig. 2.
In many applications, such as satellite imaging, Gaussian
j p(hk−1 k i i=1 Hk . k
blur can be used to model the PSF of the atmospheric turbulence: i = 1|h ; θ) = σ( wij h j + bi) (4) 1 x 2 2 j =1 q(x,σ) = √ 2πσ exp(− 1 + x2 2σ 2 ), x ∈ R (6) where σ(t) = (1 + e−t)−1.
As shown in the above equation, weights between two layers and the biases of each layer decide the energy of the joint configuration. The training process of the RBM is to update
θ = (w, b, c) by Contrastive Divergence (CD) [21].
The intuition for CD is: the training vector on the input
where σ is the blur radius to be estimated, and R is the region of support. R is usually set as [−3σ, 3σ ], because it contains 99.7% of the energy in a Gaussian function [24].
Another blur is caused by linear motion of the camera, which is called motion blur [25]:
layer is used for the inference of the output layer, so the units ⎧ ⎨⎪ 1, (x1, x2) .si n(ω)
.
= 0, x 2 + x 2 ≤ M2/4 of the output layer have been updated as well as the weights
connected between layers. Afterwards, another inference goes from the output layer to the input layer with more updates
q(x) = ⎪⎩M
0, otherwise
cos(ω) 1 2 (7)
of the weights and input biases. This process is carried out repeatedly until the representation model is built.
III. METHODOLOGY
In this section, we describe the proposed two-stage frame- work (Fig. 1) for blur classification and parameter estimation.
where M describes the length of motion in pixels and
ω is the motion direction with its angle to the x axis. These two parameters are what we need to estimate in our system.
The third blur is the defocus blur, which can be modeled as a cylinder function: ⎧
1 , 2 2
We explain the problem formulation, the proposed blur fea- q(x) =
⎨
πr 2 , x1 + x2 ≤ r (8)
tures, the training of DNN, and the structure of the GRNN in Sec. III-A, Sec. III-B, Sec. III-C, and Sec. III-D, respectively. A.Problem Formulation
The image blurring can be modeled as the following degra- dation process from the high exposed image to the observed image [22]:
g(x) = q(x) ∗ f (x) + n(x) (5) where x = {x1, x2} denotes the coordinates of an image pixel, g represents the blurred image, f is the intensity of the latent image, q denotes the blur kernel
⎩0, otherwise
where the blur radius r is proportional to the extent of defocusing.
In [14], a motion blur descriptor, local autocorrelation congruency, is used as a feature for the Bayes classifier to discriminate motion blur from defocus blur because the descriptor is strongly related to the shape and value of the PSF. Later, Su et al. [15] have presented alternative handcrafted features for blur classification, which gives better results with- out any training. Though both methods generate good results on identifying motion blur and defocus blur, the features they used are limited to a single or several blur kernels.
π Rr , r =
|
Fig. 2. Illustration of the PSF of three blur types: (a) Gaussian blur with σ = 3 and kernel size 21 × 21; (b) Motion blur with length 5, and motion angle 45◦; (c) Defocus blur with r = 5.
In this paper, we propose a general feature extractor for common blur kernels with various parameters, which is closer
where u = {u1, u2}. For the defocus blur, to realistic application scenarios. Therefore, enlightened by Q(u) = J1(π Rr)
,
u2 + u2.
1 2
the previous success of applying deep belief networks to discriminative learning [26], we use the DNN as our feature extractor for blur type classification.
When designing the DBN unsupervised training step, it is natural to use observed blurred patches as training and testing samples. However, their characteristics are not as obvious as their frequency coefficients [27]. Hence, the logarithmic power spectra are adopted as input features for the DBN, since the PSF in the frequency domain manifests different characteristics for different blur kernels. Bengio et al. [28] have pointed out that scaling continuous-valued input to (0, 1)
J1 is the first-order Bessel function of the first kind and the amplitude is characterized by almost-periodic circles of radius R along which the Fourier magnitude takes value zero.1 For the motion blur, the FT of the PSF is a sinc function: Q(u) = sin(π Mω) 1 2
π Mω , ω = ± M , ± M , .. ..
In order to know the PSF Q(u), we attempt to identify the type and parameters of Q from the observation image G(u). Therefore, the normalized logarithm of G can be used in our implementation:
log(|G(u)|) − log(|Gmin |)
worked well for pixel gray levels, but it is not necessarily appropriate for other kinds of input data. From Eq. (5) one
log(|G(u)|)norm =
log( Gmax |) − log(|G min |
(10)
)
can see that the noise might interfere the inference in the training processing [28], so preprocessing steps are necessary for preparing our training samples. In this paper, we use an edge detector to obtain binary input values for the DBN training, which has been proved to benefit the blur analysis task. As is shown in Table II, the results with edge detector are in general better than those without.
We propose a two-stage system to first classify the blur kernel and then estimate the blur parameters, which is similar to our previous work in [29]. These two stages have a similar network architecture but different input layers. The first stage is an initial classification of the blur type, and the second stage is to further estimate the blur parameters using samples within the same category from the results of the first stage. This is different from our previous work whose second stage is for parameter identification. Since the variation between blur parameters of the same blur type is not as great as that between different blur types, more discriminative features have been designed for the second stage. In the parameter estimation stage, the general regression neural network is applied for the prediction of the continuous parameter, which performs better than the plain neural networks with back-propagation in our implementations as demonstrated in [30].
B.Blur Features
1) Features for Motion and Defocus Blurs: If we apply the Fourier Transform (FT) to both sides of Eq. (5), we can obtain: G(u) = Q(u)F(u) + N(u) (9)
where G represents G(u), Gmax = maxu(G(u)), and
Gmin = minu(G(u)).
As shown in Fig. 3, the patterns in these images (log(|G(u)|)norm) can represent the motion blur or the defocus
blur intuitively. Hence, no extra preprocessing needs to be done for the blur type classification. However, defocus blurs with different radii are easy to be confused, which also has been proved in our experiments. Therefore, for blur parameter identification, an edge detection step is proposed here.
Since the highest intensities concentrate around the center of the spectrum and decrease towards its borders, the binarization threshold has to be adapted for each individual pixel, which is computationally prohibitive. If a classic edge detector is applied directly, redundant edges would interfere with the pattern we need for the DBN training. Many improved edge detectors have been explored to solve this issue, however, most of them do not apply to the logarithmic power spectra data, which cause even worse performance [31], [32]. For instance, Bao et al. [31] proposed to improve the Canny detector by the scale multiplication, which indeed enhances the localization of the Canny detector. However, this method does not generate good edges on our images.
The Edge Detection on the Logarithm Images of the Blurred Images: In this application scenario, the input for the edge detector is log(|G(u)|)norm . Since the goal of our edge detec-
tion is to obtain useful blur parameters in the deep learning process, the detected edges should be well presented by
j
Fig. 3. Illustration of the PSF of three blur types: (a) Image with Gaussian blur; (b) Image with motion blur; (c) Image with defocus blur; (d) Logarithmic spectrum of Gaussian blur (σ = 2); (e) Logarithmic spectrum of motion blur (M = 9,ω = 45); (f) Logarithmic spectrum of defocus blur(R = 30); (g) Logarithmic spectrum of Gaussian blu r (σ = 5); (h) Logarithmic spectrum of Gaussian blur (σ = 10); (i) Logarithmic spectrum of Gaussian blur (σ = 20).
the most important edges (not necessarily all of the edges). To be precise, for motion blur, all we need is several straight lines which could represent the correct motion length and angle. For defocus blur, we need to get rid of scattered and small curves and keep the continuous and smooth ones. According to Eq. (9), the image noise will affect the contrast around image edges in the logarithm spectra image. Different textures in different input images would affect the logarithm images too. However, the periodic functions of those blur kernels guarantee the distribution of the spectra images, which makes our edge detection process easier.
We solve this issue by applying the Canny detector first, and then using a heuristic method to refine the detected edges according to our goal. Due to the fact that the useful edges are isolated near zero-crossings, we need to refine the detection results from the logarithmic power spectrum. The Canny edge detector is applied to form an initial edge map. Then, we design several steps to select the most useful edges: 1) For both
2) Features for the Gaussian Blur: For the Gaussian blur, the Fourier transform of the PSF is still a Gaussian function, and there is no significant pattern change in the frequency domain. From Eq.(6), we can see that the Gaussian kernel serves as a low pass filter. When the sigma of this filter is larger, more ‘high frequency information’ will pass in. However, from our observation, when the σ is larger than 2, the pattern on the logarithmic spectrum image barely changes (as shown in Fig. 3), and only the intensity of the image changes. In the experiment section, we show that edge detec- tion can not improve the results significantly.
C. The Training Process of Deep Neural Networks
Deep belief nets are used as a generative model for feature learning in a lot of previous works [26], in which DBN has outperformed various deep learning models such as DNN and DCNN. However, in the recent research for applying deep models to image classification, DCNN has performed very well compared to most other methods on datasets like MNIST, CIFAR-10, and SVHN. [33]. In most of the classification tasks, there are subtle differences between image objects or categories, in which case learning the semantic meaning of images is very important. CNN is good at capturing the pixel correlation within a small neighborhood, which is very useful for the task of image classification.
However, in our case, we are not looking for the semantic meaning of our blur features. In fact, they are already pretty distinctive in terms of categories. The difficulty in our task is how to capture the very precise detail when we extract features for the blur classification because the distances of the extracted edges could include the category information. Therefore, in this paper, we first construct the DBN by unsupervised greedy layer-wise training to extract features in the form of hidden layers. Then the weights in these hidden layers serve as the initial values for a neural network. In this process, the neural network is trained in a supervised way.
1) Regularization Terms: Given that
E(hk−1, hk ; θ) = − log P(hk−1, hk) (11) Assume the training set is hk−1 k−1
1 , . . . , hm , the following
of the blur types, we select “important” edges. The important edges have two meanings: a) edges with the significant contrast across them. For each edge (curve), the standard deviation
regularization term is proposed for reducing the chance of overfitting:
m
. .
k−1 k
of the intensity on each side of the curve σl could be used
to measure the strength of the edges. For edges like these,
min − {wij , bi c j } p=1 log h P(hp , hp) (12) we tend to use a ranking for all the strength of the edges
in the image. For our specific problem, we only keep the
n
+ λ . |t − 1 m
.
E [h(pk) ( p(k−1)) 2
first K edges; b) edges which are isolated from other edges. j =1 m
p=1
j |h ]| (13)
Assuming the isolated region has the radius d, those edges, in the orthogonal direction of the current edge within radius d, will be discarded [11]. 2) For the motion blur, we abandon short and very curvy edges. We consider the orientations
θ = [0,π ] of the candidate edges within radius d. Also, using the results from the first step, we consider that all the edges should only have one angle which is the same as the one of the “important” edge. Therefore, it is very easy to discard unnecessary edges and refine the estimate of the blur length. Sample results are shown in Fig. 6.
where E [·] is the conditional expectation given the data, t is the constant controlling the sparseness of the hidden units hk ,
and λ is a constant for the regularization. In this way, the hidden units are restricted to have a mean value closing to t.
2) The Pretrained Deep Neural Network: The training process of the proposed DNN is described in Algorithm 1 and illustrated in Fig. 4:
• The input layer is trained in the first RBM as the visible layer. Then, a representation of the input blurred sample is obtained for further hidden layers.
i
i Algorithm 1 DNN Pretraining
Fig. 4. The diagram of the pre-trained DNN.
The goal for the optimization process is to minimize the backpropagation error derivatives:
φ∗ = arg min[− . y p log yˆ p] (14)
φ
p
Evaluate the error signals for each output and hidden unit using back-propagation of error [34].
D. General Regression Neural Network
Once our classification part is completed, the blur type of the input patch could be specified. However, what would mostly interest the user is the parameter of the blur kernel, using which the deblurring process would be greatly improved. In our previous work [29], the two-stage framework has successfully predicted the category of the parameter. In this sense, we know that this framework can work as a whole if we want to know the rough value of the blur parameter. However, to obtain the precise value of the parameter, we need to come to the regression framework.
The general regression neural network is considered to
• The next layer is trained as an RBM by greedy layer-wise information reconstruction. The training process of RBM is to update weights between two adjacent layers and the biases of each layer.
• Repeat the first and second steps until the parameters in all layers (visible and all hidden layers) are learned.
• In the supervised learning part, the above trained para- meter W, b, a are used for initializing the weights in the deep neural network.
be a generalization of both Radial Basis Function Net- works (RBFN) and Probabilistic Neural Networks (PNN). It outperforms RBFN and backpropagation neural networks in terms of the results of prediction [35]. The main function of a GRNN is to estimate a joint probability density function of the input independent variables and the output.
As shown in Fig. 5, GRNN is composed of an input layer, a hidden layer, “unnormalized” output units, a summation unit, and normalized outputs. GRNN is trained using a one-pass learning algorithm without any iterations. Intuitively, in the training process, the target values for the training vectors help to define cluster centroids, which act as part of the weights for the summation units.
Assume that the training vectors can be represented as X and the training targets are Y . In the pattern layer, each hidden unit is corresponding to an input sample. From the pattern layer to the summation layer, each weight is the target for the
M d input sample. The summation units can be denoted as:
yˆk = σ ( . w(l+1) h( . w(l) xi)) .n kj j =0 i=0 ji Yˆ = i=n 1 Yi exp(−D2 2/2σ 2 2) (15) l = 1, 2, ... , N − 1 k = 1, 2, ... , K . i=1 exp(−Di /2σ )
where D2 = (X − Xi)T (X − Xi), σ is the spread parameter.
Fig. 5. The diagram of GRNN.
In the testing stage, for any input T , the Euclidean distance between this input and the hidden units are calculated. In the summation layer, the weighted average of the possible ‘target’ is calculated for each hidden node and then averaged by the normalization process.
E.Forming the Two-Phase Structure
The proposed method is formed by two-stage learning (Fig. 1). First, the identification of blur patterns is carried out by using the logarithmic spectra of the input blurred patches. The output of this stage is 3 labels: the Gaussian blur, the motion blur and the defocus blur. With the label information, the classified blur vectors will be used in the second stage for blur parameter estimation. At this stage, motion blur and defocus blur will be further preprocessed by the edge detector (Sec. III-B) before the training but Gaussian blur vectors remain the same (As shown in our previous experiments [29], the appropriate feature for Gaussian blur is the logarithmic spectra without edge detection). This stage outputs various estimated parameters for individual GRNN as shown in Sec. IV-C.
IV. EXPERIMENTS A. Experimental Setup
Training Datasets: The Oxford image classification dataset,2 and the Caltech 101 dataset are chosen to be our training sets. We randomly selected 5000 images from each
Fig. 6. Comparison of the three edge detection methods applied to a training sample. From left to right: (a) the logarithmic power spectrum of a patch; (b) the edge detected by Canny detector (automatic thresholds); (c) the edge detected by the improved Canny detector using the scale multiplication [31]; (d) the edge detected by our method.
Testing Datasets: Berkeley segmentation dataset (200 images), which has been applied to the denoising algorithms [36], [37] and image quality assessment [38], has been used for our testing stage. Pascal VOC 2007: 500 images are randomly selected from this dataset [39].
6000 testing samples are chosen from each of them accord- ing to the same procedure as the training set. The numbers of the three types of blurred patches are random in the testing set. Blur Features: The Canny detector is applied to the logarith- mic power spectrum of image patches with automatic low and high thresholds. Afterwards, the isolated edges are selected with the radius of 3 pixels according to the suggestions from [11].
DBN Training: For parameters of the DBN learning process, the basic learning rate and momentum in the model are set according to the previous work [28]. In the unsupervised greedy learning stage, the number of epochs is fixed at 50 and the learning rate is 0.1. The initial momentum is 0.5, and it changes to 0.9 after five epochs. Our supervised fine-tuning process always converges in no more than 30 epoch.
GRNN Training: For parameters of the GRNN training, there is a smoothness-of-fit parameter σ that needs to be tuned. A range of values [0.02, 1] with the intervals of 0.1 has been used for determining the parameter, which is shown in Fig. 7. The value σ = 0.2 is selected for our implementation. of them.
The size of the training samples ranges from 32 × 32 to 128 × 128 pixels, which are cropped from the original images. By empirical evaluations, the best results occur when the patch size is 32 × 32. Each training sample has two labels: one is its blur type (the values are 1, 2, or 3) and the other one is its blur parameter (it is a continuous value which belongs to a range as shown in Sec. IV-C). The size of the training set is 36000 (randomly selected from those cropped images). In those 36000 training samples, 12000 of them are degraded by Gaussian PSF, 12000 of them are degraded by the PSF of motion blur, and the rest are degraded by the defocus PSF.
2http://www.robots.ox.ac.uk/~vgg/share/practical-image-classification.htm
B.Image Blur Type Classification
In our implementation, the input visible layer has 1024 nodes, and the output layer has 3 nodes representing 3 labels (Gaussian kernel, motion kernel, and defocus blur ker- nel). Therefore, the whole architecture is: 1024 −→ 500 −→ 30 −→ 10 −→ 3. These node numbers in each hidden layer are selected empirically.
On the one hand, we compare our method with the pre- vious blur type classification methods based on handcrafted features: [14], [15]. Their original frameworks contain a blur detection stage, and the blur type classification is applied afterwards. However, in our algorithm, the image blurs are simulated by convolving the high quality patches with various
Fig. 7. The estimation error changes with the spread parameter of GRNN. The parameter testing was done on the data which are corrupted with Gaussian blur with various kernels.
TABLE I
COMPARISON OF OBTAINED AVERAGE RESULTS ON THE TWO TESTING DATASETS WITH THE STATE-OF-THE-ART. CR1 IS THE BERKELEY
DATASET, AND CR2 IS THE PASCAL DATASET
Fig. 8. The parameter estimation was done on the data which are corrupted with different blur kernels with various sizes. In CRxx the first x refers to the dataset type (1 for Berkeley and 2 for Pascal) and the second x refers to the blur type (the Gaussian blur, the motion blur, and the defocus blur).
PSFs. In our comparison, [14] has been trained and tested with the same datasets we used, while [15] has been tested with the same testing set we used.
On the other hand, back-propagation Neural Network [40], convolutional Neural Network (CNN) [41] and Support Vector Machine (SVM) have been chosen for the comparison of the classifiers. The same blur feature vectors are used for NN and CNN. The SVM-based classifier was implemented following the usual technique: several binary SVM classifiers are combined to the multi-classifier [42].
The classification rate is used for evaluating the performance:
CR 100 Nc (%) (16)
= Na
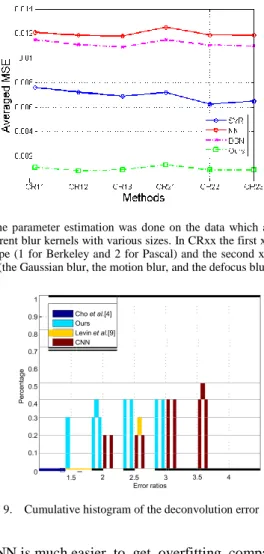
Fig. 9. Cumulative histogram of the deconvolution error ratios.
ours, CNN is much easier to get overfitting compared to the DBN.
C. Blur Kernel Parameter Estimation
In this experiment, the parameters of the blur kernels are estimated through GRNN. For different blur kernels, different parameters are estimated as explained in Sec. III-A. The parameters are set as: 1) Gaussian blur has a range: σ = [1, 5]; 2) Motion blur has ω = [30, 180]; 3) defocus blur: R = [2, 23]. The architectures in each GRNN are the same.
The first comparison is between our previous method [29] where Nc is the number of correct classified samples, and Na
is the total number of samples.
We can observe from Table I that algorithms based on learned features perform better than those based on hand- crafted features, which suggests that learning-based feature extractor is less restricted to the type of the blur we con- sider. Meanwhile, our method performs best among all the algorithms using automatically learned features. The reason why DBN in this task can achieve better results than CNN is that CNN is trained in a supervised way from the beginning, which will take large quantity of training data. Though our labeled training data is large, it is still difficult to avoid overfitting when the appropriate size of the CNN is not known. However, DBN is trained as a generative model first, and then a distinctive model, which means it learns the ‘feature’ before the ‘classification’. For problems like
and the method proposed in this paper, through which we would like to see the improvement by using the regression rather than the classification. Table II has shown the perfor- mance of the image deblurring using the estimated parameters. One can see that apart from the Gaussian blur, both results of the other two types have been improved significantly by using parameter estimation instead of classification. Visual results of this experiment are also shown in Fig. 11. The metrics we used for this comparison are PSNR, SSIM, Gradient Magnitude Similarity Deviation (GMSD) [43], and Gradient Similarity (GS) [44].
The other type of comparisons are made between our methods and other regression methods. Specifically, our method is compared to the back-propagation Neural Network, Support Vector Regressor (SVR) [45], and pre-trained DNN plus linear regressor (the same input layer of the blur features
TABLE II
QUANTITATIVE COMPARISON OF THE PROPOSED METHOD AND THE PREVIOUS METHOD [29]. THE RESULTS SHOWN ARE THE AVERAGE VALUES OBTAINED ON THE SYNTHETIC TEST SET
Fig. 10. Comparison of the deblurred results of images corrupted by motion blur with length 10 and angle 45. (a) Ground truth. (b) The blurred image. (c)CNN. (d) Levin et al. [9]. (e) Cho and Lee [4]. (f) Ours.
but continuous targets instead of discrete labels). As shown in Fig. 8, our GRNN method achieves the best results among all, which demonstrate the fact mentioned in [35] and [46] that GRNN yields better results compared to back-propagation neural network. As can be seen from the figure, SVR performs much better than neural networks with our input data, which also proves that determining prediction results directly from the training data seems to be a better scheme for our problem compared to the weight tuning in the back-propagation frameworks. Moreover, our proposed GRNN works better than the pre-trained DNN with a linear regressor as shown in Fig. 8, which shows that GRNN is a better regressor for the blur analysis.
D. Deblurring Synthetic Test Images Using the Estimated Values
Once the blur type and the parameter of the blur kernel are estimated, it is easier to use non-blind image reconstruction method EPLL [5] to restore the latent image. The restored images are compared with the results of several popular blind image deblurring methods in the case of motion blur (easier for fair comparisons).
The quantitative reconstruction results are presented by the cumulative histogram [13] of the deconvolution error ratio across test datasets in Fig. 9. The error ratio in this figure is calculated by comparing the two types of SSD error between reconstructed images and the ground truth images (e.g. bin error = 2.5 counts the percentage of test examples achieving error ratio below 2.5). One of them is the restored results using estimated kernel and the other one is with the truth kernel.
The deconvolved images are shown in the following Fig. 10. Contrary to the quantitative results, it is obvious that our deblurred images have very competitive visual quality. Our method outperforms CNN a lot due to the fact that our GRNN step can provide much more precise parameter estimation. Another comparison of the deconvolution results of real test images is shown in the Fig. 13.
E.Blur Region Segmentation on the Real Photographs In this experiment, our DNN structure is trained on real photographs, from which blurred training patches are extracted. The blur types of the patches are manually labeled. 200 partially blurred images are selected from Flickr.com. Half of these images are used for training and the other half
Fig. 11. Comparison of the deblurred results of different images corrupted by various blur kernels. (a) Ground truth. (b) The defocus blur. (c) [29]. (d)Ours. (e) Ground truth. (f) The Gaussian blur. (g) [29]. (h) Ours. (i) Ground truth. (j) The motion blur. (k) [29]. (l) Ours.
Fig. 12. Comparison of the blur segmentation results for real image which was blurred with non-uniform blur kernels. (a) input blurred image; (b)blur segmentation result in [14]; (c) blur segmentation result in [15]; (d) our result.
Fig. 13. Comparison of the deblurring results for partially blurred images. (a) input blurred image; (b) deblurring result of [29]; (c)our result. (Zoom in for better viewing).
are used for testing according to what has been described in paper [14]. The size of each patch is still the same compared to previous experiments (32 by 32). Using the blur type
classification results by our proposed method, we also consider the spatial similarity of blur types in the same region mentioned by Liu et al.’s [14].
The segmentation result of our method is compared with [14] and [15] in Fig. 12. As can be seen from these subjective results, our classification is more solid even when the motion is significant. This is useful for real deblurring applications.
V. CONCLUSIONS
In this paper, a learning-based blur estimation method has been proposed for blind blur analysis. Our training samples are generated by patches from abundant datasets, after the Fourier transform and our designed edge detection. In the training stage, a pre-trained DNN has been applied in a supervised way. That is, the whole network is trained in an unsupervised manner by using DBN and afterwards the backpropagation fine-tunes the weights. In this way, a discriminative classifier can be trained. In the parameter estimation stage, a strong regressor GRNN is proposed to deal with our problem of blind parameter estimation. The experimental results have demon- strated the superiority of our proposed method compared to the state-of-the-art methods for applications such as blind image deblurring and blur region segmentation for real blurry images.
REFERENCES
[1] R. L. Lagendijk and J. Biemond, Basic Methods for Image Restoration and Identification. London, U.K.: Academic, 2000.
[2] D. Krishnan and R. Fergus, “Fast image deconvolution using hyper- Laplacian priors,” in Proc. Conf. Adv. Neural Inf. Process. Syst., Vancouver, BC, Canada, 2009, pp. 1–9.
[3] R. Fergus, B. Singh, A. Hertzmann, S. T. Roweis, and W. T. Freeman, “Removing camera shake from a single photograph,” ACM Trans. Graph., vol. 25, no. 3, pp. 787–794, Jul. 2006.
[4] S. Cho and S. Lee, “Fast motion deblurring,” in Proc. ACM SIGGRAPH Asia, Yokohama, Japan, 2009, Art. no. 145.
[5] D. Zoran and Y. Weiss, “From learning models of natural image patches to whole image restoration,” in Proc. IEEE Int. Conf. Comput. Vis., Barcelona, Spain, Nov. 2011, pp. 479–486.
[6] M. S. C. Almeida and L. B. Almeida, “Blind and semi-blind deblur- ring of natural images,” IEEE Trans. Image Process., vol. 19, no. 1, pp. 36–52, Jan. 2010.
[7] Q. Shan, J. Jia, and A. Agarwala, “High-quality motion deblurring from a single image,” ACM Trans. Graph., vol. 27, no. 3, pp. 721–730, Aug. 2008.
[8] N. Joshi, R. Szeliski, and D. J. Kriegman, “PSF estimation using sharp edge prediction,” in Proc. IEEE Conf. Comput. Vis. Pattern Recognit., Anchorage, AK, USA, 2008, pp. 1–8.
[9] A. Levin, Y. Weiss, F. Durand, and W. T. Freeman, “Efficient marginal likelihood optimization in blind deconvolution,” in Proc. IEEE Conf. Comput. Vis. Pattern Recognit., Colorado Springs, CO, USA, Jun. 2011, pp. 2657–2664.
[10] D. Krishnan, T. Tay, and R. Fergus, “Blind deconvolution using a normalized sparsity measure,” in Proc. IEEE Conf. Comput. Vis. Pattern Recognit., Colorado Springs, CO, USA, Jun. 2011, pp. 233–240. [11] T. S. Cho, S. Paris, B. K. P. Horn, and W. T. Freeman, “Blur kernel
estimation using the radon transform,” in Proc. IEEE Conf. Comput. Vis. Pattern Recognit., Colorado Springs, CO, USA, Jun. 2011, pp. 241–248. [12] L. Sun, S. Cho, J. Wang, and J. Hays, “Edge-based blur kernel estimation using patch priors,” in Proc. IEEE Int. Conf. Comput. Photography, Cambridge, MA, USA, Apr. 2013, pp. 1–8.
[13] A. Levin, Y. Weiss, F. Durand, and W. T. Freeman, “Understanding and evaluating blind deconvolution algorithms,” in Proc. IEEE Conf. Comput. Vis. Pattern Recognit., Miami Beach, FL, USA, Jun. 2009, pp. 1964–1971.
[14] R. Liu, Z. Li, and J. Jia, “Image partial blur detection and classification,” in Proc. IEEE Conf. Comput. Vis. Pattern Recognit., Anchorage, AK, USA, Jun. 2008, pp. 1–8.
[15] B. Su, S. Lu, and C. L. Tan, “Blurred image region detection and classification,” in Proc. 19th ACM Multimedia, Scottsdale, AZ, USA, 2011, pp. 1397–1400.
[16] V. Jain and H. Seung, “Natural image denoising with convolutional networks,” in Proc. Conf. Adv. Neural Inf. Process. Syst., Vancouver, BC, Canada, 2008, pp. 769–776.
[17] A. Ciancio, A. L. N. T. da Costa, E. A. B. da Silva, A. Said, R. Samadani, and P. Obrador, “No-reference blur assessment of digital pictures based on multifeature classifiers,” IEEE Trans. Image Process., vol. 20, no. 1, pp. 64–75, Jan. 2011.
[18] D. Erhan, P. Manzagol, Y. Bengio, S. Bengio, and P. Vincent, “The difficulty of training deep architectures and the effect of unsupervised pre-training,” in Proc. IEEE Int. Conf. Artif., Intell., Statist., Clearwater Beach, FL, USA, May 2009, pp. 153–160.
[19] J. Rugna and H. Konik, “Automatic blur detection for metadata extrac- tion in conten-based retrieval context,” in Proc. SPIE Internet Imag. V, vol. 5304. San Diego, CA, USA, 2003.
[20] K. Gu, G. Zhai, W. Lin, X. Yang, and W. Zhang, “No-reference image sharpness assessment in autoregressive parameter space,” IEEE Trans. Image Process., vol. 24, no. 10, pp. 3218–3231, Oct. 2015.
[21] G. E. Hinton, “Training products of experts by minimizing contrastive divergence,” Neural Comput., vol. 14, no. 8, pp. 1771–1800, Aug. 2002. [22] R. Molina, J. Mateos, and A. K. Katsaggelos, “Blind deconvolution using a variational approach to parameter, image, and blur estimation,”
IEEE Trans. Image Process., vol. 15, no. 12, pp. 3715–3727, Dec. 2006. [23] W. Hu, J. Xue, and N. Zheng, “PSF estimation via gradient domain correlation,” IEEE Trans. Image Process., vol. 21, no. 1, pp. 386–392, Jan. 2012.
[24] F. Chen and J. Ma, “An empirical identification method of Gaussian blur parameter for image deblurring,” IEEE Trans. Signal Process., vol. 57, no. 7, pp. 2467–2478, Jul. 2009.
[25] D. Kundur and D. Hatzinakos, “Blind image deconvolution,” IEEE Signal Process. Mag., vol. 13, no. 3, pp. 43–64, May 1996.
[26] S.-H. Zhong, Y. Liu, and Y. Liu, “Bilinear deep learning for image classification,” in Proc. 19th ACM Int. Conf. Multimedia, Scottsdale, AZ, USA, 2011, pp. 343–352.
[27] M. Cannon, “Blind deconvolution of spatially invariant image blurs with phase,” IEEE Trans. Acoust., Speech, Signal Process., vol. 24, no. 1, pp. 58–63, Feb. 1976.
[28] Y. Bengio, P. Lamblin, D. Popovici, and H. Larochelle, “Greedy layer- wise training of deep networks,” in Proc. Conf. Adv. Neural Inf. Process. Syst., Vancouver, BC, Canada, 2006, pp. 1–6.
[29] R. Yan and L. Shao, “Image blur classification and parameter identifi- cation using two-stage deep belief networks,” in Proc. Brit. Mach. Vis. Conf., Bristol, U.K., 2013, pp. 70.1–70.11.
[30] D. F. Specht, “A general regression neural network,” IEEE Trans. Neural Netw., vol. 2, no. 6, pp. 568–576, Nov. 1991.
[31] P. Bao, L. Zhang, and X. Wu, “Canny edge detection enhancement by scale multiplication,” IEEE Trans. Pattern Anal. Mach. Intell., vol. 27, no. 9, pp. 1485–1490, Sep. 2005.
[32] W. McIlhagga, “The Canny edge detector revisited,” Int. J. Comput. Vis., vol. 91, no. 3, pp. 251–261, Feb. 2011.
[33] C. Lee, S. Xie, P. Gallagher, Z. Zhang, and Z. Tu. (2014). “Deeply- supervised nets.” [Online]. Available: http://arxiv.org/abs/1409.5185. [34] Y. LeCun et al., “Backpropagation applied to handwritten zip code
recognition,” Neural Comput., vol. 1, no. 4, pp. 541–551, Dec. 1989. [35] D. Tomandl and A. Schober, “A modified general regression neural
network (MGRNN) with new, efficient training algorithms as a robust ‘black box’-tool for data analysis,” Neural Netw., vol. 14, no. 8, pp. 1023–1034, Oct. 2001.
[36] S. Roth and M. J. Black, “Fields of experts: A framework for learning image priors,” in Proc. IEEE Conf. Comput. Vis. Pattern Recognit., San Diego, CA, USA, Jun. 2005, pp. 860–867.
[37] D. Martin, D. Fowlkes, and J. Malik, “A database of human segmented natural images and its application to evaluating segmentation algorithms and measuring ecological statistics,” in Proc. IEEE Int. Conf. Comput. Vis., Vancouver, BC, Canada, Jul. 2001, pp. 416–423.
[38] K. Gu, G. Zhai, X. Yang, and W. Zhang, “Using free energy principle for blind image quality assessment,” IEEE Trans. Multimedia, vol. 17, no. 1, pp. 50–63, Jan. 2015.
[39] M. Everingham, V. G. L., C. Williams, J. Winn, and A. Zisserman, “The pascal visual object classes challenge,” Int. J. Comput. Vis., vol. 88, no. 2, pp. 303–338, Jan. 2010.
[40] T. Mitchell. Machine Learning. New York, NY, USA: McGraw-Hill, 1997.
[41] R. Palm, “Prediction as a candidate for learning deep hierarchical models of data,” M.S. thesis, Dept. Inform., Tech. Univ. Denmark, Kongens Lyngby, Denmark, 2012.
[42] S. Duan and K. Keerthi, “Which is the best multiclass svm method? An empirical study,” in Proc. Int. Conf. Multiple Classifier Syst., Seaside, CA, USA, 2005.
[43] W. Xue, L. Zhang, X. Mou, and A. C. Bovik, “Gradient magnitude similarity deviation: A highly efficient perceptual image quality index,”
IEEE Trans. Image Process., vol. 23, no. 2, pp. 684–695, Feb. 2014. [44] A. Liu, W. Lin, and M. Narwaria, “Image quality assessment based
on gradient similarity,” IEEE Trans. Image Process., vol. 21, no. 4, pp. 1500–1512, Apr. 2012.
[45] S. R. Gunn, “Support vector machines for classification and regres- sion,” School Electron. Comput. Sci., University of Southampton, Southampton, U.K., Tech. Rep., 1998.
[46] Q. Li, Q. Meng, J. Cai, H. Yoshino, and A. Mochida, “Predicting hourly cooling load in the building: A comparison of support vector machine and different artificial neural networks,” Energy Convers. Manage., vol. 50, no. 1, pp. 90–96, Jan. 2009.
Ling Shao (M’09–SM’10) is currently a Professor with the Department of Computer Science and Digi- tal Technologies, Northumbria University, Newcastle Upon Tyne, U.K., and a Guest Professor with the College of Electronic and Information Engineer- ing, Nanjing University of Information Science and Technology. He was a Senior Lecturer (2009–2014) with the Department of Electronic and Electrical Engineering, The University of Sheffield, and a Senior Scientist (2005–2009) with Philips Research, The Netherlands. His research interests include com- puter vision, image/video processing, and machine learning. He is a fellow of the British Computer Society and the Institution of Engineering and Technology. He is an Associate Editor of the IEEE TRANSACTIONS ON IMAGE PROCESSING, the IEEE TRANSACTIONS ON NEURAL NETWORKS AND LEARNING SYSTEMS, and several other journals.
Ruomei Yan received the B.Eng. degree in telecom- munications engineering and the M.Eng. degree in telecommunications and information systems from Xidian University, China, and the Ph.D. degree in electronic and electrical engineering from The University of Sheffield, U.K. Her research interests include image processing, machine learning, and image compression.