Bulletin
NSWBureauofCrimeStatisticsandResearch
Contemporary Issues in Crime and Justice
Number 112
February 2008
Community supervision and rehabilitation:
Two studies of offenders on supervised bonds
Don Weatherburn and Lily Trimboli
Convicted offenders are often subjected to some form of supervision to reduce the risk of further offending.
To date, however, there has been no Australian research into the effectiveness of supervision in reducing re- offending. This bulletin presents the results of two studies. The first assesses the effectiveness of supervision
by comparing re-offending (as measured by re-conviction) among adult offenders placed on supervised bonds, to re-offending among a matched sample of such offenders placed on unsupervised bonds. The results of this study indicate that offenders placed on supervised bonds are no less likely to re-offend than offenders placed on unsupervised bonds. The second study involves a survey of New South Wales Parole
staff designed to shed light on the findings of the first study. The second study finds evidence of significant
barriers to the rehabilitation of adult offenders on supervised bonds in NSW, including lack of access to
suitable mental health, drug and alcohol and disability services, difficulties securing stable and affordable
accommodation and inadequate supervision.
Keywords: Re-offending, supervised bonds, propensity matching.
Background
One of the most common methods More recent reviews of the available
employed to reduce the risk of re- evidence support MacKenzie’s view. In Re-offending is a matter of perennial offending among offenders released into their systematic review of what works concern to agencies within the criminal the community is to subject them to some in adult corrections, Aos et al. (2006a) justice system and with good reason. More form of monitoring or supervision. In her found no effect of intensive supervision on than a third of the adult offenders who are landmark review of the evidence on what offending but an average 16.7 per cent convicted in NSW courts are re-convicted works in reducing re-offending, however, reduction in re-offending for offenders of a further offence within two years (Smith MacKenzie (2002, p. 385) found that placed on treatment-oriented intensive & Jones 2007). The re-conviction rate of supervision programs. The distinctive
intensive supervision, home confinement
juveniles is higher, with 59 per cent being feature of treatment-oriented intensive and increased referral, monitoring and
re-convicted within two years (Smith & supervision is that it provides an management in the community, on
Jones 2007). The re-conviction rate for opportunity to address the problems that their own, have no effect on the rate of
offenders released from custody is also underlie offending behaviour. re-offending. According to MacKenzie
high. Jones et al. (2006) found that 60 The issue of rehabilitation has acquired (2002), the most effective rehabilitation
per cent of a cohort of offenders released particular significance since the NSW programs are those that:
from NSW prisons in the financial year Government announced a plan to
• …use multiple treatment components,
2000/2001 was re-convicted by September reduce recidivism by ten per cent by
focus on developing skills …and,
2004. The high rate of re-conviction is not 2016 (NSW Government 2006). There peculiar to NSW. It is also found in other • provide for substantial, meaningful contact is little chance of achieving this goal Australian States and overseas (Payne between the treatment personnel and the through programs that only reach a 2007; Tarling 1993). participants. (MacKenzie 2002, p. 385). small proportion of offenders coming
into contact with the criminal justice system, regardless of their effectiveness. If the aim is to reduce the overall rate of re-offending within a relatively short period of time, the policy focus should be on programs that are known to be effective and which reach a large number of offenders. Supervised orders are of particular significance in this context. In 2006, the NSW Local Courts placed 6,536 offenders on supervised bonds (NSW Bureau of Crime Statistics and Research 2006, p. 27). A further 2,890 offenders were given suspended sentences with supervision (also, technically, supervised bonds). At any given time, the NSW Department of Corrective Services (DCS) has responsibility for more than 10,000 offenders on probation (NSW Department of Corrective Services 2006, pp 39-153). This bulletin presents the results of two studies bearing on the effectiveness of supervised bonds as a means of reducing re-offending. The first assessed the effectiveness of supervision by comparing re-conviction rates (our measure of re-offending) among offenders placed on supervised bonds to re-conviction rates among offenders placed on unsupervised bonds. The second involved a survey of Probation and Parole staff, designed to elicit their views on a series of issues related to rehabilitation, such as access to mental health and drug and alcohol services; the availability of employment opportunities and accommodation; and, the extent to which Probation and Parole staff are able to properly supervise the offenders under their care. The results of the first study indicate that offenders placed on supervised bonds are no less likely to offend than those placed on unsupervised bonds. The second study sheds light on the first by finding evidence that significant barriers exist in NSW to effective offender rehabilitation.
Study 1: IntroductIon
Section nine of the NSW Crimes(Sentencing Procedure) Act (1999)
permits a court to make an order directing an offender to enter a good behaviour
bond for a specified term (not exceeding five years). Under section 95 of the Act, courts imposing a good behaviour bond on an offender may stipulate that he or she must adhere to various conditions, such as participating in an intervention, treatment or rehabilitation program. The Probation and Parole Service (PPS, a branch of Community Offender Services in DCS) has responsibility for providing this supervision and for providing or arranging interventions designed to reduce the risk of re-offending.
As with all Probation and Parole services, the PPS endeavours to provide a combination of both supervision and support to offenders. Offenders placed on a community-based order are initially screened using the Level of Service Inventory-Revised (LSI-R: Andrews & Bonta 1995) to assess their risk of further offending and their criminogenic needs (i.e. the problems that need to be addressed to reduce the risk of further offending). The results of this assessment are then used to guide the level of supervision and kind of support provided to offenders.
It is important to note that offenders placed on supervised bonds are not necessarily supervised for the entire duration of their bond. Offenders judged to be more serious risks are generally subjected to more protracted and intense supervision than those judged to be less serious risks. The PPS runs a number of its own rehabilitation programs
(e.g. a Drug and Alcohol Addiction Program, a Relapse Prevention Program and a Pathways to Employment,
Education and Training Program). However, it is also heavily dependent on the willingness and capacity of other Government and non-Government agencies to provide services that are necessary to an offender’s rehabilitation (e.g. for intellectual disability, drug dependence and unemployment). If the supervision and support provided by DCS are an effective means of reducing the risk of re-offending, all other things being equal, those who receive it should
be less likely to re-offend, than those who do not. It follows that offenders placed on supervised bonds should (other things being equal) be less likely to re-offend than those placed on unsupervised bonds. This study tests this hypothesis by comparing re-offending among a group of adult offenders in NSW given a bond with supervision (BWS) to re-offending among a group of adult offenders in NSW given a bond without supervision (BWOS).
There are two major methodological challenges in any study of this sort. The first concerns the difficulty of measuring recidivism. Most offences pass undetected so it is impossible to measure the actual rate of re-offending. The second concerns the difficulty of controlling for extraneous factors (e.g. prior criminal record, gender, Indigenous status) when comparing recidivism rates among offenders placed on supervised bonds to recidivism rates among those placed on unsupervised bonds. Failure to control these factors could result in misleading conclusions about the effectiveness of supervision in reducing recidivism.
In this study, re-offending is defined in terms of re-conviction. Although this is not a perfect measure (some offences invariably escape detection), there is a strong positive relationship between self-reported and officially recorded rates of offending (Hindelang, Hirschi & Weis 1979). As long as there is no systematic bias in the likelihood of an offence leading to a criminal conviction, two groups differing in their rate of offending should also differ in their rates of re-conviction. The approach adopted to deal with the second difficulty is to use a technique known as Propensity Score Matching (PSM). PSM was developed in medical research to test causal hypotheses about the effectiveness of medical interventions in circumstances where randomised controlled trials would be either unethical or impractical. It involves examining the relationship between treatment and outcome amongst groups
of individuals who have been previously matched on their likelihood of receiving treatment. The assumption underpinning PSM is that, once individuals have been matched on the likelihood of receiving treatment, chance factors alone will determine who actually receives treatment. Any differences between treatment and control groups can therefore be attributed to treatment rather than to other factors associated with treatment. The advantages of PSM over more conventional statistical methods for assessing treatment efficacy are discussed in Rubin and Thomas (1996). The object of the present study, then, is to see whether there is a difference between offenders given supervised and those given unsupervised bonds in terms of (a) the proportion convicted of a further offence; and, (b) the time to the first re-conviction (amongst those who have a further conviction).
Method
reSearch Strategy
There are five steps in the use of PSM. The first involves building a predictive model of who receives treatment. The second involves using the model to generate predicted treatment probabilities. The third involves dividing the sample into groups, matched on treatment probability. The fourth involves an examination of treated and non-treated subjects within each group to see if there are any significant differences between them on the co-variates included in the predictive model for treatment (known as a co-variate balance check). The fifth involves examining the relationship between treatment and outcome in each of the treatment groups that have been matched on treatment probability.
data Source
The principal data source for the study was the Bureau’s re-offending database (ROD).1 ROD contains details of all persons convicted in the NSW Children’s,
Local and Higher Courts from 1994 onwards. To conduct the present study, a subset of records was extracted from ROD containing information on the 12,939 individuals who were convicted in a NSW Local Court in the year 2000 (their index court appearance) and who received either a section 9 bond with supervision (5,054 offenders) or a section 9 bond without supervision (7,885 offenders). These data were matched against records held by the DCS on offenders placed on supervised bonds. This cross-matching led to the removal of 101 records
belonging to offenders who were recorded in ROD as having been on a supervised bond but who were recorded by DCS as having been in custody at the time the supervised order was imposed upon them. About 10 per cent of the offenders recorded in ROD as having been placed on a non-supervised order, were recorded by DCS as having been placed on a supervised order. An offender was therefore deemed to have been placed on a supervised bond only if the records held by both the NSW Bureau of Crime Statistics and Research (BOCSAR) and DCS indicated they had been placed on a supervised order.
analySIS technIque
In the present study, the ‘treatment’ group consisted of the 4,432 offenders placed on supervised bonds in the year 2000. The control group consisted of the 8,406 offenders placed on a bond without any supervision requirement during the same year. The outcome of interest is re-offending, which we define as
conviction for a further offence committed within five years of the index court appearance. To identify variables potentially relevant to the decision about whether or not to place an offender on a supervised bond, the bi-variate relationships between supervision status and a range of variables drawn from ROD were examined. Variables were selected for examination on the basis of their likely relevance to sentencing decisions (Snowball & Weatherburn 2007).
The independent variables examined were:
1. age;
2. gender;
3. Aboriginal and Torres Strait Islander
(ATSI) status;
4. principal offence at the index court
appearance;
5. whether the defendant pleaded guilty to the principal offence;
6. number of concurrent convictions at
the index court appearance;
7. number of prior court appearances
resulting in at least one conviction;
8. whether the offender had previously
been convicted of breaching a court order;
9. whether the offender had previously
received a suspended sentence of imprisonment (SS);
10. whether the offender had previously received a full-time prison sentence (F/T prison);
11. whether the offender had previously received a sentence of periodic detention (PD); and,
12. whether the offender was on bail on the date of the index court appearance.
Bi-variate analyses were carried out to determine which of these variables were related to the likelihood of receiving a supervised bond. All variables found to be significant bi-variate predictors of supervision status were then fitted to a logistic regression model, with the probability of receiving a supervised order as the dependent variable. Non-significant variables in the model were dropped. The reduced model was used to calculate a predicted probability of receiving a supervised order for each individual in the sample. Offenders were then placed into ten equal groups, stratified according to their predicted probability of receiving a supervised bond. As a check on the effectiveness of the matching technique, chi-square (co-variate balance) tests were
carried out on each of the ten supervision risk groups to see whether there were any differences between BWS and BWOS offenders, in terms of the variables included in the reduced model. The model was tested for multicollinearity but no evidence of multicollinearity appeared. To test for differences in the risk of re-offending, chi-square tests were carried out within each group of offenders to see whether those who received a supervised bond were less likely to re-offend than those who received an unsupervised bond. To test for differences in the time to offend, log-rank tests were conducted on the Kaplan-Meier survival curves within each group to see whether there were any significant differences in the survival time to the first re-conviction for BWS offenders compared with BWOS offenders. Offenders were followed from 2000 to 2006.
reSultS
deScrIptIve StatIStIcS
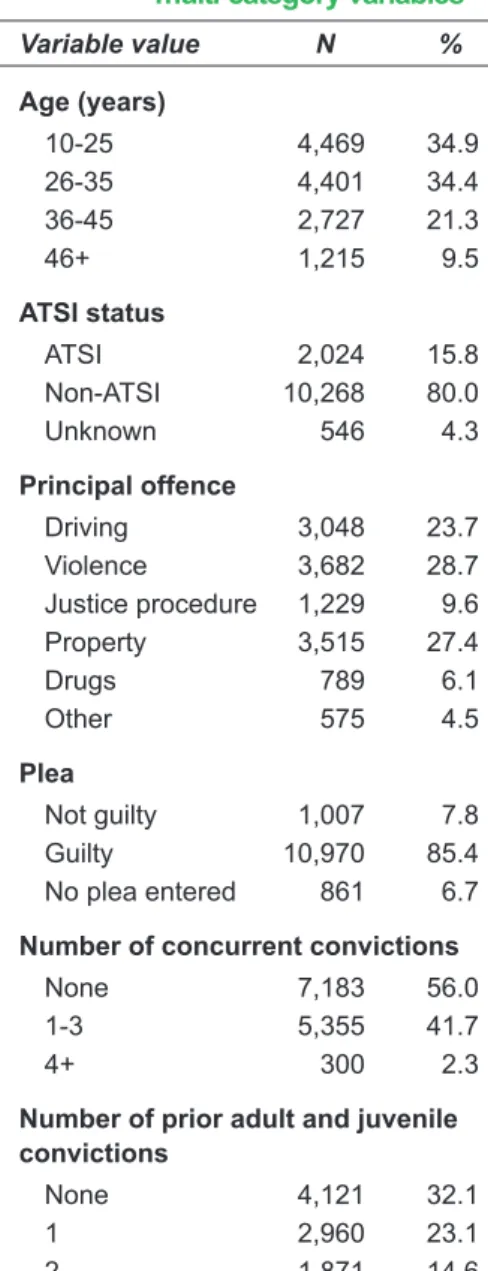
All continuous variables (e.g. age, number of prior juvenile and adult court appearances resulting in at least one conviction) were recoded into multi-category variables. Table 1 provides descriptive data on the dichotomous variables in the above list. Table 2 provides descriptive data on the multi-category variables.
SIgnIfIcant BI-varIate relatIonShIpS wIth SupervISIon
Table 3 shows the bi-variate relationships between each of our independent variables and the likelihood of receiving a supervised bond. The first column of Table 3 shows the percentage of offenders with each of the characteristics described above who were given a supervised order. The second column indicates the number of offenders (N) with that characteristic. The third and fourth columns provide the relevant χ2 and p-values, respectively.
Table 3 shows that offenders in the sample were significantly more likely to receive a supervised order if they:
• were younger; • were on bail;
• had previously been imprisoned; • had previously received a sentence of
periodic detention;
• had previously received a suspended sentence;
• had previously breached a court order;
• had larger numbers of concurrent convictions;
• had larger numbers of prior convictions;
• pleaded guilty or no plea was entered;
• were Indigenous.
The likelihood of a bond with supervision is also related to the principal offence; with offenders convicted of drug offences being most likely to receive a bond with supervision, followed by those convicted of property offences, offences against justice procedures, violent offences, ‘other’ offences and driving offences.2 As noted earlier, all variables found to be significant bi-variate predictors of supervision status were fitted to a logistic regression model with probability of receiving a supervised order as the dependent variable. Table 4 presents the reduced model for supervised bonds. The variable previous suspended sentence
was not included because of the small number of cases involved (see Table 3). Non-significant factors have been removed from the model as per the procedure outlined earlier.
The Hosmer and Lemeshow test result was not significant (χ2 = 6.706, df = 8, p = 0.569), and the ROC-statistic was 0.638, indicating that the model provides a satisfactory overall fit to the data. The model was therefore used to calculate the predicted probability of receiving a supervised order for each individual in the sample and the resulting probability distribution was divided into deciles.
Table 1:
Descriptive data for
dichotomous variables
Variable value N % Male 10,501 81.8 Previous breach 1,553 12.1 Previous F/T prison 1,392 10.8 Previous PD 396 3.1 Previous SS 27 0.2 On bail 5,650 44.0 Supervised bond 4,432 34.5 Reconvicted within 7,476 58.2 5 yearsTable 2:
Descriptive data for
multi-category variables
Variable value N % Age (years) 10-25 4,469 34.9 26-35 4,401 34.4 36-45 2,727 21.3 46+ 1,215 9.5 ATSI status ATSI 2,024 15.8 Non-ATSI 10,268 80.0 Unknown 546 4.3 Principal offence Driving 3,048 23.7 Violence 3,682 28.7 Justice procedure 1,229 9.6 Property 3,515 27.4 Drugs 789 6.1 Other 575 4.5 Plea Not guilty 1,007 7.8 Guilty 10,970 85.4 No plea entered 861 6.7 Number of concurrent convictionsNone 7,183 56.0
1-3 5,355 41.7
4+ 300 2.3
Number of prior adult and juvenile convictions None 4,121 32.1 1 2,960 23.1 2 1,871 14.6 3 1,257 9.8 4+ 2,629 20.5
Table : Bi-variate relationships with supervision
Table : Risk of receiving a
Characteristic % BWS N χ2 p-value Age (years) 43.6 <0.000 18-25 37.2 1,663 26-35 35.1 1,544 36-45 32.5 885 46+ 27.9 339 Bail status 85.6 <0.000 On bail 31.1 2,234 Not on bail 36.2 2,198 Previous imprisonment 62.5 <0.000 Yes 44.0 613 No 33.4 3,819
Previous periodic detention 4.3 <0.022
Yes 39.4 156
No 34.4 4,276
Previous suspended sentence 9.7 <0.002
Yes 63.0 17
No 34.5 4,415
Previous breach of juvenile or adult
court order 71.8 <0.000 Yes 44.1 685 No 33.2 3,747 Concurrent convictions 144.9 <0.000 None 30.4 2,182 1-3 39.1 2,094 4+ 52.0 156 ATSI status 146.3 <0.000 ATSI 39.0 790 Non-ATSI 34.9 3,579 Unknown 11.5 63 Plea 65.4 <0.000 Not guilty 23.8 240 Guilty 35.0 3,844 No plea entered 40.4 348
Prior juvenile and adult record group 364.5 <0.000
None 24.5 1,008 1 33.3 987 2 38.9 727 3 40.9 514 4+ 45.5 1,196 Principal offence 100.2 <0.000 Driving 29.4 895 Other 30.6 176 Violence 33.0 1,215 Justice procedure 35.3 434 Property 39.1 1,375 Drugs 42.7 337
supervised order
(reduced model)
p- Odds Variable value ratioOn bail 0.000 1.272
Plea 0.000
Guilty v. not guilty 0.000 1.745 No plea v. not guilty 0.000 1.809
ATSI status 0.000 Non-ATSI v. unknown 0.000 2.597 ATSI v. unknown 0.000 2.457 Concurrent Offences 0.000 1-3 v. none 0.000 1.340 4+ v. none 0.000 1.979 Prior record 0.000 1 v. none 0.000 1.475 2 v. none 0.000 1.830 3 v. none 0.000 1.924 4+ v. none 0.000 2.274 Index offence 0.000 Other v. driving 0.057 1.333 Violence v. driving 0.002 1.175 Justice v. driving 0.038 1.129 Property v. driving 0.000 1.493 Drugs v. driving 0.000 1.683 Constant 0.000 0.051
Co-variate balance tests were then conducted within each decile to see how well the BWS and BWOS offenders in each supervision risk group were matched in terms of the co-variates included in Table 4. Since there are ten risk groups and six variables, 60 separate co-variate balance tests are required. To mitigate the risk of a Type 1 error associated with the conduct of so many significance tests and such a large sample size, the alpha level for a significant difference was set at 0.01. Only one of the 60 tests yielded a χ2 value that was significant at p = 0.01 or lower.3 Compared with BWS offenders, a higher proportion of BWOS offenders pleaded either not guilty or had no plea recorded against them.4
effect of supervision on
risk of re-offending
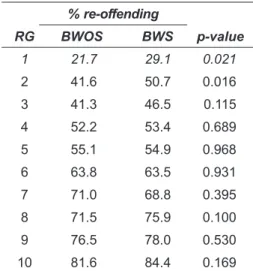
This section examines the relationship between supervision status and (a) risk of re-offending; and, (b) time to re-offend for each of the ten supervision risk groups. Table 5 shows the relationship between supervision and risk of re-offending in each of the ten supervision risk groups. The first column shows the risk groups ranked from lowest risk of supervision (RG1) to highest risk of supervision (RG10). The next two columns show the percentage of offenders who re-offended (BWOS offenders in the second column and BWS offenders in the third column). The fourth column shows the p-value associated with the difference in risk of re-offending between the BWS and BWOS offenders. Row one has been italicised to draw attention to the fact that co-variate balance checks for this comparison indicated some significant differences in the characteristics of BWS and BWOS offenders.
It is obvious from Table 5 that there is no supervision risk group in which rates of re-offending are significantly lower amongst those given supervised bonds than amongst those given bonds without supervision. The only significant differences are those involving groups one and two. In both of these groups, BWS offenders actually have a higher risk of re-offending.
Table :
Effect of supervision on
risk of re-offending
% re-offending RG BWOS BWS p-value 1 21.7 29.1 0.021 2 41.6 50.7 0.016 3 41.3 46.5 0.115 4 52.2 53.4 0.689 5 55.1 54.9 0.968 6 63.8 63.5 0.931 7 71.0 68.8 0.395 8 71.5 75.9 0.100 9 76.5 78.0 0.530 10 81.6 84.4 0.169Figure 1: RG1 Survival Function
Cumulative Survival Bond type 1.0 0.8 0.6 0.4 0.2 0.0 supervised unsupervised supervised-censored unsupervised-censored 0 500 1000 1500 2000 2500
Days since index court appearance
effect of supervision on
time to re-offend
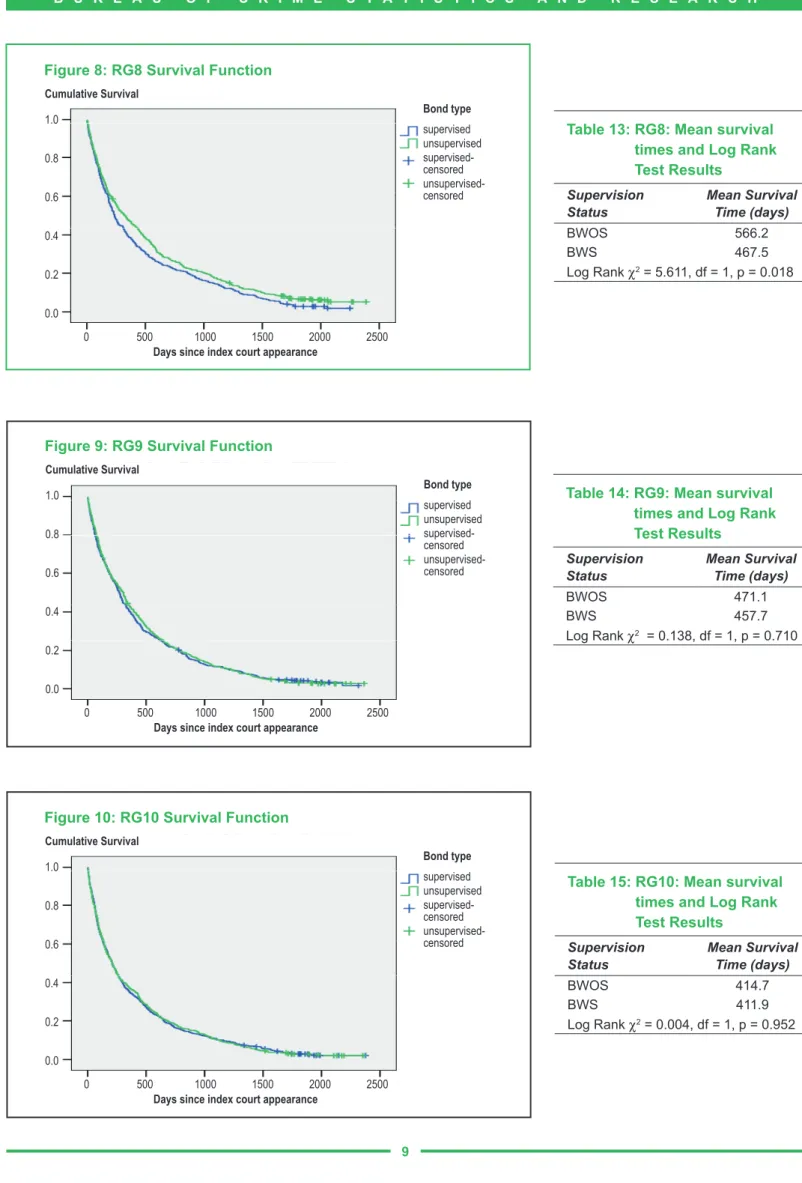
Figures 1 to 10 and Tables 6 to 15 show the survival functions, mean time to fail and log rank test results for RG1 to RG10. The ordinate on each graph shows the proportion of offenders who have not been re-convicted of a further offence. The abscissa shows time (in days) since the index court appearance. Each step down on the curve reflects a failure (re-conviction) on the part of one or more of the offenders in the sample. The crosses indicate points where the follow-up period for an offender expired (i.e. the data for that subject were censored). The green curve shows the survival function for BWOS offenders. The blue curve shows the survival function for BWS offenders. The findings obtained in relation to time to first re-conviction generally mirror those obtained in relation to risk of re-offending. There are no significant differences in survival time for BWS and BWOS offenders except for RG8, where BWOS offenders take slightly longer to fail than BWS offenders.
Table :
RG1: Mean survival
times and Log Rank
Test Results
Supervision Mean Survival
Status Time (days)
BWOS 844.2
BWS 881.2
Table 8: RG: Mean survival
times and Log Rank
Test Results
Supervision
Status Mean Survival Time (days)
BWOS 736.3
BWS 664.4
Log Rank χ2 = 1.257, df = 1, p = 0.262
Table 9: RG: Mean survival
times and Log Rank
Test Results
Supervision
Status Mean Survival Time (days)
BWOS 708.5
BWS 655.4
Log Rank χ2 = 0.760, df = 1, p = 0.383
Table : RG2: Mean survival
times and Log Rank
Test Results
Supervision
Status Mean Survival Time (days)
BWOS 803.8 BWS 696.2 Log Rank χ2 = 1.600, df = 1, p = 0.206 0 500 1000 1500 2000 2500 Bond type supervised unsupervised supervised-censored unsupervised-censored
Days since index court appearance
0 500 1000 1500 2000 2500 1.0 0.8 0.6 0.4 0.2 0.0
Figure 2: RG2 Survival Function
Cumulative Survival
Figure : RG Survival Function
Bond type supervised unsupervised supervised-censored unsupervised-censored Cumulative Survival
Days since index court appearance
0 500 1000 1500 2000 2500 1.0 0.8 0.6 0.4 0.2 0.0
Figure : RG Survival Function
Bond type supervised unsupervised supervised-censored unsupervised-censored Cumulative Survival
Days since index court appearance
0 500 1000 1500 2000 2500 1.0 0.8 0.6 0.4 0.2 0.0
Figure : RG Survival Function
Cumulative Survival
0 500 1000 1500 2000
Days since index court appearance 1.0 0.8 0.6 0.4 0.2 0.0 Bond type supervised unsupervised supervised-censored unsupervised-censored
Table 10: RG: Mean survival
times and Log Rank
Test Results
Supervision Mean Survival
Status Time (days)
BWOS 608.4
BWS 573.6
Log Rank χ2 = 0.324, df = 1, p = 0.569
2500
Figure : RG Survival Function
Cumulative Survival
0 500 1000 1500 2000
Days since index court appearance
Bond type supervised unsupervised supervised-censored unsupervised-censored 2500
Table 11: RG: Mean survival
times and Log Rank
Test Results
Supervision Mean Survival
Status Time (days)
BWOS 635.5
BWS 614.5
Log Rank χ2 = 0.095, df = 1, p = 0.758
Table 12: RG: Mean survival
times and Log Rank
Test Results
1.0 0.8 0.6 0.4 0.2 0.0Figure : RG Survival Function
Cumulative Survival 1.0 0.8 0.6 0.4 0.2 0.0 Bond type supervised unsupervised supervised-censored
unsupervised-censored Supervision Mean Survival
Status Time (days)
BWOS 575.6
BWS 503.2
Log Rank χ2 = 2.341, df = 1, p = 0.126
0 500 1000 1500 2000 2500
Days since index court appearance
Figure 8: RG8 Survival Function
Cumulative Survival
0 500 1000 1500 2000
Days since index court appearance 1.0 0.8 0.6 0.4 0.2 0.0 Bond type supervised unsupervised supervised-censored unsupervised-censored
Table 1: RG8: Mean survival
times and Log Rank
Test Results
Supervision Mean Survival
Status Time (days)
2500
Figure 9: RG9 Survival Function
Cumulative Survival
0 500 1000 1500 2000
Days since index court appearance
Bond type supervised unsupervised supervised-censored unsupervised-censored 2500 BWOS 566.2 BWS 467.5 Log Rank χ2 = 5.611, df = 1, p = 0.018
Table 1: RG9: Mean survival
times and Log Rank
Test Results
Supervision Mean Survival
Status Time (days)
BWOS 471.1
BWS 457.7
Log Rank χ2 = 0.138, df = 1, p = 0.710
Table 1: RG10: Mean survival
times and Log Rank
Test Results
1.0 0.8 0.6 0.4 0.2 0.0Figure 10: RG10 Survival Function
Cumulative Survival 1.0 0.8 0.6 0.4 0.2 0.0 Bond type supervised unsupervised supervised-censored
unsupervised-censored Supervision Mean Survival
Status Time (days)
BWOS 414.7
BWS 411.9
Log Rank χ2 = 0.004, df = 1, p = 0.952
0 500 1000 1500 2000 2500
Days since index court appearance
Study 1: SuMMary and
dIScuSSIon
The aim of study one was to examine the effectiveness of supervised bonds in reducing recidivism. The results indicate that, other things being equal, offenders placed on supervised bonds are no less likely to re-offend than a matched group of offenders placed on non-supervised bonds. They also indicate that offenders placed on supervised bonds generally re-offend at the same speed as those placed on bonds without supervision.
One possible explanation for this finding is that the level of supervision and/or type of treatment and support actually provided to offenders placed on supervised bonds in NSW is not adequate to reduce the risk of re-offending. The next study in this bulletin addresses this possibility.
Study 2: IntroductIon
The best way to rigorously assess the level of supervision and support provided to offenders on supervised orders would be to track a cohort of such offenders over time and measure the level and type of supervision and support they actually receive. By comparing the form and pattern of service actually received with the form and pattern that past research has shown to be effective in reducing re-offending, definite conclusions could be drawn about why supervised orders fail to reduce recidivism in NSW. Such a study, unfortunately, would be both time consuming and expensive. The approach adopted here is to survey Probation and Parole Officers responsible for supervising offenders placed on community-based orders and ask them about the quality of supervision and support provided to offenders on supervised bonds.The PPS has a number of attractions as a source of information about offender rehabilitation. Firstly, Probation and Parole Officers are generally well aware (both through training and experience)
of the factors that need to be addressed to reduce the risk of further offending. Secondly, because they are responsible for supervising offenders, they are in a good position to report on whether they have enough time to supervise offenders placed on bonds. Thirdly, because they are responsible for brokering or arranging services designed to address the risk factors for offending, they are also in an ideal position to identify any problems that exist in the provision of such services. There is always a risk in interviewing any service provider that they may exaggerate or minimise the problems they face. This risk cannot be eliminated but it can be decreased by emphasising the importance of an objective evaluation, by assuring Officers their answers will be kept confidential and by avoiding questions likely to provoke a defensive or critical response.
Method
Survey deSIgn
The selection of issues included in the survey was guided by three considerations:
(a) past research on risk factors associated with re-offending;
(b) past research on programs designed to reduce re-offending; and,
(c) consultation with senior Officers from DCS.
The literature in relation to (a) is very large, but some of the more important risk factors include low intellectual functioning (intellectual disability), criminogenic needs (e.g. poor job skills, unemployment, lack of stable accommodation, drug and alcohol dependence) and poor social skills (Gendreau, Little & Goggin 1996; Bernfeld, Farrington & Leschied 2001). There is an emerging consensus in the literature on adult recidivism that the most effective intervention strategies are those that explicitly target factors known through prior assessment of an offender to exert an influence on his or her criminal activity
and which involve multiple programs and supports, according to need (MacKenzie 2002, p. 385). Among programs falling into this category, the following appear to be effective (MacKenzie 2002; Aos et al. 2006a; Aos et al. 2006b):
• programs designed to address drug and alcohol dependence or abuse; • programs designed to provide
vocational training and/or employment;
• programs designed to teach offenders new social skills or enhance self-control (e.g. cognitive behavioural therapy); and,
• programs designed to provide post-release support
(e.g. accommodation).
Consultations with senior Officers from DCS highlighted a number of other possible barriers to rehabilitation:
• the long waiting list for certain services (e.g. alcohol and other drug services);
• the difficulties faced by offenders in country areas in obtaining transport to certain services;
• the cost of certain services (e.g. those provided by psychologists); and,
• the limited availability of certain services (e.g. services for offenders with acquired brain injury).
The survey therefore focussed on seven key issues:
1. access to mental health services;
2. access to alcohol and other drug
services;
3. access to employment opportunities;
4. access to education and training
opportunities;
5. access to stable accommodation;
6. access to disability services; and
7. adequacy of supervision.
The body of the survey involved a series of 27 questions organised around each of the six services listed above. The first two questions about each service
were concerned with how many of the respondent’s clients needed the service and how many were receiving it. Each respondent was then asked a series of questions about issues such as the delay in obtaining the service; the cost of the service and any transport difficulties associated with accessing the service. At the end of each set of questions dealing with a particular service, respondents were asked to indicate how important they believed the service was to offender rehabilitation.
The seventh issue listed above (i.e. adequacy of supervision) was addressed by asking three questions:
(a) At the moment, how many offenders on bonds do you supervise? (b) What proportion of your time is
spent monitoring offenders who are on supervised bonds as opposed to referring them and liaising with service providers?
(c) Do you find that you have enough time to supervise offenders? Most questions in the survey required a four-point Likert-scale response but questions dealing with the importance of the service to offender rehabilitation required a five-point Likert-scale response. Toward the end of the survey, respondents were asked whether they wished to make any other comment on difficulties associated with other services or service provision. The survey took about 15 minutes to complete and was pilot tested on six Officers with extensive experience in supervising offenders. The interviews were conducted between October and November 2007.5
Sample selection and survey
administration
Prior to commencing interviews, the DCS Commissioner wrote to all Probation and Parole Officers informing them about the impending survey and encouraging them to participate. The Director of BOCSAR wrote a similar letter to the 270 Officers randomly selected for inclusion in the survey, assuring them that the survey was voluntary and that any information
they provided would be kept strictly confidential. All interviews were conducted by phone. Each person contacted
for interview was given the following instructions:
The Bureau of Crime Statistics and Research is conducting a survey of Probation and Parole Officers around the State. We’re interested in finding out about the services that are available in your geographical area for offenders who’ve been placed on supervised bonds. We’re particularly interested in the issues that are facing these offenders in connection with each of these services.
By now, you would’ve received a letter from both Ron Woodham [the Director General of DCS] and Don Weatherburn [the Director of BOCSAR] telling you about this survey. DCS gave us a list of all Probation and Parole Officers in NSW and we randomly selected Officers to contact.
The survey should take about 15 minutes or so. Everything you tell me is confidential. I’m the only person who will see the information that you give me.
Individual Officers won’t be identified. In a few months time, the Bureau will publish a report based on the results; this will be available on our website, if you’re interested. In terms of the survey, I’d like to ask you the same sort of questions about a number of different services, and then a few general questions at the end. For most questions, I’ll give you some answers. I’d like you to choose the answer that’s most appropriate for your geographical area.
If you’d like to make some more comments, perhaps you could wait until the end.
The original plan was to interview a random sample of 200 Probation and Parole Officers. Of the 425 Officers on the staff register, 122 (28.7%) were found to be either no longer employed by DCS, on leave or not eligible for inclusion in the survey because they did not supervise offenders on bonds. A further 70 Officers could not be contacted, although several attempts to do so were made. Due to
delays in contacting respondents, the target sample size was reduced to 155 Officers. Where an Officer could not be reached or was found not to be directly involved in supervising offenders, the next Officer on the staff register was contacted. The overall response rate (i.e. the number interviewed divided by the number from whom an interview was sought) was 68 per cent. The participation rate (i.e. the number interviewed divided by the number actually contacted for interview) was 98 per cent.
reSultS
Table 16 shows responses to questions in the survey dealing with the perceived importance of different services to offender rehabilitation. Responses in the categories ‘very important’ and ‘extremely important’ have been combined, as have responses in the categories ‘not at all important’ and ‘a bit important’.
The third column shows the percentage of respondents who regarded the service as either ‘very important’ or ‘extremely important’. The second column lists the number of observations on which the percentage in the third column is based. The column labelled 'p-value' shows the results of a binomial test designed to assess whether the distribution of responses over response options could have come about by chance.
All response patterns are significant and the percentage endorsing each category of service as either ‘very’ or ‘extremely important’ is high for every category of service. The most important services, as far as Probation and Parole Officers are concerned, are drug and alcohol services, mental health services, and secure and stable accommodation, in that order. When responses to these questions were disaggregated by location of respondent, a higher proportion of Probation and Parole Officers in the urban statistical subdivisions (SSDs) of Sydney, Hunter and Illawarra regarded disability services as ‘fairly important’ or ‘very important’,
compared with their counterparts working
Table 16: Services considered by Probation and Parole Officers
in country SSDs (82.8% compared withto be important to rehabilitation
70.1%; χ2 = 3.43, df = 1, p = 0.049).Per cent reporting Tables 17(a) to 17(e) deal with the ‘very’ or ‘extremely’
N important p-value respondents’ level of concern about How important to offender rehabilitation is 1541 0.94 0.000
mental health treatment?
How important to offender rehabilitation is 155 0.98 0.000 treatment for the abuse of alcohol/drugs?
How important is employment to 155 0.88 0.000 rehabilitation?
How important to offender rehabilitation is 155 0.71 0.000 further education and training?
How important to offender rehabilitation is 155 0.91 0.000 secure and affordable accommodation?
How important are disability services to 1542 0.77 0.000 offender rehabilitation?
1 Excludes one case where the Officer could not answer this question. 2 Excludes one case where the Officer could not answer this question.
Table 17(a): Probation and Parole Officer ratings of mental health services
Per cent reporting a‘fairly big’ problem or
N a ‘very big’ problem p-value
How big a problem for your clients is the lack 155 0.59 0.024 of suitable mental health services in your
geographical area?
How big a problem for your clients is the 1541 0.58 0.044 waiting list for mental health services in the
public health system?
How big a problem for your clients is the 922 0.49 0.917 waiting list for mental health services in the
private health system?
How big a problem is the cost of mental health 155 0.25 0.000 services in the public health system?
How big a problem is the cost of private 1373 0.83 0.000 specialised mental health services
(e.g. psychologists)?
How big a problem is the lack of suitable 155 0.52 0.630 transport to mental health services?
various aspects of each service. The response options of ‘not a big problem’ and ‘a bit of a problem’ have been collapsed together, as have the response options of a ‘fairly big problem’ and ‘a very big problem’. The third column in each table shows the percentage judging some aspect of the service to be a ‘fairly big’ problem or a ‘very big’ problem. The remaining columns are as described in connection with Table 16.
Mental health services
Respondents in the survey were asked what proportion of their clients needed treatment for mental health problems. Twenty per cent of respondents did not answer this question at the time the interview was conducted. Averaged over respondents who answered this question, about 33 per cent of offenders on
supervised bonds were said to be in need of mental health treatment, but responses to this question ranged from zero to 100 per cent (SD = 20%). Averaged over respondents, 21 per cent were said to be actually getting mental health treatment but, again, responses ranged widely (zero to 75%; SD = 20%).
Table 17(a) shows the response pattern to questions dealing with mental health services. The area of greatest overall concern is clearly the cost of private specialised mental health services (e.g. psychologists), with 83 per cent of respondents citing this as a ‘fairly big’ or ‘very big’ problem. A substantial proportion of Probation and Parole staff also report significant problems with lack of mental health services and/or the waiting list for mental health services.
1 Excludes one case in a country area where the Officer could not answer the question.
2 Excludes 32 cases in urban areas and 20 cases in country areas because the offenders in these areas
reportedly cannot afford the private health system. It also excludes two cases in urban areas and two cases in country areas where there is reportedly no private health system.
3 Excludes 11 cases in urban areas and three cases in country areas because the offenders reportedly
cannot afford the private health system. It also excludes three cases in country areas where there is
reportedly no private health system and one case in a country area because the Officer could not
answer the question.
The response patterns associated with the questions How big a problem for your clients is the waiting list for mental health services and How big a problem is the lack of suitable transport to mental health services were not significant.
When responses to the questions dealing with mental health services were disaggregated by the location of the respondent, a somewhat different pattern emerges. Approximately 74 per cent of respondents working in country statistical subdivisions (SSDs) reported that the lack of availability of mental health services was a ‘fairly big’ or ‘very big’ problem, compared with 48.3 per cent working in the Sydney, Illawarra or Hunter (i.e. urban) SSDs (χ2 = 10.09, df = 1, p = 0.001). Furthermore, whereas 39.2 per cent of those working in urban SSDs said the waiting list for mental health services in the private health system was a ‘fairly big’ or ‘very big’ problem, the corresponding percentage in country SSDs was 61.0 per cent (χ2 = 4.31, df = 1, p = 0.031). Lack of suitable transport was also more frequently cited in country SSDs than in urban SSDs as a ‘fairly big’ or ‘very big’ problem (54.3% v. 32.4%; χ2 = 7.52, df = 1, p = 0.005). These differences are reflected in the comments made by respondents when answering the questions about mental health. Some respondents, for example, noted that getting offenders into acute care for mental health problems is much easier than getting ongoing treatment for offenders with a mental health problem, particularly in the more remote parts of NSW.
Drug and alcohol services
Respondents in the survey were asked what proportion of their clients on supervised bonds needed treatment for a drug and/or alcohol problem. Twenty per cent of respondents did not answer this question at the time of the interview. Averaged over those who did answer the question, 65 per cent of offenders were said to be in need of drug and/or alcohol treatment, but individual responses ranged between 14 and 100 per cent (SD = 22%). When asked what percentage of their clients were getting treatment for a drug and/or alcohol problem, 20 per cent did not answer the question at the time of the interview.
Table 17(b): Probation and Parole Officer ratings of
drug and alcohol services
Per cent reporting a ‘fairly big’ problem or
N a ‘very big’ problem p-value
How big a problem for your clients is the lack of suitable services for alcohol and/or other drugs in your geographical area?
1541 0.57 0.090
How big a problem for your clients is the waiting list for services for alcohol and/or other drugs?
1532 0.58 0.052
How big a problem is the cost of services for alcohol and/or other drugs?
1543 0.27 0.917
How big a problem is the lack of suitable transport to services for alcohol and/or
1534 0.50 0.000
other drugs?
1 Excludes one case in a country area because the Officer asserted that there is no service available. 2 Excludes two cases in country areas because the Officer asserted that there are no services available. 3 Excludes one case in a country area because the Officer asserted that there is no service available. 4 Excludes one case in an urban area because the Officer could not answer the question and one case in a
country area because the Officer asserted that there is no service available.
Amongst those who did answer the question, the average was 41 per cent, with individual responses ranging from zero to 100 per cent (SD = 24%). Table 17(b) shows the pattern of
responses to questions dealing with drug and/or alcohol services for offenders on supervised bonds. None of the comparisons in Table 17(b), except those associated with ‘lack of transport’, is statistically significant, although the issue of waiting lists for drug and/or alcohol services comes close to significance. When responses to the questions dealing with drug and/or alcohol services were disaggregated by respondent location, however, a number of significant concerns emerged. Whereas 51.7 per cent of respondents in urban SSDs regarded the waiting list for drug and/or alcohol services as a ‘fairly big’ or ‘very big’ problem, the corresponding figure for respondents living in country SSDs was 66.7 percent (χ2 = 3.44, df = 1, p = 0.045). There were also differences between urban and country areas on the issue of transport. Whereas 41.9 per cent of respondents in urban SSDs regarded the lack of suitable transport to drug and/or alcohol services
as a ‘fairly big’ or ‘very big’ problem, the corresponding figure for respondents living in country SSDs was 59.7 per cent (χ2 = 4.78, df = 1, p = 0.021).
Comments made by several respondents during the course of their interview provide confirmation of concern about drug and/or alcohol services in country areas. Some respondents commented that there are significant problems in parts of the State with access to methadone maintenance treatment, detoxification services and residential rehabilitation. The fact that many services only operate during business hours was also said to make it difficult for some offenders to reconcile treatment and employment obligations, particularly if the public transport system was lacking or very limited.
Employment, education and training Twenty per cent of respondents were unable to state at the time of the interview what proportion of offenders in their caseload was currently seeking employment. Averaged across those who did respond to this question, 24 per cent of offenders on supervised bonds were
said to be currently seeking employment
(range = zero to 99%, SD = 18%). An average of 35 per cent, overall, were said to be currently in employment (range = zero to 94%, SD = 19%) but, as with other similar questions, 20 per cent did not answer the question at the time of the interview. It should be noted that offenders who are not employed, cannot be classified as unemployed unless they are actively seeking work.
There was a very large gap between the proportion judged by Probation and Parole Officers to need further education and/or training and the proportion actually getting it, with 52 per cent in the former category and just 11 per cent in the latter. As usual, however, the answers to both these questions were highly variable. Twenty per cent of respondents did not answer either question at the time of the interview. Individual responses to the question about seeking education and training ranged from six to 100 per cent (SD = 27%), while those to the question about getting further education and training ranged from zero to 100 per cent (SD = 16%).
Table 17(c) deals with Probation and Parole Officer ratings of employment opportunities and opportunities for education and training. Neither of the response patterns to questions dealing with opportunities for education and training is significant, but respondents living in country SSDs more often than their counterparts in urban SSDs cited lack of suitable education and training opportunities as a ‘fairly big’ or ‘very big’ problem (56.7% v. 41.2%; χ2 = 3.63, df = 1, p = 0.041). They were also substantially more likely than their urban counterparts to cite lack of transport to education and training opportunities as a ‘fairly big’ or ‘very big’ problem (63.2% v. 35.6%; χ2 = 11.66, df = 1, p = 0.001).
All comparisons involving employment opportunities were significant. The proportions of Probation and Parole Officers concerned about the barriers to employment caused by lack of training and lack of social skills are
particularly high (with 87.0% and 87.7%, respectively, citing these issues as ‘fairly big’ or ‘very big’ problems). It is clear from Table 17(c), however, that lack of employment opportunities and lack of suitable transport to employment are also important issues. A higher percentage of respondents (74.6%) living in country SSDs saw the lack of employment opportunities as a ‘fairly big’ or ‘very big’ problem compared with those living in urban SSDs (60.9%), although the difference was not quite significant (χ2 = 3.21, df = 1, p = 0.052). Respondents living in country SSDs were also much more likely than their counterparts living in urban SSDs to cite
lack of transport to employment as a ‘fairly big’ or ‘very big’ problem (83.8% v. 58.6%; χ2 = 11.48, df = 1, p = 0.001). When asked whether employers were willing to hire someone with a criminal record, just fewer than 60 per cent reported that they were ‘occasionally willing’ and just fewer than 40 per cent reported that they were ‘fairly willing’. Very small proportions said that employers were ‘very willing’ or ‘not at all willing’.6 Comments made by respondents during the course of the interview suggest that sex offenders and those with a drug and/or alcohol problem have particular difficulty finding employment. Several Officers
Per cent reporting a ‘fairly big’ problem or
N a ‘very big’ problem p-value
Table 17(c): Probation and Parole Officer ratings of employment,
educational and training opportunities
How big a problem is the lack of suitable employment opportunities?
How big a problem for your clients is the lack of suitable transport to employment? How big a barrier to employment is the offenders’ lack of training and education? How big a barrier to employment is the offenders’ lack of social skills?
How big a problem is the lack of suitable education and/or training opportunities in your geographical area?
How big a problem for your clients is the lack of suitable transport to education and/or training opportunities?
1541 0.67 0.000 155 0.70 0.000 1542 0.87 0.000 155 0.88 0.000 1523 0.48 0.685 155 0.48 0.685
1 Excludes one case for a country area because the Officer could not answer the question. 2 Excludes one case in an urban area because the Officer could not answer the question.
3 Excludes two cases in urban areas and one case in a country area because Officers could not answer the
question.
Table 17(d): Probation and Parole Officer ratings of access to
stable and affordable accommodation
Per cent reporting a ‘fairly big’ problem or
N a ‘very big’ problem p-value
How big a problem for your clients is 155 0.77 .000 the lack of stable accommodation?
How big a problem for your clients is 155 0.81 .000 the cost of stable accommodation?
also said they believed that prospective employers often knew about offenders’ criminal records, particularly in country areas where ‘everyone knows everyone’. Accommodation
Twenty per cent of respondents did not state at the time of the interview what proportion of their clients was looking for stable and affordable accommodation or what proportion of their clients was in stable and/or affordable accommodation. Averaged over all respondents who did answer the question, 67 per cent of offenders were said to be living in stable and affordable accommodation, while 24 per cent were said to be looking for stable and/or affordable accommodation. Some of those said to be looking for stable and affordable accommodation may have been looking for more stable and affordable accommodation.
Disability services
When asked what proportion of their clients with a disability needed assistance, 20 per cent of respondents did not answer the question at the time of the interview, while 33 per cent indicated that none of their clients needed assistance or that they had no offenders with disabilities. Averaged across the remaining respondents, 43 per cent of offenders were said to be in need of assistance. When asked what proportion of clients with disabilities were receiving assistance, 20 per cent of offenders did not answer the question at the time of the interview and 52 per cent indicated that they had no clients with a disability or none needing assistance. The remaining respondents divided into two clear groups. One group
of 40 respondents indicated that all of their clients were receiving some form of assistance. Averaged over the remaining respondents, 47 per cent were said to be receiving some assistance.
Table 17(e) deals with services for offenders with a disability of some kind. Three of the questions dealing with disability services produced response patterns suggesting that the issue in question was a ‘fairly big’ or ‘very big’ problem. The questions involved the lack of services for intellectual disability, the lack of disability services for offenders with an acquired brain injury and the waiting list for disability services. The percentage regarding these issues as a ‘fairly big’ or ‘very big’ problem ranged from 61 per cent (lack of services for
Table 17(d) deals with access to stable and/or affordable accommodation. Note that some respondents had difficulty answering this question because some forms of accommodation are stable but not affordable, while others are affordable but not stable. Judging from the high percentages shown in Table 17(d), the lack of stable accommodation and its cost are issues that Probation and Parole Officers regard as major problems for offender rehabilitation. Comments made by respondents during the course of interview suggested that there is insufficient housing for men in some regional areas (e.g. Tamworth) and insufficient emergency accommodation in others (e.g. Wollongong, Griffith, Campbelltown, Wyong). When
responses to the questions dealing with accommodation were disaggregated by location of respondent, there were no significant differences; however, the contrast between urban and country areas on the cost of accommodation approached significance, with 85 per cent in urban areas identifying accommodation costs as a ‘fairly big’ or ‘very big’ problem compared with 75 per cent in country areas (χ2 = 2.5, df = 1, p = 0.086).
Table 17(e): Probation and Parole Officer ratings of disability services
Per cent reporting a ‘fairly big’ problem orN a ‘very big’ problem p-value
1 Excludes 22 cases in urban areas and 13 cases in country areas, where the Officer could not answer the
question.
2 Excludes six cases in urban areas and eight cases in country areas where the Officer could not answer the
question.
3 Excludes 12 cases in urban areas and seven cases in country areas where the Officer could not answer
the question.
4 Excludes 25 cases in urban areas and 17 cases in country areas where the Officer could not answer the question. It also excludes one case in an urban area and one case in a country area where the Officer
asserted that there were no disability services.
5 Excludes 25 cases in urban areas and 17 cases in country areas where the Officer could not answer the question. It also excludes one case in an urban area and one case in a country area where the Officer
asserted that there were no disability services.
6 Excludes nine cases in urban areas and 11 cases in country areas where the Officer could not answer the question. It also excludes one case in an urban area where the Officer asserted that there were no
disability services.
How big a problem for your clients with a physical disability is the lack of disability services in your geographical area? How big a problem for your clients with an intellectual disability is the lack of suitable disability services in your geographical area? How big a problem for your clients with an acquired brain injury is the lack of suitable disability services in your geographical area? How big a problem for your clients with any disability is the waiting list for disability services?
How big a problem for your clients with any disability is the cost of disability services? How big a problem for your clients is the lack of suitable transport to disability services?
1201 0.51 0.927 1412 0.61 0.011 1363 0.70 0.000 1114 0.64 0.004 1115 0.45 0.343 1336 0.57 0.118 1
offenders with an intellectual disability) to
Table 18: Open-ended comments on services for offenders on
70 per cent (lack of services for offenders
supervised bonds: twenty most frequently mentioned issues
with an acquired brain injury). Responses
to these questions were not significantly N %
associated with the area in which the respondent worked but it must be
remembered that respondents nominating these types of disability were a relatively small group. When respondents were asked for which disability type they found it most difficult to get assistance, the most common responses were acquired brain injury (43.9%) and intellectual disability (35.5%).7
Near the conclusion of the survey, respondents were asked what proportion of their time was spent monitoring offenders who are on supervised bonds, as opposed to referring them and liaising with service providers and whether they had enough time to supervise offenders. The median proportion of time spent monitoring offenders (as opposed to referring them and liaising with service providers) was 60 per cent.8 Sixty-eight per cent of respondents said that they did not have enough time to supervise offenders.9 At the conclusion of the
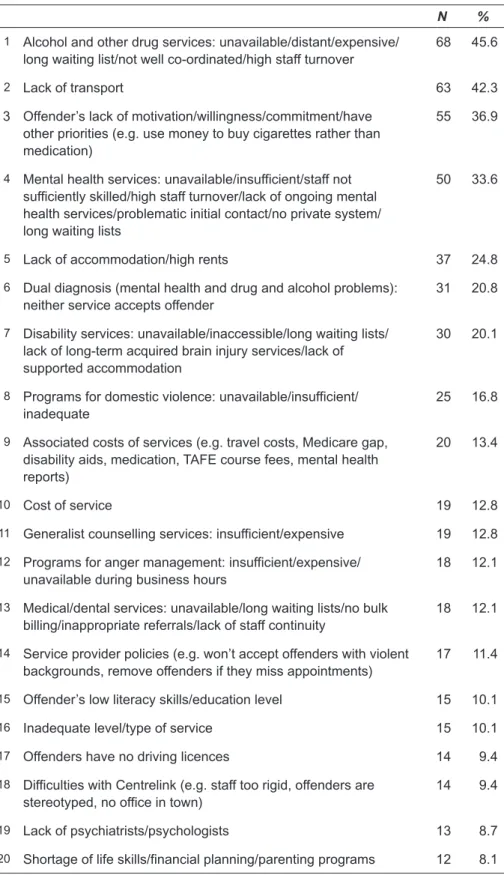
survey, respondents were asked two open-ended questions. The first was whether their clients faced difficulties with other services in their geographical area. The second was whether they had any other comments to make about service provision for their clients. One hundred and forty-nine Officers responded. Their comments were grouped into various thematic categories and then tallied. Table 18 shows the 20 most frequently mentioned issues.
The three most frequently cited problems were lack of access to alcohol and drug treatment services, lack of transport and lack of motivation or commitment [to reform] on the part of the offender.
1 Alcohol and other drug services: unavailable/distant/expensive/ long waiting list/not well co-ordinated/high staff turnover
68 45.6
2 Lack of transport 63 42.3
3 Offender’s lack of motivation/willingness/commitment/have other priorities (e.g. use money to buy cigarettes rather than medication)
55 36.9
4 Mental health services: unavailable/insufficient/staff not sufficiently skilled/high staff turnover/lack of ongoing mental health services/problematic initial contact/no private system/ long waiting lists
50 33.6
5 Lack of accommodation/high rents 37 24.8
6 Dual diagnosis (mental health and drug and alcohol problems): neither service accepts offender
31 20.8
7 Disability services: unavailable/inaccessible/long waiting lists/ lack of long-term acquired brain injury services/lack of supported accommodation
30 20.1
8 Programs for domestic violence: unavailable/insufficient/ inadequate
25 16.8
9 Associated costs of services (e.g. travel costs, Medicare gap, disability aids, medication, TAFE course fees, mental health reports)
20 13.4
10 Cost of service 19 12.8
11 Generalist counselling services: insufficient/expensive 19 12.8
12 Programs for anger management: insufficient/expensive/ unavailable during business hours
18 12.1
13 Medical/dental services: unavailable/long waiting lists/no bulk billing/inappropriate referrals/lack of staff continuity
18 12.1
14 Service provider policies (e.g. won’t accept offenders with violent backgrounds, remove offenders if they miss appointments)
17 11.4
15 Offender’s low literacy skills/education level 15 10.1
16 Inadequate level/type of service 15 10.1
17 Offenders have no driving licences 14 9.4
18 Difficulties with Centrelink (e.g. staff too rigid, offenders are stereotyped, no office in town)
14 9.4
19 Lack of psychiatrists/psychologists 13 8.7
20 Shortage of life skills/financial planning/parenting programs 12 8.1