MSU Agricultural Economics Web Site: http://www.aec.msu.edu MSU Food Security Group Web Site: http://www.aec.msu.edu/fs2/index.htm
MSU is an affirmative-action, equal-opportunity employer MSU International
Development Working Paper No. 111 January 2011
A FARM GATE-TO-CONSUMER VALUE CHAIN
ANALYSIS OF KENYA’S MAIZE MARKETING
SYSTEM
by
Lilian Kirimi, Nicholas Sitko, T.S. Jayne, Francis Karin, Milu Muyanga, Megan Sheahan, James Flock, and Gilbert Bor
by
Author
Department of Agricultural, Food, and Resource Economics Department of Economics
MICHIGAN STATE UNIVERSITY East Lansing, Michigan 48824
MSU INTERNATIONAL DEVELOPMENT PAPERS
The Michigan State University (MSU) International Development Paper series is designed to further the comparative analysis of international development activities in Africa, Latin America, Asia, and the Near East. The papers report research findings on historical, as well as contemporary, international development problems. The series includes papers on a wide range of topics, such as alternative rural development strategies; nonfarm employment and small-scale industry; housing and construction; farming and marketing systems; food and nutrition policy analysis; economics of rice production in West Africa; technological change, employment, and income distribution; computer techniques for farm and marketing surveys; farming systems and food security research.
The papers are aimed at teachers, researchers, policy makers, donor agencies, and international development practitioners. Selected papers will be translated into French, Spanish, or other languages.
Copies of all MSU International Development Papers, Working Papers, and Policy Syntheses are freely downloadable in pdf format from the following Web sites:
MSU International Development Papers
http://www.aec.msu.edu/fs2/papers/idp.htm
http://ideas.repec.org/s/ags/mididp.html MSU International Development Working Papers
http://www.aec.msu.edu/fs2/papers/idwp.htm
http://ideas.repec.org/s/ags/midiwp.html
MSU International Development Policy Syntheses
http://www.aec.msu.edu/fs2/psynindx.htm http://ideas.repec.org/s/ags/midips.html
Copies of all MSU International Development publications are also submitted to the USAID Development Experience Clearing House (DEC) at: http://dec.usaid.gov/
A FARM GATE-TO-CONSUMER VALUE CHAIN ANALYSIS OF
KENYA’S MAIZE MARKETING SYSTEM
by
Lilian Kirimi, Nicholas Sitko, T.S. Jayne, Francis Karin, Milu Muyanga, Megan Sheahan, James Flock, and Gilbert Bor
January 2011
This study represents a joint collaboration between the Tegemeo Institute of Egerton University, ACDI-VOCA, Moi University, and Michigan State University. The study is funded by the Bill and Melinda Gates Foundation under the Guiding Investments in Sustainable Agricultural Markets (GISAMA) Initiative.
Kirimi is a research fellow at the Tegemeo Institute. Sitko and Jayne are research fellow and Professor, International Development, respectively, at Michigan State University (MSU). Karin is a senior research assistant at Tegemeo Institute. Muyanga is a research fellow at Tegemeo Institute. Sheahan is a graduate research assistant at MSU. Flock is an analyst with ACDI-VOCA, and Bor is a senior lecturer at Moi University.
ii ISSN 0731-3483
© All rights reserved by Michigan State University, 2011.
Michigan State University agrees to and does hereby grant to the United States Government a royalty-free, non-exclusive and irrevocable license throughout the world to use, duplicate, disclose, or dispose of this publication in any manner and for any purposes and to permit others to do so.
Published by the Department of Agricultural, Food, and Resource Economics and the Department of Economics, Michigan State University, East Lansing, Michigan 48824-1039, U.S.A.
iii
ACKNOWLEDGMENTS
This study was made possible by a grant from the Bill and Melinda Gates Foundation to Michigan State University, which partnered with Egerton University‘s Tegemeo Institute of Agricultural Policy and Development in carrying out this study. Partners in research and logistical support also include ACDI/VOCA, the Kenyan Ministry of Agriculture, and Moi University. The study builds on over 10 years of investment in longitudinal rural household survey data implemented and managed by the Tegemeo Institute and funded by
USAID/Kenya.
The study has also benefited from information provided by Joshua Ariga, Sophie Walker, Steve Collins, and many representatives of government and private firms involved in Kenya‘s maize value chain. The authors also wish to thank Patricia Johannes for her editorial and formatting assistance. The views expressed in this document are exclusively those of the authors, and do not necessarily reflect the views of any organization involved in carrying out the study.
EXECUTIVE SUMMARY A. Background
Maize is the most important staple food in Kenyans‘ diets, providing roughly a third of the caloric intake for Kenya‘s population. Maize is also the central crop in Kenyan agriculture, being grown by 98% of Kenya‘s 3.5 million smallholder farmers.
Maize marketing and trade policy in Kenya has been dominated by two major challenges. The first challenge concerns the classic food price dilemma: how to keep farm prices high enough to provide production incentives for farmers while at the same time keeping them low enough to ensure poor consumers‘ access to food. The second major challenge has been how to effectively deal with food price instability, which is frequently identified as a major impediment to smallholder productivity growth and food security. In attempting to cope with these interrelated challenges, policymakers have grappled with issues of the appropriate role of the state in marketing and pricing, and the extent to which variable import tariffs and trade controls can promote the achievement of national policy objectives.
A third and as yet inadequately appreciated maize policy challenge, one that is facing the agricultural sector more generally, is the growing problem of access to land and the shrinking size of smallholder farms. Partly as a result of declining landholding sizes in Kenya, most rural farm households have become net buyers of maize. The potential for transforming smallholder farmers from maize buyers into surplus producers is becoming increasingly difficult as population growth and land pressures continue unabated. Over half of the smallholder farms in Kenya are less than 1.5 hectares. In this context, a major, yet
underappreciated, agricultural policy issue is how to achieve broad-based smallholder-led agricultural growth under conditions of increasingly acute land pressures. Identifying the appropriate role and potential of maize intensification in densely populated rural areas is needed to address this important policy question.
B. Objectives
Developing appropriate maize marketing and trade policies in the context of a growing structural deficit in maize and ever shrinking smallholder farm sizes requires a detailed understanding of the structure and performance of Kenya‘s maize value chain.
Understanding how the value chain has developed in turn requires an understanding of the market liberalization process in Kenya, as this has been the major policy thrust affecting the industry over the past 20 years. This study is a follow-up to the Tegemeo study of Kenya‘s maize value chain carried out in the late 1990s by Nyoro, Kiiru, and Jayne (1999). This study, conducted in 2009, describes the operation of Kenya‘s maize value chain two decades after the liberalization process began. A broader objective of the study is to provide a full picture of Kenya‘s maize value chain from the farm gate to the retailing of maize meal to consumers; to assess the competitiveness of maize markets in Kenya; to identify major trends in maize prices, maize meal prices, and marketing margins charged at various stages of the system; and to identify actions by the public sector to overcome production and marketing problems and support the Kenyan government‘s national policy objectives of food security and smallholder-led development.
C. Main Findings at the Farm Level of the Value Chain
1. Land fragmentation and decreasing land-size holdings: One of the major findings of the study concerns farm structure. Most of Kenya‘s smallholder farmers reside in increasingly densely populated rural areas facing major land pressures. Balanced panel data from four survey years (1997, 2000, 2004, and 2007) show that farm sizes in Kenya declined by 15% over the 10-year panel period. About one-third of the smallholder farms nationwide are less than 1.0 hectares in size. There is very little scope for increasing farm production based on increasing the amount of land in smallholder farming areas. Even with major improvements in the performance of the maize value chain, a large percentage of smallholders will continue to be unable to produce a maize surplus that would enable them to link to markets. As rural populations continue to grow (albeit at a slower rate than in earlier decades), access to quality farm land is going to increasingly be a problem that will preclude many rural households from participating as sellers in grain markets, unless there is tremendous growth in food crop yields.
2. A relative decline in the importance of maize as a share of gross farm revenue: Balanced panel data show that households produced roughly the same quantity of maize in each of the four survey years (1997, 2000, 2004, and 2007). Because the inflation-adjusted value per unit of maize declined over this 10-year period, the real value of production declined. The
proportion of households selling maize increased from 35% of households in 1996/97 to 49% in 2006/07. The increased proportion of households selling maize may be partially due to a major rise in the use of fertilizer on maize over the 1997-2007 period, which has contributed to maize productivity gains; 54% of households used fertilizer on maize in 1997 compared to 70% in 2007. Yet the total quantity of maize sales declined by 12% over the same period. This suggests that though a larger fraction of households is selling maize the mean quantities sold per selling household is declining.
3. High degree of differentiation and market concentration within the smallholder sector: Smallholder households included in the nationwide survey can be divided into three groups: (i) the largest smallholder sellers of maize who accounted for 50% of the total marketed maize output; (ii) the remaining households that sold maize during the year who accounted for the other 50% of the marketed output; and (iii) those households that sold no maize during the 12-month marketing season. Data show that 2% of the farms account for 50% of the overall marketed maize surplus from the smallholder sector. These farm households appear to enjoy substantially higher welfare levels, in terms of asset holdings, crop income, and non-farm income, than the rest of the rural population. The relatively elite smallholder farmers had roughly 2 to 6 times as much land and productive assets as the non-selling households, 6 to 9 times more gross revenue from the sale of all crops, and 5 to 7 times as much total household income. This concentration of surplus production and marketing by a relatively few farmers is one of the most important points to be borne in mind when thinking about the effects of policy instruments designed to alter the mean level of food prices. At least in the short run, policies that put upward pressure on maize prices benefit only a small minority of producers, while directly hurting the majority.
4. Evidence of the importance of marketing training on farm income: The prices received by farmers selling maize in the same month and in the same village show a high degree of variability. This variation suggests that marketing savvy – the ability of farmers to negotiate prices and identify buyers – plays a significant role in their ability to obtain remunerative prices for their maize. Marketing savvy is shown to be enhanced through market skills training. Based on price data collected from participants in ACDI/VOCA‘s Kenya Maize
Development Program (KMDP) and from nearby villages where training was not
administered we find that KMDP recipients received 9.9% higher prices on average (22.1 shillings vs. 20.1 shillings per kg). To examine the training effect more precisely, we
regressed these prices on a training dummy variable, distance of the household to the nearest market town and a village dummy to capture spatial price differences. OLS results indicate that the KMDP recipients received, on average, 1.8 shillings per kg more than non-recipients did (a 9.2% price difference), significant at the 5% level.
D. Main Findings at the Middle Levels of the Value Chain
1. Kenya’s introduction into the East African Community has resulted in an improvement in
the regional trade policy environment. Since January 2005, regional maize trade between Uganda, Tanzania, and Kenya has not been subjected to any taxation by the Kenyan government with the exception of a 2.75% inspection fee. A reduction in regional trade barriers is very much in Kenya‘s interests because the country is a food importer and it can generally procure maize more cheaply from its regional neighbors than it can from the world market.
2. With the exception of the 2008-09 crisis period, grain-marketing policies in Kenya have
become more stable over time. The NCPB‘s role in the market has become more clear and
truncated especially since the National Rainbow Coalition (NARC) government took power in 2002. A major source of uncertainty continues to revolve around the timing of changes in import tariff rates, which remain highly unpredictable.
3. The structure of Kenya’s maize market and the relative importance of its various actors change significantly depending on national production levels: In a normal or good year, domestic production from small- and large-scale farmers forms the major source of domestic supply. Smallholder maize sales go largely to small-scale assemblers or brokers, who collect and bulk for onward sale to large wholesalers. Large-scale millers are the next major link in the chain, buying grain primarily from the large wholesalers, the NCPB, and from smaller traders. The large millers sell mainly to a decentralized system of informal retailers (street kiosks, dukas, multipurpose retail shops, and traditional retail markets) and to a lesser extent to the more high-end consumers who shop at supermarkets. Posho millers who operate in retail markets are important players in some areas. Consumers buy grain and pay a fee to custom-mill their grain into posho meal. This option provides the means to produce maize meal relatively inexpensively and is preferred by the urban poor and most rural households, especially in the western parts of the country.
In a year when the main harvest in Western Kenya is poor, the country is more reliant on imports. If supplies can be imported from Uganda and Tanzania, this tends to be the first option pursued by wholesalers and millers because (since January 2005) there are no import restrictions or barriers except for the 2.75% import inspection fee and transport costs, which are relatively low. However, if the required quantities cannot be obtained from the region, Kenya then becomes dependent on the world market. It is at this point that Kenyan
wholesalers and millers lobby for a waiver of the 50% duty on maize imported through Mombasa port. In years when imports constitute a major share of the marketed supplies, the structure of the maize value chain changes considerably. The most significant change is that the marketing channels become more concentrated and less competitive. Import contracts through Mombasa tend to be large volume orders placed by large millers, wholesalers, and the NCPB. Small-scale assemblers, itinerant traders, and small millers in the informal marketing channels are less active in drought years because they depend almost totally on
small-scale farmers for their supplies, most of whom have little to sell during drought years. With grain being scarce in local informal markets during such years, consumers are
increasingly dependent on the large-scale millers (who obtain their supplies from world markets or from the NCPB) for their maize meal. Without competition from the informal milling and retailing sector, large-scale millers and retailers are able to raise their margins, which is economically damaging for poor consumers.
4. Evidence of growing investment in private sector grain assembly and improvements in grain marketing conditions for farmers: Farmer focus group discussions (33) and individual interviews with surplus producing farmers (450) indicate that small-scale farmers have a variety of potential markets through which to sell maize. Of the available options, small-scale assemblers operating at the village level are shown to be the most important market channel utilized by small-scale farmers. One of the most important findings is that in virtually all villages chosen for farmer focus group discussions, including both accessible and
inaccessible areas, the response to the question "how many traders came into this village to purchase maize from farmers in this village" was almost always more than 10. Overall, the most commonly cited number of traders was 100, with about 27% of the responses indicating a number between 15 and 30 and 42% quoting a figure of 50-100. With this many traders purchasing maize in each village, the assembly traders are apparently pushing much deeper into rural areas than the conventional wisdom would indicate. It shows the extent to which the first stage in the system (farmer-assembly trader/first buyer) has developed and become competitive over the years. The growing density of maize assemblers also reflects an increase in the participation of the private sector in the maize trade following liberalization.
Data on the mean distance from the farmers‘ farms to the point of sale of maize also suggests an expansion of private sector maize assembly. Among those farmers interviewed, the mean distance travelled to their initial point of sale was 1.85 km, with 73.1% of the farmers selling their maize at the farm-gate. Therefore, the majority of the traders transact with farmers for grain right in the villages. These results closely mirror the findings based on the 10-year Tegemeo panel data on 1,267 smallholder households to monitor changes in their access to markets and services. Their results showed that between 1997 and 2007, the mean distance from the farm to point of sale of maize declined from 0.9km to 0.5km. This represents a 43% reduction in distance, and reflects an increased density of grain traders in rural areas. Their study also shows that while in 1997, 90% of the households traveled 3.5km or less to the point of maize sale, by 2007, 90% of the households traveled 2 km or less. This reduction in distance to the point of maize sale again suggests that over time maize assembly traders are penetrating deeper into the rural areas and buying maize directly in the villages, and may reflect a growing density of maize traders.
Overall, these results suggest that over the years, there has been greater investment in private grain trading, particularly at the assembly level. Additionally, given the high number of traders operating in the village, these findings imply that access to markets may no longer be defined in terms of distance to point of sale, but rather in terms of the ability of farmers to obtain and negotiate for a remunerative price.
5. As a result of the expansion of private sector marketing options, farmers generally feel that the maize marketing system has improved. Farmers in the 41 focus groups were asked to indicate how the current maize marketing conditions compare to those existing 10 years ago. Nearly 70% of the responses from the FGDs indicated that the marketing conditions had improved, with little variation in terms of responses across the districts.
6. Decreasing importance of NCPB as a market option for farmers: The study found that the National Cereals and Produce Board purchases a relatively small proportion of maize
produced by smallholder farmers. Roughly 3% of the 1,275 farm households contained in the Tegemeo Rural Surveys sold maize to NCPB. Nevertheless, the NCPB appears to play an important role in the market by purchasing large volumes from large-scale farmers and from smallholders in a few major surplus zones such as Trans Nzoia and Uasin Gishu. NCPB tends to increase its purchases in a good production season and reduce its purchases in a poor season to stabilize maize prices (Jayne, Myers, and Nyoro 2008).
7. The performance of the assembly sector of the value chain is highly dependent on the functioning of downstream actors in the value chain, particularly the wholesale sector: The primary market for maize assemblers in Kenya is the wholesaling sector. Fifty-nine percent of the assembler traders interviewed for this report do not store any of the grain they purchase from farmers. The majority of the assembler traders sell quickly to wholesalers bulking up grain in the district towns. They do this mainly due to liquidity constraints: after exhausting their limited working capital buying maize, they cannot buy more until they sell their grain to obtain more working capital. Wholesalers are therefore instrumental for the viability of these assembly traders, because they provide the means for assemblers to quickly sell and obtain fresh working capital to go back into the hinterland and buy more maize from farmers. Without the wholesalers, assembly traders could spend weeks or months with their working capital tied up while waiting for the marketing board or another buyer to pay them.
8. Medium-scale wholesalers play a vital role in Kenya’s maize market by exploiting spatial arbitrage opportunities: In Kenya, where harvest periods vary by region and many major consumption centers are far removed from production areas, spatial arbitrage is critical for mitigating grain price volatility. Wholesalers in Kenya perform this function by acquiring maize from primary assemblers in surplus areas and quickly transporting it deficit regions or to large-scale grain processors. Wholesalers also play a critical role during major deficit years, by acquiring informally imported maize from Uganda and Tanzania, as well as formally imported maize in Mombasa, and bringing it to retail markets in deficit regions. 9. Limited transportation capacity in the country limits the efficiency of maize markets during major import periods: One of the primary bottlenecks to maize imports during high import periods like that experienced in 2009 is transport access from the warehouses in Mombasa to Nairobi. When imports are concentrated within a short period when the import tariff on maize is waived, the demand for transport can outstrip supply, contributing to maize shortages in inland areas and maize prices rising well over the cost of importation. If
imported maize requirements could be spaced over a longer period by waiving the import tariff earlier, this would relieve transport capacity constraints and reduce the likelihood of shortages in upland markets.
10. Contrary to the perceived wisdom that a lack of adequate storage facilities limits the ability of farmers, traders, and processors to store grain, we find that limited storage is not due to insufficient storage facilities but is primarily caused by disincentives for traders to store grain. The study found an apparent contradiction of very little seasonal storage occurring despite a great deal of storage space in the country available for rent. Interviews with traders indicate that the problem is not inadequate storage facilities but inadequate incentives to store due to very high risks, constraints on borrowing capital (again related to high risks as perceived by banks and other lenders), and the features of the East African grain market in which supplies from Uganda, Tanzania, and indeed parts of Kenya are coming on the market at various times of the year, which can put downward pressure on prices and
hence affect the returns to storage. Certain behaviors by the government, most notably the sudden changes in the import tariff rates on maize imports through Mombasa as well as sudden changes in the NCPB‘s maize selling price, exacerbate the risks of storing grain. These disincentives to storage contribute to a circuitous flow of maize out of surplus areas during harvest periods, only to move back in once deficits set in. More generally, the
disincentives for traders to store grain tends to depress prices right after harvest and (because relatively little is stored through the season) less is available for consumption later in the season which raises prices more during these periods. In order to drive down the price of maize grain and meal to rural and urban consumers, there is a need to address the
disincentives to on-farm and trader storage.
E. Main Findings at the Consumer Level of the Value Chain
1. Consumer data indicates the growing importance of wheat in consumers‘ diets,
particularly among more affluent consumers: The importance of maize in urban staple grain diet is shown to have declined by 22% from 58% share in staple food in 1995 to 45% in 2003. Maize accounted for 59 and 38% of the staple carbohydrate consumption among the 20% poorest and richest households, respectively. Therefore, maize still remained the dominant staple food among the urban poor. However, the richer urban households who are in the top 40% of the income distribution consumed more wheat than maize. Over time, the consumption of wheat products had grown, particularly among these higher income groups, with its share rising by 17% from 25% in 1995 to 31% in 2003. In addition, among the urban respondents, wheat consumption accounted for 22 and 38% of the staple food consumption of the 20% poorest and richest households, respectively. By 2003, wheat was the dominant staple in terms of expenditure, accounting for 43.5% of total expenditures on the main staples compared to 32.4% of maize‘s contribution, which had declined from 41.8% in 1995.
However, expenditures on maize products exceeded those on wheat only for households in the bottom two-income quintiles (40% of the poorest households in Nairobi), but wheat dominated expenditures for the top three income quintiles.
2. Market channels for acquiring maize vary across income groups: The consumption of posho meal has declined in Kenya, but remains very important for relatively poorer
households. This was attributed to a decline in the price difference between sifted meal and posho meal perhaps resulting from greater competition in the milling sector due to the maize market liberalization. The liberalization of the maize market led to the development of many small-scale posho mills which provided great competition for the large-scale millers. In response to this, the large millers reduced the degree of flour refinement in order to cut down their costs. Consequently, the prices of maize meal have declined, thus reducing the price difference between the posho and sifted meal. This shift in maize meal consumption patterns may have led to a decline in the market share of the posho millers, which was high in the period immediately following liberalization.
The majority of the households (64%) in the poorest income quintile prefer duka/shops, spending Ksh105 million in a month on this channel (Table 18). Open markets are the next most important means by which the poorest consumers obtain staple products, accounting for 14% of their expenditures. Among the second poorest income group, the most important retail outlets are dukas/shops, roadside kiosks, small supermarkets, and markets. Only among the top income quintile did national supermarkets account for more than 20% of total
duka/shops accounted for 38% of expenditures on the top four staples, while the national supermarkets accounted for 37%.
F. Main Findings Regarding Maize Prices and Market Margins
1. Price margins at multiple stages of the value chain are low and declining: Low price margins signal that farmers are receiving a higher proportion of the final consumer price of maize meal over time. We also find that consumers are benefiting from lower retail maize meal prices. Between the early 1990s and 2008, the kilograms of maize grain and meal that was affordable with a daily wage has been rising steadily for the various employment sectors for which data is available. Low marketing margins at this stage in the value chain suggest competition among grain assembly traders in rural areas, a point corroborated through farmer focus group discussions.
2. Spatial price margins between surplus and deficit regions are also low. Wholesale prices in surplus areas are in the range of 90-95% of the prices in the main deficit market of Nairobi. The remaining 5-10% is the portion of the wholesale maize price extracted by traders and transporters between surplus areas and Nairobi.
3. Finally, the price margins between wholesale grain and retail maize meal have declined significantly. After adjusting for inflation, there has been a highly statistically significant decline in maize milling and retailing margins by Ksh 0.068 per kg per month between 1994 and 2008, or roughly Ksh 12,000 per ton (roughly US$180) over this 15-year period. The reason for the decline in milling and retailing margins over time is associated with a
substantial increase in competition at both the milling and retailing stages of the value chain in urban Kenya. An increase in the number of millers and retail outlets has forced price competition to maintain their market share. By putting downward pressure on marketing margins and retail maize meal prices, maize market liberalization has conferred important benefits for maize consumers in Kenya.
G. Main Findings Regarding Trade Policy
1. Uncertainty over government behavior with respect to decisions on import tariff rates as well as the NCPB pricing and marketing operations continue to stifle private investment in maize markets: Massive food price rises in 2008 were the direct result of a combination of factor, which can be linked to uncertainty over government intervention in maize markets, including the role of NCPB in maize imports, delays in the removal of maize tariffs, and transport bottlenecks between Mombasa and Nairobi. This price rise could have been avoided if rules governing government intervention in the maize market were clearly spelled out.
H. Conclusions and Implications for Policy
Based on the findings of this study, the following actions are proposed for consideration by the Government of Kenya:
1. Raise public investment in maize seed breeding and agronomic research to make it
possible for improvements in smallholder crop productivity. Based on research evaluating the returns to alternative investments in agriculture, public expenditures in maize seed breeding
and agronomy may constitute the single most important investment to promote broad-based productivity growth and poverty reduction in Kenya.
2. Explore options for improving public and private extension programs to enable farmers to adopt improved farm technologies generated from point 1.
3. Examine options for bringing more land in Kenya under potential cultivation by
smallholder farmers. Unless the land constraints in currently densely populated rural areas of Kenya are relieved, it is unlikely that a large portion of farmers in Kenya that own less than one hectare will be able to rise out of the semi-subsistence conditions that keep them trapped in poverty.
4. Support training programs to enable smallholders to develop more effective marketing strategies and to negotiate more effectively with traders, in order to raise the prices that they receive for their maize.
5. Raise public investment in road, rail, and port infrastructure to reduce marketing costs as well as the cost of modern inputs such as fertilizer to the farm gate. Rehabilitating the Kenyan railway system would be a key priority. If this were done prior to 2009, maize imports could have arrived in greater volumes much faster in early 2009 and pushed food prices down faster.
6. When early warning estimates predict a need for large import quantities, remove the import tariff soon enough to allow traders to import over a sufficiently long period to avoid transport capacity constraints and domestic stockouts.
7. Review the rationale for denying import licenses when applied for by traders.
8. Consider the costs and benefits from the standpoint of governments of transitioning from discretionary trade and marketing policy to adherence to more systematic rules-based
policies. Nurturing credible commitment in regard to trade policy is likely to promote market predictability and therefore, lead to greater supplies and price stability in food markets during times of domestic production shortfalls.
9. Consider whether current proposals for international stockholding would be effective in the presence of domestic transport capacity constraints. International physical or financial reserves would not be able to relieve localized food production shortfalls unless local transport capacity is adequate to absorb sufficient imports within a concentrated period or unless import licenses are provided or the state carries out or contracts for the importation from the international stock source.
TABLE OF CONTENTS ACKNOWLEDGMENTS ...iii EXECUTIVE SUMMARY ... v LIST OF TABLES ...xv LIST OF FIGURES ...xv ACRONYMS ... xvii 1. INTRODUCTION ... 1
2. ANALYTICAL FRAMEWORK, METHODS, AND DATA ... 3
2.1. Value Chain Analysis ... 3
2.2. Data ... 4
2.2.1. Sampling of Farmers and Data Collection Methods ... 5
2.2.2. Sampling Strategies for Primary Assemblers and Data Collection Methods... 7
2.2.3. Sampling Strategies for Maize Wholesalers and Data Collection Methods .... 7
2.2.4. Sampling Strategies for Small-Scale Maize Mills (Hammer Mills) and Data .. Collection Methods ... 8
2.2.5. Sampling Strategies for Large-Scale Grain Processing and Trading Firms and Data Collection Methods ... 8
3. AN OVERVIEW OF MAIZE MARKETING IN KENYA ... 9
3.1. Main Production and Consumption Patterns and Trends ... 9
3.1.1. Wheat and Rice ... 11
3.1.2. Potatoes and Cooking Bananas ... 11
3.2. The Evolution of the Maize Marketing Liberalization Process in Kenya ... 12
3.2.1. The 2008/09 Food Price Crisis ... 17
3.2.2. Cross-Border Maize Trade and Regional Trade Policy ... 18
3.2.3. Summary ... 19
4. ORGANIZATION OF THE MAIZE VALUE CHAIN ... 21
4.1. Overview of Kenya‘s Maize Value Chain ... 21
4.2. Farmers ... 24
4.2.1. Characteristics of Maize-producing Households ... 24
4.2.2. Net Buyer/net Seller Status of Smallholder Farmers ... 31
4.2.3. Maize Marketing Channels for Farmers... 33
4.2.4. On-farm Storage Issues ... 39
4.2.5. Farmers‘ Perceptions of the Major Problems with Selling Maize ... 41
4.2.6. Farmers‘ Perceptions of Maize Marketing Conditions and Welfare... 41
4.2.7. Access to Market Information ... 42
4.3. Assembly Traders ... 42
4.3.1. Brokers ... 44
4.3.2. Local Assemblers ... 44
4.4. National Cereals and Produce Board (NCPB) ... 45
4.5. Wholesalers ... 46
4.5.1. Wholesalers‘ Storage Behavior ... 50
4.6. Nyamakima Wholesale Market ... 50
4.7. Large-scale Millers ... 51
4.8. Small-scale Posho Millers ... 53
4.9. Consumers ... 54
4.9.1. Consumers‘ Use of Alternative Marketing Channels for Primary Staple Products ... 55
5. MAIZE PRICES AND MARKETING MARGINS ... 58
5.1. Margins between Farm-gate and Wholesale Maize Grain Prices ... 58
5.1.1. Differences in Farm-gate Prices Reported by Farmers ... 60
5.2. Margins between Rural Surplus Wholesale and Urban Deficit Wholesale Maize Prices ... 61
5.3. Margins between Maize Grain and Processed Maize Meal ... 62
5.3.1. Summary ... 64
6. CONCLUSION AND POLICY IMPLICATIONS ... 65
6.1. Summary of Main Findings ... 65
6.2. Alternative Visions of the Role of Government in Maize Markets ... 67
6.2.1. Model 1: State Role Confined to Provision of Public Goods to Strengthen Markets ... 68
6.2.2. Model 2: Rules-based State Interventions to Stabilize Market Activity ... 68
6.2.3. Model 3: Discretionary State Intervention to Provide State with Maximum Flexibility to Achieve State Policy Objectives ... 68
6.3. Implications for Government Actions to Improve the Performance of Maize Markets in Kenya ... 69
6.3.1. Trade Policy Issues... 70
6.3.2. Concrete Guidance ... 72
LIST OF TABLES
1. Description of Rural Districts and Sample Sizes of Interviewed Marketing Agents ...5
2. Importance of Staple Foods in Diet in Kenya ...9
3. Production and Trade of Food Staples in Kenya, 2005-2007 ...10
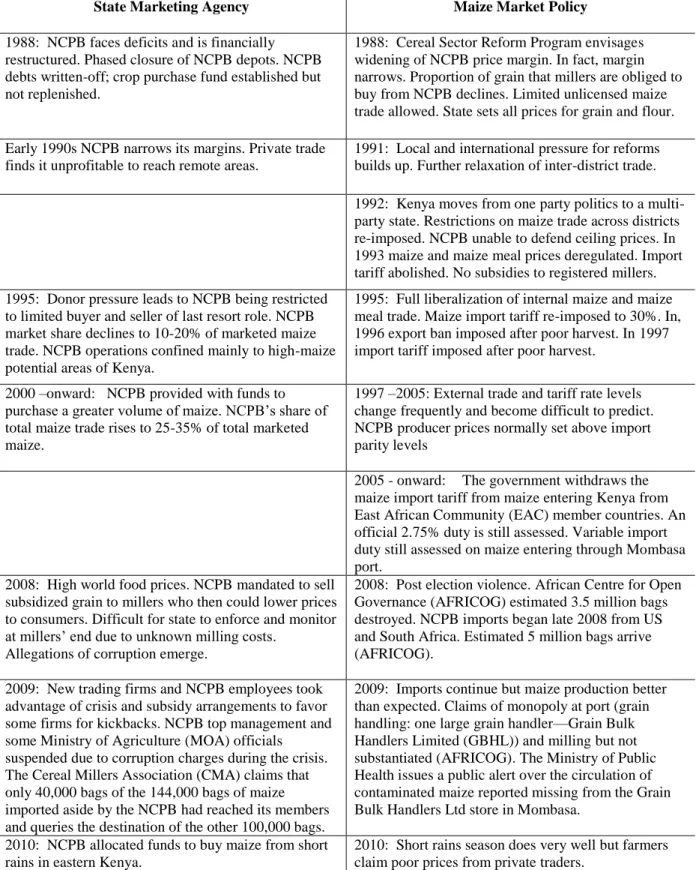
4. NCPB Maize Trading Volumes and Price Setting, 1988/89 to 2009/10 ...15
5. Evolution of Maize Market Policy Reforms, 1988-2010 in section 3 ...16
6. Production Income Shares in the Small- and Medium-Scale Farming Sector, Kenya, 1,275 Households ...25
7. Farm Production Patterns of Small- and Medium-Scale Agricultural Households in Kenya – Shillings Reflated to 06/07 real value ...26
8. Contribution to Total Gross Farm Sales Revenue of Selected Enterprises, by Zone for Different Marketing Years ...28
9. Attributes of Different Categories of Smallholder Farmers According to Maize Sales Status, for Various Marketing Years (Constant 2007 Kenyan Shillings) ...30
10. Household Characteristics According to Position in the Maize Market, Nationwide Sample of Small-scale Households in Kenya, Pooled Data, 1997, 2000, and 2004 ...32
11. Household Maize Market Position for the 2006/2007 Production Season by Agro-Ecological Zone ...33
12. Frequency of the Type of Buyers Purchasing Maize from Farmers Interviewed in the Focus Group Discussions (N=450), Stratified by Accessible Vs. Remote Villages ...35
13. Average Price per Kilogram of Maize through Different Market Channels ...38
14. Mean Maize Selling Price for Farmers Receiving vs. Not Receiving Marketing Training, Kenya, May/June 2009 ...39
15. Proportion of Maize Sold by Wholesalers within and outside the Districts ...47
16. Percentage of Maize Sales by Medium-scale Wholesalers to Different Buyers by District ...48
17. Percentage of Maize Sales by Medium-scale Wholesalers to Different Buyers from March-May 2009 ...49
18. Consumer Expenditures (Ksh Millions) and Market Share (%) of Alternative Retail Channels for Primary Staple Products (Maize, Wheat, Rice, and Cooking Banana Products), by Income Group, 2003 ...56
LIST OF FIGURES 1. Net Grain Exports, Kenya, 1975-2007 ...10
2. Nairobi Local and Import Parity Prices, January 2006-August 2009 ...17
3. Maize Import Tariff Rate through Mombasa Port, Kenya, 1994-2009 ...18
4a. Maize Marketing Channel Diagram: Typical Year of Small National Maize Deficits...22
4b. Maize Marketing Channel Diagram: Major National Deficits - Less Typical. ...23
5. Frequency of Maize Traders Operating in the Visited Villages by Accessibility ...36
6. Proportion of Maize Sold to Different Buyers by District ...37
7. Frequency of Maize Prices Received by Farmers in Trans Nzoia District in May 2009 ...38
8. Percentage of Farmers Storing Maize for at Least 4-5 Months after Harvest in Accessible and Inaccessible Villages, 2009 ...40
9. Alternative Retail Channels for Sifted Maize Meal, 2003 ...56
11. Farm-gate Prices in Accessible Villages in Nakuru District vs. Wholesale
Nakuru ...60
12. Farm-gate Prices in Remote Villages in Nakuru District vs. Wholesale Nakuru ...60
13. Farm-gate Prices in Accessible Villages in Trans Nzoia vs. Wholesale Eldoret ...60
14. Farm-gate Prices in Remote Villages in Trans Nzoia vs. Wholesale Eldoret ...60
15. Wholesale/Farm-gate Prices in Eldoret Compared to Nairobi ...62
16. Wholesale/Farm-gate Prices in Nakuru Compared to Nairobi ...62
17. Price Trends for Retail Sifted Maize Meal and Wholesale Maize Grain in Nairobi, Kenya ...63
18. Trend in the Difference between Maize Wholesale Prices and Sifted Flour Retail Prices in Nairobi, 1994 to 2008 ...63
ACRONYMS
ACDI-VOCA Agricultural Cooperative Development International/Volunteers in Overseas Cooperative Assistance
AFRICOG African Centre for Open Governance CMA The Cereal Millers Association
COMESA Common Market for Eastern and Southern Africa
CPI Consumer Price Index
CRF Clean Report of Finding
EAC East African Community
FGDs farmer focus group discussions GBHL Grain Bulk Handlers Limited
GISAMA Guiding Investments in Sustainable Agricultural Markets Initiative
GoK Government of Kenya
KBS Kenya Bureau of Standards
KMDP Kenya Maize Development Program
Ksh Kenyan Shilling
MOA Ministry of Agriculture
MSU Michigan State University
MT metric tons
NARC National Rainbow Coalition
NCPB National Cereals and Produce Board NFMP National Food and Nutrition Programme
OLS Ordinary Least Squares
SED Single Entry Document
1. INTRODUCTION
Maize is the most important cereal crop in Kenya. It forms an important part of the food and feed system, and contributes significantly to income generation for rural households. It is the main staple food for the people of Kenya, providing more than a third of the caloric intake. Maize is also the primary ingredient used in animal feeds in Kenya, accounting for over 80% of feed rations. In terms of land usage, maize accounts for about 56% of cultivated land in Kenya. About 98% of the 3.5 million small-scale farmers in Kenya are engaged in maize production. The small- and medium-scale sector produces about 75% of the nation‘s maize crop, while the large-scale sector (farms over 25 acres) produce the other 25%. On average, in the last five years, 1.8 million hectares are planted to maize annually, with annual
production ranging between 26 and 36 million bags (2.3 and 3.3 million metric tons (MT)) depending on weather and market conditions. National maize consumption is about 37 million bags (2.9 million MT) annually. Shortfalls in production are met through imports from Uganda, Tanzania, and the world market. Yet, despite the centrality of maize to the Kenyan food system, the country has for the last several decades been trending toward a structural deficit in maize. Effectively coping with recurrent maize deficits is critical for enhancing food security in Kenya and promoting economic growth in the smallholder farmer sector.
Maize marketing and trade policy in Kenya has been dominated by two major challenges. The first challenge concerns the classic food price dilemma: how to keep farm prices high enough to provide production incentives for farmers while at the same time keeping them low enough to ensure poor consumers‘ access to food. The second major challenge has been how to effectively deal with food price instability, which is frequently identified as a major impediment to smallholder productivity growth and food security. In attempting to cope with these interrelated challenges, policymakers frequently rely on the use of state-run maize marketing boards to procure and distribute maize, tariffs on maize imports and exports, and bans on informal cross border trading.
A third and as yet inadequately appreciated maize policy challenge, one that is facing the agricultural sector more generally, is the growing problem of access to land and the shrinking size of smallholder farms. Partly because of declining landholding sizes in Kenya, most rural farm households have become net buyers of maize. The potential for transforming
smallholder farmers from maize buyers into surplus producers is becoming increasingly difficult as population growth and land pressures continue unabated. Over half of the smallholder farms in Kenya are less than 1.5 hectares. In this context, a major, yet
underappreciated, agricultural policy issue is how to achieve broad-based smallholder-led agricultural growth under conditions of increasingly acute land pressures. Identifying the appropriate role and potential of maize intensification in densely populated rural areas is needed to address this important policy question.
Developing appropriate marketing policies in the context of a growing structural deficit in maize and ever shrinking smallholder farm sizes requires a detailed understanding of the structure and performance of Kenya‘s maize value chain. Understanding how the value chain has developed in turn requires an understanding of the market liberalization process in Kenya, as this has been the major policy thrust affecting the industry over the past 20 years. Kenya‘s maize market liberalization process started in the late 1980s and intensified in the early 1990s, as a strategy to increase marketing efficiency and stimulate economic growth. Nearly two decades after the liberalization of maize marketing in Kenya, debate continues about the extent to which the private sector is meeting the needs of farmers and consumers
and the appropriate role of government in the maize market. It was expected that liberalization would bid up maize producer prices, induce new entry by private traders, improve smallholders‘ access to markets, and so induce greater production and input
intensification. The removal of maize movement controls during liberalization was expected to improve trade between surplus and deficit areas, reduce transaction costs, and make maize more available for purchase across the country with more intra- and inter-regional trade. Market liberalization was also anticipated to promote competition in trade and milling and hence reduce marketing margins between retail sifted flour and wholesale maize grain and between surplus and deficit areas. This study assesses the extent to which these intended changes have occurred.
This study is a follow-up to the Tegemeo study of the maize value chain in the late 1990s by Nyoro, Kiiru, and Jayne (1999). This study, conducted in 2009, is intended to provide an evidence-based description of the operation of the maize marketing system in Kenya two decades after the liberalization process began. Therefore, the study provides a useful
comparison on the changes identified 10-years earlier by Nyoro, Kiiru, and Jayne (1999) and informs how the maize marketing system has evolved since that time as the market has been progressively liberalized.
The broader objective of the study is to provide a full picture of Kenya‘s maize value chain from the farm gate to the retailing of maize meal to consumers, to assess the competitiveness of maize markets in Kenya, and to identify actions by the public sector to overcome
production and marketing problems and support the Kenyan government‘s national policy objectives of food security and smallholder-led development. The specific objectives are to:
1. Undertake a detailed organizational mapping of the maize marketing system and document how it has changed over time;
2. Identify the structure, behavior, and other key characteristics of the players along the value chain;
3. Examine trends in maize grain (domestic and import parity) and meal prices in various markets/towns and marketing margins of chain players;
4. Identify the main barriers to entry and expansion for players at various stages in the value chain;
5. Assess whether intended changes in the maize marketing system due to liberalization have occurred; and
6. Consider the policy and programmatic implications for the Government of Kenya. The remainder of the paper is organized as follows. Section 2 describes the conceptual framework and data. Section 3 presents an overview of maize production and consumption trends in Kenya and describes the evolution of the maize marketing liberalization process in Kenya. Section 4 describes the organization of the maize marketing chain from the farm-gate to the consumer based on in-depth interviews of marketing participants and surveys on farmer and consumer behavior. Section 5 analyzes trends in maize prices, farm-gate to
wholesale price spreads, and maize-maize meal marketing margins. Section 6 summarizes the main findings of the study and their implications for policy actions by government.
2. ANALYTICAL FRAMEWORK, METHODS, AND DATA 2.1. Value Chain Analysis
As a product moves from the producer to the consumer, a number of transformations and transactions take place along a chain of interrelated activities, and value is added successively at each stage of the chain. The term value chain is used to characterize the set of
interconnected and coordinated links and linkages that take place as a product moves from the primary production unit to the final consumer. Kaplinsky and Morris (2001) define the chain as the full range of activities that are required to bring a product from conception, through the intermediary stages of transformation, delivery to final consumers, and final disposal after use.
Production, processing, and distribution of agricultural products are increasingly being organized into value chains, where flows of inputs, products, financial and information resources take place among farmers, processors, retailers and other economic actors. Value chains do not evolve in a deterministic process, but adapt and respond to local conditions, the policy and institutional environment, market power, and consumer preferences, among other things. Some of these factors shaping value chain evolution may not be optimal from a social welfare standpoint. The aim of value chain analysis, therefore, is to analyze the organization and behavior of all the participants in the value chain, to diagnose the constraints and
problems that they face, and to identify public actions that may enhance the performance of the value chain and contribute to national policy objectives. It is recognized that the meaning of ―performance‖ and ―national policy objectives‖ may vary, sometimes greatly, among different groups and stakeholders in society. Strategies and policy changes broadly
considered to promote value chain performance and national policy objectives may adversely affect some stakeholders. This report identifies particular strategies spelt out in the last section of this report after consideration of their broad effects on the following national policy objectives: consumers‘ access to food, national food security, reduced and more stable consumer prices, increased and more stable farm-gate prices, improvements in smallholder-farm incomes, and a reduction in the costs incurred by the Government of Kenya in achieving these objectives.
Value chain analysis recognizes that different arrangements of actors may affect outcomes along the chain by influencing capabilities and levels of bargaining of the actors. Hence, the analysis focuses on institutional arrangements that link producers, processors, marketers, and distributors, recognizing that power differentials among them may influence outcomes along the chain. The analysis can be useful in:
creating a shared vision among chain participants with regard to challenges and opportunities, hence facilitating the development of collaborative relationships; promoting enterprise development;
enhancing food quality and safety;
determining the quantitative measurement of value addition and understanding of the distribution of returns amongst the various players;
promotion of coordinated linkages among producers, processors and retailers; and improvement of an individual firm‘s competitive position in the market place.
The methodology specifically involves:
Identifying the outline of the chain and the position of the various economic agents within it–all who contribute to production, transformation and marketing of a specific product;
Identifying the roles and functions of these agents, including those who perform multiple roles;
Grouping agents into categories which are homogeneous from the point of view of economic, technical and/or socio-economic analysis;
Showing interactions among agents;
Quantifying the flows corresponding to the activities of the actors both in physical and monetary terms;
Mapping key policies and institutions along the value chain that influence the functioning of the chain; and
Establishing key drivers, trends, and issues affecting the value chain and it actors. Understanding how the maize sub-sector can become more competitive requires a systemic view of the markets, and the participants that comprise them. Improving the competitiveness of the sub-sector in a meaningful way requires a framework that examines the fabric of relationships between participants in the sub-sector to identify and prioritize the opportunities and constraints to improving industry competitiveness.
2.2. Data
This study used four kinds of data: (i) interviews of maize assemblers, wholesalers, retailers, and millers; (ii) farmer focus group discussions in four maize-surplus producing regions and two maize-deficit regions; (iii) panel data from the Tegemeo Institute/Michigan State
University rural household surveys; and (iv) maize production, consumption, and price information from the Ministry of Agriculture and Food and Agricultural Organization of the United Nations.
Regarding data sources (i) and (ii), interviews were conducted in May, June, and September 2009 from a range of actors in the maize marketing system through farmer focus group discussions and key informant interviews. The data were collected by two separate research teams and included collaborators from Tegemeo Institute, Michigan State University, Moi University, and ACDI-VOCA. Research was primarily conducted in six districts: Nakuru, Trans Nzoia, Kisii, Bomet, Bungoma, and Machakos1. These districts were selected due to the centrality of maize production as a livelihood strategy to farmers, while also including both maize surplus and deficit districts. Generally speaking, Machakos and Kisii are maize deficit regions, while Bomet, Nakuru, Trans Nzoia, and Bungoma tend to be surplus regions.
Structured survey instruments were prepared prior to this fieldwork, based on a previous value chain study conducted in Malawi in October 2008 (following Jayne et al. 2010b). Separate instruments were prepared for the various key actors in the maize value chain including farmers, primary assemblers, small- to medium-scale wholesalers, small-scale maize millers, retailers, and large-scale traders and millers. These survey instruments were designed to explore, in a rigorous way, the structure, conduct, and behavior of Kenya‘s maize market. Yet, structured survey instruments often fail to capture the diversity and market flexibility exhibited by many market actors. For example, many people who act as maize assemblers during the harvest period become maize retailers, providing maize directly to local consumers, as scarcities set in. Additionally, due to the agro-ecological variability in Kenya, many wholesalers and primary assemblers lack a central location from which they operate. Instead, they continuously move around the country, sourcing maize in surplus areas and transporting it to deficit areas. Thus, structured questions specific to their home districts may not be relevant to their operations. Because of this diversity, we combined the structured survey instruments with semi-structured interviews questions, which seek to explore in detail the specificity of an individual‘s experiences and business operations.
For the purpose of this study, specific regions/districts within the country were identified purposively as sites for analysis as shown in Table 1. The criteria for the selection of districts were the following:
1. Maize is the primary crop grown in local farming systems. This selection criterion ensured that multiple actors in the value chain, including producers, assemblers, and wholesalers could be interviewed within a single region; and
2. The major maize surplus-producing districts were purposively selected as well as at least two deficit districts in each country, to explore variations in the marketing behavior of actors operating within high surplus and low surplus/deficit regions.
In addition to the research conducted in rural districts, interviews were conducted with key informants, such as owners of large-scale milling companies, grain trading firms, or government officials.
2.2.1. Sampling of Farmers and Data Collection Methods
Within each region of analysis, villages were identified and focus group discussions conducted with farmers using a semi-structured survey instrument. Farmer surveys were conducted in a focus group format in order to better understand maize marketing issues within a given region, rather than the experiences of only a few individuals. We hypothesize that relative isolation from urban markets plays a critical role in farmers‘ ability to participate
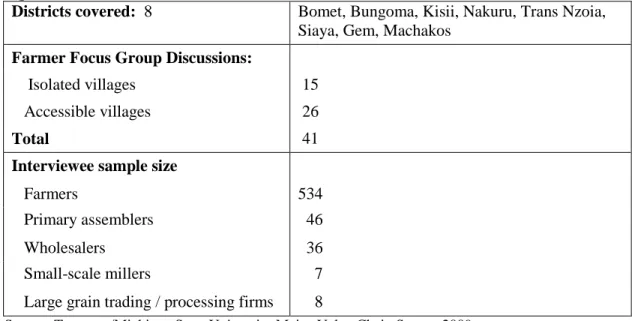
Table 1. Description of Rural Districts and Sample Sizes of Interviewed Marketing Agents
Districts covered: 8 Bomet, Bungoma, Kisii, Nakuru, Trans Nzoia,
Siaya, Gem, Machakos Farmer Focus Group Discussions:
Isolated villages 15
Accessible villages 26
Total 41
Interviewee sample size
Farmers 534
Primary assemblers 46
Wholesalers 36
Small-scale millers 7
Large grain trading / processing firms 8
Source: Tegemeo/Michigan State University Maize Value Chain Survey 2009.
Note: While 41 FGD‘s were carried out in nine districts among 534 small-scale farmers, for the majority of the subsequent analysis farm-level data collected in Siaya and Gem districts were excluded because of late data entry and integration with the information from other districts. Therefore, most of the farmer analysis relies on data collected from 33 villages in six districts with 450 farmers.
in the maize market. To test this hypothesis, we conducted focus group discussions in villages considered isolated from markets and villages considered accessible to markets. Obviously, this distinction is open to subjective interpretation. For example, a village located a long distance (more than 30 km) from a tarmac road may not in fact be isolated if it is still in close proximity to a rural market that is regularly serviced by transportation services. Villages were categorized as isolated or accessible based on several criteria: proximity to a rural market center, distance from tarmac roads, conditions of the roads, the opinion of farmers
interviewed, and the opinion of the district agricultural officer. To assist us in locating villages that met our sampling criteria, we sought the advice of district agricultural officers. Additionally, we identified villages with the help of Tegemeo Institute, which has collected baseline data in several villages within our sample districts since 1997, as well as villages that are currently enrolled in ACDI-VOCA‘s Kenya Maize Development Program (KMDP). While purposively sampling villages that have been enrolled in programs designed to improve farmers‘ knowledge of and performance in maize markets – such as those involved in the KMDP – makes the data non-random, it does perform an important comparative function. By sampling villages that have been exposed to marketing programs and nearby villages with similar characteristics that have not, we are able to measure the impact of these programs on prices received by farmers for maize. This has implications on possible
recommendations for future interventions. The data contains 17 villages that received training and 16 nearby villages that did not receive training.
Several sampling criteria informed the villages selected for focus group discussions:
1. villages had to contain a relatively high number of surplus maize producers, in order to ensure that focus group participants could provide insights into local maize marketing issues; and
2. villages were then stratified based on their relative isolation and accessibility from regional maize markets. This was done in order to provide empirical data on the differences in marketing behavior and structure between villages with varying degree of market accessibility.
Within each village, 10-15 farmers were selected to participate in the focus group discussion. These farmers were selected because they were self-identified as maize farmers who sold maize. Farmer surveys were conducted in two parts. The first section involved focus group discussions. This section sought to explore the conduct and behavior of maize farmers in that village. In the second section of the farmer survey, focus group participants were surveyed individually in order to collect specific maize marketing data from farmers. In this case, data were collected about individual farmer‘s maize sales, timing of these sales, buyer type, distance traveled to the sales point, and the mode of transport used when applicable.
2.2.2. Sampling Strategies for Primary Assemblers and Data Collection Methods
Primary assemblers represent the next link in the regional maize value chain. By our
definition, primary assemblers are private sector maize buyers who buy the majority of their stocks directly from farmers. The primary assemblers interviewed for this research were identified in two ways. First, during the course of the farmer focus group discussions farmers were asked to identify by name 5-6 primary assemblers who regularly service their village. Often times, these assemblers were local residents, while in other cases the assemblers lived outside of the community. Second, assemblers were sampled randomly at rural and peri-urban market areas or along the side of the road where they were buying maize.
A semi-structured survey instrument was used to collect marketing data from primary
assemblers. This instrument explores the buying and selling practices of primary assemblers, their relationships with other actors in the value chain, the constraints they face in developing and expanding their business, and the risks they perceive in the marketing system. In total, 46 primary assemblers were interviewed for this research.
2.2.3. Sampling Strategies for Maize Wholesalers and Data Collection Methods
By our definition, maize wholesalers are private sector maize buyers who buy the majority of their stocks from primary assemblers. We generally found two different kinds of wholesalers in the markets, differentiated by their scale: district-level wholesalers vs. large multi-district and multi-country traders that are discussed in Section 4.5. District-level maize wholesalers interviewed for this report were identified in several ways. First, several wholesalers were identified during the course of interviews with large-scale processing and trading firms. These wholesalers generally source maize in a limited number of districts (they may primarily operate in one district where they live and have built up close connections with farmers in this district) and supply maize for the larger trading and processing firms through formal or informal contracts. Second, district-level wholesalers were identified and
interviewed during regional market days, where truckloads of maize are brought to the market by wholesalers to be sold to local maize retailers. Third, in some regions wholesalers own retail shops, from which they conduct their maize trading business. These wholesalers were identified with the assistance of local community members, such as primary assemblers, agricultural extension officers, and farmers.
Data from district-level wholesalers were collected through semi-structured interviews. These interviews sought to explore the buying and selling practices of wholesalers, their
relationships with other actors in the marketing chain, the constraints they face in expanding and maintaining their businesses and the risks they perceive in the maize marketing system.
2.2.4. Sampling Strategies for Small-Scale Maize Mills (Hammer Mills) and Data Collection Methods
Generally, small-scale hammer mills are local grain processing businesses that provide rural communities and the urban poor with a means for grinding their own maize stocks. The small-scale mills interviewed for this report were identified in several ways. First, when possible mill owners were interviewed following farmer focus group discussions. Second, mill owners in rural and peri-urban market areas were interviewed. Third, millers in urban areas, who provide maize milling services to the urban poor, were interviewed where possible.
Data from hammer mill owners were collected through semi-structured interviews. These interviews sought to understand the maize acquisition strategies of mill owners, the daily utilization of milling equipment, the mill‘s storage strategies, the constraints to entering into and expanding the milling business, and the risks associated with owning and operating a mill. In total, seven small-scale mills were interviewed for this study.
2.2.5. Sampling Strategies for Large-Scale Grain Processing and Trading Firms and Data Collection Methods
Large-scale market actors were identified based on our knowledge of the national maize markets and by other actors in the value chain. Data were collected from eight large-scale trading companies using semi-structured interview strategies. Interviews were conducted with either the CEO or CFO of the company. These interviews sought to explore the seasonal variation in the buying and selling practices of these firms, the relative importance of various market actors to their maize acquisition strategies, the risks associated with the maize milling and trading industry, the potential for warehouse receipt systems, and the role of the
government in structuring their business strategies.
This data is supplemented by data from the 10-year panel rural household survey and monthly price information from the Market Information Research Bureau of the Ministry of Agriculture and the Ministry of Trade and Industry.
3. AN OVERVIEW OF MAIZE MARKETING IN KENYA 3.1. Main Production and Consumption Patterns and Trends
According to FAO Stat (2009), Kenyans consume 2,155 kilocalories of food per day on average. Of this, 1,183 kilocalories (55%) are in the form of the main staples: maize, wheat, beans, potatoes, plantains, and rice. Over the last 40 years, caloric intake per person appears to have been roughly constant over time in Kenya, dipping in the early 1990s but rising gradually since then.2
Maize is the main staple food in Kenya, accounting for 65% of total staple food caloric intake and 36% of total food caloric intake (FAO Stat 2009, Table 2).3 The average person
consumes 88 kgs of maize products per year. Wheat is the second most important staple nationally, accounting for 17% of staple food consumption in Kenya. However, recent urban consumption surveys indicate that wheat products have overtaken maize in terms of
expenditures in urban areas, and the share of rice in urban food consumption is also rising (Muyanga et al. 2005).
Maize has inferior good characteristics in the sense that its share in staple food expenditures is highest among the poor. Maize accounts for nearly 20% of total food expenditures among the poorest 20% of urban households, declining to 1% of total food expenditures among the wealthiest 20% (Muyanga et al. 2005).
Beans are the third most important staple food nationally, accounting for 9% of staple food calories and 5% of total food calories in the national diet (Table 3).
Individually, cooking bananas, potatoes, and rice constitute less than 5% of staple food calories and 3% or less of total food calories.
2 The temporary drop in caloric intake per person during the early 1990s was associated with a period of
negative per capita national income growth and negative per capita agricultural growth.
3 According to the FAO Stat website, 2003 was the most recent year for which data is available, so these figures
may be slightly outdated.
Table 2. Importance of Staple Foods in Diet in Kenya
Commodity Quantity consumed Daily caloric intake Share of caloric intake
(kg/person/year) (kcal/person/day) (percent)
Maize 88 768 65% Wheat 26 196 17% Plantains 23 56 5% Potatoes 31 60 5% Beans 11 103 9% Total 180 1183 100% Source: FAO 2009
Table 3. Production and Trade of Food Staples in Kenya, 2005-2007 Commodity Production Imports Exports Imports as a percentage of
apparent consumption
Exports as a percentage of production
(‗000 tons) (‘000 tons) (‗000 tons) (%) (%)
Maize 3,027 108 25 3.5% 0.8% Wheat 360 612 2 63.1% 0.5% Potatoes 855 0 0 0% 0% Plantains 602 0 0 0% 0% Beans 447 40 3 8.2% 0.6% Rice 39 248 1 86.6% 1.9% Total 5330 1009 31
Source: FAOStat 2009. Figures are based on the mean of 2005, 2006 and 2007 production levels. Note: Apparent consumption is production plus imports minus exports and non-food uses. Production data: http://faostat.fao.org/site/567/default.aspx#ancor
Trade data: http://faostat.fao.org/site/535/default.aspx#ancor
Because national maize production is not keeping pace with the growth in national demand, imported wheat and rice are increasingly filling the residual food needs gap. For this reason, the share of wheat and rice in staple food expenditures are rising, leading to more diversified basket of staples over time. Figure 1 shows trends in maize, wheat, and rice net exports over time (exports minus imports). Figure 1 shows an increasing staple food deficit in Kenya over time. Wheat products are filling most of the deficit.
Figure 1. Net Grain Exports, Kenya, 1975-2007
-2000 -1750 -1500 -1250 -1000 -750 -500 -250 0 250 500 00 0 M et ric to ns 1975 1977 1979 1981 1983 1985 1987 1989 1991 1993 1995 1997 1999 2001 2003 2005 2007 Year
All Grains Maize Wheat Rice
Source: FAOSTAT 2010