Characterization of resistance to Fusarium head
blight in bread and durum wheat
A dissertation submitted to the College of Graduate and Postdoctoral Studies in partial fulfillment of the requirements
for the degree of Doctor of Philosophy in the Department of Plant Sciences
University of Saskatchewan Saskatoon, Saskatchewan, Canada
By
Gurcharn Singh Brar
i
PERMISSION TO USE
In presenting this dissertation in partial fulfillment of the requirements of a postgraduate degree from the University of Saskatchewan, I agree that the Libraries of this University may make it freely available for inspection. I further agree that permission for copying of this dissertation in any manner, in whole or in part, for scholarly purposes may be granted by the professor or professors who supervised this thesis work, or in their absence, by the Head of the Department or the Dean of the College in which this thesis work was done. It is
understood that any copying or publication or use of this dissertation or part thereof for financial gain shall not be allowed without my written permission. It is also understood that due recognition shall be given to me and to the University of Saskatchewan in any scholarly use which may be made of any material in my dissertation.
DISCLAIMER
This dissertation was exclusively created to meet the dissertation and/or exhibition requirements for the degree of Doctor of Philosophy at the University of Saskatchewan. References in this dissertation to any specific commercial products, process, or service by trade name, manufacturer or otherwise, does not constitute or imply endorsement,
recommendation, or favoring by the University of Saskatchewan. The views and opinions of the author expressed herein do not reflect those of the University of Saskatchewan and shall not be used for advertising or product endorsement purposes.
Requests for permission to copy or to make other use of material in this dissertation in whole or part should be addressed to:
Head, OR Dean
Department of Plant Sciences, College of Graduate and Postdoctoral Studies College of Agriculture and Bioresources University of Saskatchewan
51 Campus Drive, 116 Thorvaldson Building, 110 Science Place University of Saskatchewan, Saskatoon, Saskatchewan S7N 5C9 Saskatoon, Saskatchewan, S7N 5A8 Canada
ii
ABSTRACT
Fusarium head blight (FHB) caused primarily by Fusarium graminearum (Fg) Schwabe (telomorph: Gibberella zeae Schw. [Petch]) in North America, is one of the most devstating diseases of wheat in Canada. An integrated approach to manage this disease is recommended that combines the adoption of cultural practices (tillage and crop rotation), cultivar resistance, and fungicide application at recommended timings. Resistance to FHB in wheat is a
quantitatively inherited trait and highly influenced by environmental conditions. Sources of resistance are available in common wheat but not for durum wheat. There are no
commercially available durum cultivars which are moderately resistant in North America which in part, can be explained by a lack of resistance in the primary gene pool. The current study was designed to study the effects (on disease suppression and linkage-drag associated with introgressions) of Sumai 3 derived Fhb1, Fhb2, and Fhb5 genes in hard red spring wheat cultivars [near-isogenic lines (NILs) developed in CDC Go and CDC Alsask backgrounds] from western Canada, the interaction of Fhb1 and Fhb5 with metconazole fungicide, and the mapping of quantitative trait loci (QTL) from emmer and durum wheat lines. The last part of the study utilized X-ray computed tomography as a tool to image selected NILs in the CDC Alsask background and focused on identification of key tissues conferring Type-II resistance to Fg. The phenotypic response of NILs carrying combinations of Sumai 3-derived genes suggested non-additive responses and Fhb5 was as effective as Fhb1 in conferring field resistance in both populations. Four to five resistance improving alleles, other than Fhb1, Fhb2, and Fhb5, in both populations were identified and three of five in the CDC Go population were contributed by the susceptible parent. The regions carrying these resistance improving alleles encoded disease resistance proteins, protein kinases, nucleotide-binding and leucine rich repeats’ domains. Complex epistatic gene-gene interactions among marker loci (including Fhb1, Fhb2, Fhb5) explained >20% of the
phenotypic variation in FHB infection measurements. For the linkage drag experiment, introgressions resulted in lower thousand kernel weight and increased plant height with Fhb5. Among end-use quality traits, SDS-sedimentation volume and grain protein content were affected. In addition to Fhb1, Fhb2, Fhb5, we identified 10 loci in CDC Alsask NILs and nine in CDC Go NILs that affected the traits measured and none of these additional loci were common in both populations indicating the presence of multiple alleles in exotic sources that can result in linkage drag. Linkage drag is largely dependent on genetic background and the proportion of donor resistance alleles, thus, we observed more adverse effects among CDC Alsask NILs than among CDC Go NILs. Improvements in FHB resistance can still be made by introgressing the major genes examined in this study by using marker-assisted selection
iii
and selecting rare segregants with improved agronomy and end-use quality. There was an additive effect of Sumai 3-derived genes with metconazole in suppressing FHB and deoxynivalenol (DON) accumulation in the grain. Despite higher fungicide efficacy on moderately susceptible (MS) genotypes, FHB severity was greater on MS as compared to moderately resistant (MR) genotypes. Application of fungicides is warranted even on MR cultivars under moderate and high FHB disease pressure to reduce the amount of Fusarium damaged kernels (FDKs) and DON accumulation. In the QTL mapping study of tetraploid wheat, fifteen QTL (derived from both parents) for FHB resistance were identified on 11 of the 14 chromosomes using saturated linkage maps and a majority of the QTL were
consistently detected in multiple environments. The combination of four relative large-effect and promising QTL reduced field FHB index, severity, incidence and visual rating index by 59%, 48%, 30%, and 29%, respectively. The majority of the QTL reported in the current study are novel and represent narrow intervals between the flanking markers; therefore, marker-assisted selection shoulb be of value in breeding FHB resistant durum wheat
cultivars. In the final study of this thesis, as a proof-of-concept, we showcased the successful use of synchrotron-based X-ray imaging techniques to study the wheat-Fg interaction. This work indicated/re-confirmed the structural role of rachilla and rachis nodes in Type-II
resistance to Fg in wheat. The results from all these studies will help wheat breeders to make decisions on introgressing exotic FHB resistance genes into common wheat. Additionally, novel QTL identified in tetraploid wheat can be used to enhance resistance in elite durum wheat lines by marker-assisted selection.
iv
DEDICATION
I dedicate this work and dissertation to the great emperor of Sikh Empire, Sher-e-Punjab (Lion of Punjab) Maharaja Ranjit Singh (1780-1839), Maharani Jind Kaur (1817-1863)
and their son Maharaja Duleep Singh (1838-1893)
v
ACKNOWLEDGEMENTS
I would like to express my special appreciation to my co-supervisors Dr. Pierre J. Hucl (Professor and Wheat Breeder, Crop Development Centre) and Dr. Hadley R. Kutcher (Professor and Cereal Pathologist, Crop Development Centre) for their valuable academic guidance, encouragements and tremendous support throughout my degree program. I also extend my sincere thanks to my advisory committee members Dr. Curtis J. Pozniak
(Professor and Wheat Breeder, Crop Development Centre), Dr. Chithra Karunakaran (Senior Scientist and Manager, Environmental and Earth Sciences, the Canadian Light Source – National Synchrotron Research Facility, Saskatoon), Drs. Yuguang Bai (Head, Department of Plant Sciences), Dr. Steve Shirtliffe (Acting Head, Department of Plant Sciences), and Dr. Soledade Pedras (Department of Chemistry, University of Saskatchewan) for their scientific advice and insightful comments and suggestions. Special thanks to Dr. Paul Murphy (North Carolina State University, USA) for serving as the external examiner for this dissertation.
I am very grateful to Dr. Pawan K. Singh [Head, Wheat Pathology, International Maize and Wheat Improvement Center (CIMMYT), Mexico], Dr. Anita L. Brûlé-Babel (Wheat Breeder, University of Manitoba), Dr. Maria A. Henriquez(Wheat Pathologist, Agriculture and Agri-Food Canada, Morden Research and Development Center, Morden, MB), Dr. Xinyao He (Wheat Geneticist, CIMMYT, Mexico) for their help in field trials and support in the degree program. I appreciate the technical assistance provided by Mike Grieman, Glenn Trowell, Mallory Dyck, Everett Boots, Angel Liew, Dr. Amidou N’Diaye, Krysta Wiebe, Justin Coulson, Lexie Martin, Connie Briggs, Gene Argnosa, Dr. Amit Deokar as well as the entire staff of the Bread Wheat Field Lab, Cereal Pathology Lab, the Grains Innovation Lab, Wheat Molecular Breeding Lab at the University of Saskatchewan, Mid-IR and BMIT beamlines at the Canadian Light Source, Wheat Pathology Lab at CIMMYT, Mexico. Finally, I would thank my family for their moral support and unconditional love.
I gratefully acknowledge the financial assistance from the University of Saskatchewan Dean’s Scholarship for PhD, Saskatchewan Wheat Development Commission (SWDC) Scholarship, Monsanto’s Beachell-Borlaug International Scholars Progarm (MBBISP), the Canadian Phytopathological Society (CPS) Graduate Scholarship, Pest Management Award/Scholarship from the Canadian Society of Agronomy (CSA) and other many minor scholarships from the Department of Plant Science, College of Agriculture & Bioresources, and the University of Saskatchewan.
vi
TABLE OF CONTENTS
PERMISSION TO USE ... I ABSTRACT ... II DEDICATION ... IV ACKNOWLEDGEMENTS ... V LIST OF TABLES ... XI LIST OF FIGURES ... XVIII LIST OF APPENDICES ... XXII LIST OF ABBREVIATIONS ... XXIVCHAPTER 1 ... 1 INTRODUCTION ... 1 1.1.PROJECT HYPOTHESES ... 3 1.2.PROJECT OBJECTIVES ... 4 CHAPTER 2 ... 5 REVIEW OF LITERATURE ... 5
2.1.WHEAT: BRIEF HISTORY AND PRODUCTION IN CANADA ... 5
2.2.GENOMIC CONSTITUTION OF WHEAT ... 5
2.3.BIOTIC STRESSES ASSOCIATED WITH WHEAT CULTIVATION IN CANADA ... 6
2.4.FUSARIUM HEAD BLIGHT: CAUSAL PATHOGEN AND DISEASE EPIDEMIOLOGY ... 6
2.5.FHB MANAGEMENT STRATEGIES ... 9
2.6.MANAGEMENT OF FHB USING FUNGICIDES ... 10
2.7.HOST RESISTANCE ... 11
2.7.1. Hexaploid wheat ... 12
2.7.2. Tetraploid wheat ... 20
2.7.3. Wheat relative species ... 24
2.7.4. Expressed proteins and hormones related to FHB resistance ... 24
2.8.IMPLICATIONS OF USING FHB RESISTANCE QTL/GENE(S) ... 25
2.9.SYNCHROTRON-BASED TECHNOLOGIES TO STUDY FG-WHEAT PATHOSYSTEM ... 26
vii
EVALUATION OF FUSARIUM HEAD BLIGHT RESISTANCE GENES FHB1, FHB2, AND FHB5 INTROGRESSED INTO ELITE CANADIAN HARD RED SPRING WHEATS: PART I. EFFECT ON DISEASE SEVERITY AND DEOXYNIVALENOL ACCUMULATION AS AFFECTED BY GENETIC
BACKGROUND AND EPISTATIC INTERACTIONS ... 29
3.1.PREFACE ... 29
3.2.ABSTRACT ... 29
3.3.INTRODUCTION ... 30
3.4.MATERIALS AND METHODS ... 33
3.4.1. NIL development using marker-assisted background selection ... 33
3.4.2. Microsatellite and SNP genotyping ... 33
3.4.3. Greenhouse FHB evaluations ... 34
3.4.4. Field FHB evaluations ... 35
3.4.5. DON quantification ... 36
3.4.6. Physical mapping and functional annotation ... 36
3.4.7. SNP data and marker-marker epistatic interaction analyses ... 36
3.4.8. Statistical and phenotypic data analyses ... 37
3.5.RESULTS ... 38
3.5.1. Marker analyses ... 38
3.5.2. FHB evaluations and heritability estimates ... 39
3.5.3. Marker main effects and epistatic interactions ... 47
3.5.4. Physical mapping and functional annotation ... 48
3.6.DISCUSSION ... 55
CHAPTER 4 ... 60
EVALUATION OF FUSARIUM HEAD BLIGHT RESISTANCE GENES FHB1, FHB2, AND FHB5 INTROGRESSED INTO ELITE CANADIAN HARD RED SPRING WHEATS: PART II. EFFECT ON AGRONOMIC AND END-USE QUALITY TRAITS AND IMPLICATIONS FOR BREEDING ... 60
4.1.PREFACE ... 60
4.2.ABSTRACT ... 60
4.3.INTRODUCTION ... 61
4.4.MATERIALS AND METHODS ... 62
4.4.1. Plant material and marker analyses ... 63
viii
4.4.3. Agronomic measurements ... 63
4.4.4. End-use quality assessment ... 64
4.4.5. Statistical analyses ... 64
4.5.RESULTS ... 65
4.6.DISCUSSION ... 76
CHAPTER 5 ... 78
FUSARIUM HEAD BLIGHT (FHB) RESISTANCE GENES FHB1 AND FHB5 IN HARD RED SPRING WHEAT DO NOT INTERACT WITH METCONZAOLE FUNGICIDE ... 78
5.1.PREFACE ... 78
5.2.ABSTRACT ... 78
5.3.INTRODUCTION ... 79
5.4.MATERIALS AND METHODS ... 81
5.4.1. Plant material ... 81
5.4.2. NIL genotyping ... 81
5.4.3. Study sites, experimental design, disease inoculation and fungicide application .. 82
5.4.4. Disease assessment, DON quantification, measurement of agronomic traits and grain protein content ... 82
5.4.5. Statistical analyses ... 83
5.5.RESULT ... 84
5.5.1. Genomic composition of NILs ... 84
5.5.2. Treatment and interaction effects ... 84
5.5.3. Correlation coefficients and fungicide efficacy ... 86
5.6.DISCUSSION ... 93
CHAPTER 6 ... 97
HIGH-DENSITY MAPPING AND ANNOTATION OF NOVEL QUANTITATIVE TRAIT LOCI (QTL) FOR RESISTANCE TO FUSARIUM HEAD BLIGHT (FHB) IN DURUM AND EMMER WHEAT ... 97
6.1.PREFACE ... 97
6.2.ABSTRACT ... 97
6.3.INTRODUCTION ... 98
6.4.MATERIALS AND METHODS ... 100
ix
6.4.2. FHB evaluations ... 101
6.4.3. High-throughput genotyping ... 101
6.4.4. Seed color assay ... 101
6.4.5. Phenotypic data analyses ... 102
6.5.6. Marker analyses, linkage and QTL mapping ... 102
6.4.7. Physical mapping, annotation and comparison with previously mapped QTL ... 103
6.5.RESULTS ... 103
6.5.1. Phenotypic evaluations and heritability estimates ... 103
6.5.2. High-density linkage mapping ... 106
6.5.3. QTL mapping ... 109
6.5.4. Effect of pyramiding QTL and epistatic interactions ... 113
6.5.5. Physical mapping and annotation ... 116
6.6.DISCUSSION ... 117
CHAPTER 7 ... 122
SHOWCASING THE APPLICATION OF SYNCHROTRON-BASED X-RAY COMPUTED TOMOGRAPHY IN HOST-PATHOGEN INTERACTIONS: THE ROLE OF WHEAT RACHILLA & RACHIS NODES IN TYPE-II RESISTANCE TO FUSARIUM GRAMINEARUM* ... 122
7.1.PREFACE ... 122
7.2.ABSTRACT ... 122
7.3.INTRODUCTION ... 123
7.4.THEORY BEHIND X-RAY PHASE CONTRAST IMAGING ... 125
7.5.MATERIALS AND METHODS ... 126
7.5.1. Plant material ... 126
7.5.2. Fungal isolates, inoculum preparation, procedure, and disease assessment ... 127
7.5.3. X-ray phase contrast imaging (PCI) and computed tomography (CT) ... 127
7.5.4. Image processing ... 128
7.5.5. Bulk Fourier transform mid infrared (FTIR) spectroscopy ... 132
7.5.6. Statistical analyses ... 133
7.6.RESULTS ... 134
7.6.1. FHB resistance evaluation ... 134
7.6.2. X-ray imaging and computed tomography ... 135
7.6.3. Tissue and void space volumes in ROIs ... 136
x
7.6.5. FTIR analyses ... 144
7.7.DISCUSSION ... 145
CHAPTER 8 ... 151
SYNTHESES AND CONCLUSIONS ... 151
REFERENCES ... 154
xi
LIST OF TABLES
TABLE 2. 1.QUANTITATIVE TRAIT LOCI (QTL) FOR FUSARIUM HEAD BLIGHT (FHB)
RESISTANCE MAPPED IN COMMON WHEAT POST YEAR 2009[FOLLOWING THE REVIEW BY
BUERSTMAYR ET AL.(2009) THAT DESCRIBED QTL MAPPED UNTIL 2009]. ... 14
TABLE 2. 2.MAPPING POPULATIONS AND THE PHENOTYPING METHODS PERFORMED TO MAP
FUSARIUM RESISTANCE QUANTITATIVE TRAIT LOCI IN TETRAPLOID WHEAT FROM 2014 TO THE PRESENT [FOLLOWING THE REVIEW BY PRAT ET AL.(2014) THAT DESCRIBED QTL MAPPED UP TO AN INCLUDING 2013]. ... 21
TABLE 2. 3.QUANTITATIVE TRAIT LOCI (QTL) FOR FUSARIUM HEAD BLIGHT RESISTANCE MAPPED IN TETRAPLOID WHEAT FROM 2014 TO THE PRESENT [FOLLOWING THE REVIEW BY
PRAT ET AL.(2014) THAT DESCRIBED QTL MAPPED UP TO AN INCLUDING 2013]. ... 21
TABLE 3.1.ANALYSIS OF VARIANCE (F-VALUES) FOR NEAR-ISOGENIC LINES (NILS) IN CDCGO AND CDCALSASK BACKGROUNDS, CARRYING ALL COMBINATIONS OF THREE FUSARIUM HEAD BLIGHT (FHB) RESISTANCE GENES:FHB1,FHB2, AND FHB5. FIXED EFFECTS OF FHB RESISTANCE GENES AND ENTRY (NESTED WITHIN GENE) ARE PROVIDED FOR FHB SEVERITY ASSESSED IN THE GREENHOUSE AT 14 DAYS POST INOCULATION (GH14),21 DAYS POST INOCULATION (GH21), AREA UNDER DISEASE PROGRESS CURVE (GH_AUDPC), FIELD INCIDENCE (FLD_INC), FIELD SEVERITY (FLD_SEV), FIELD FHB INDEX (FLD_IND), DEOXYNIVALENOL (FLD_DON) ACCUMULATION, AND BROAD-SENSE HERITABILITY (H2).
FOR GREENHOUSE DATA, THE EFFECT OF CHEMOTYPE (3ADON OR 15ADON), AND
CHEMOTYPE BY GENE INTERACTION IS ALSO PRESENTED. ... 44
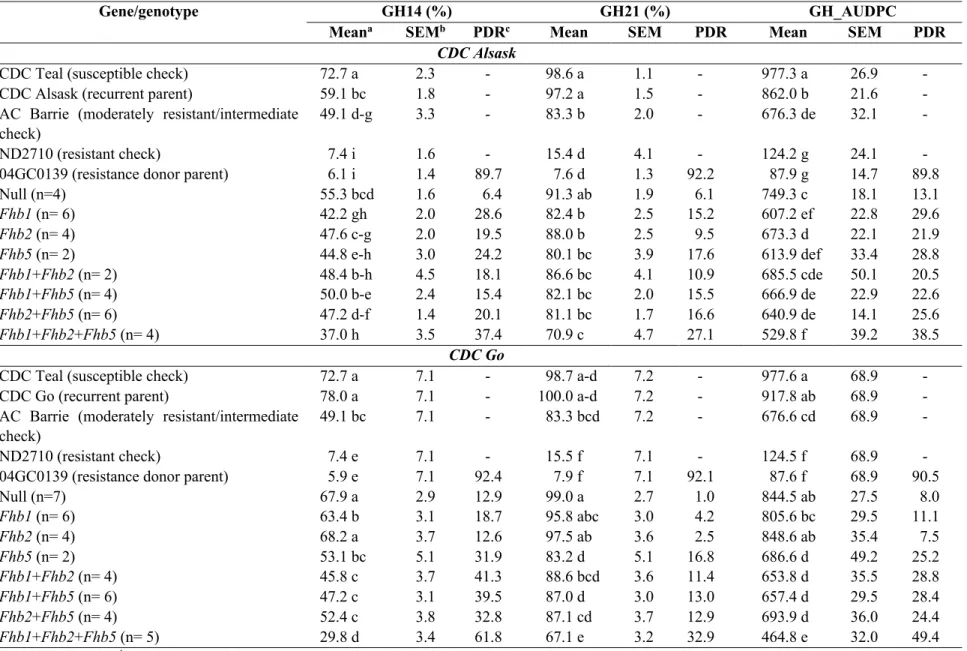
TABLE 3.2.MEANS AND STANDARD ERRORS FOR FHB SEVERITY IN THE GREENHOUSE AT 14 DAYS POST INOCULATION (GH14),21 DAYS POST INOCULATION (GH21), AND AREA UNDER
DISEASE PROGRESS CURVE (GH_AUDPC) IN GENE CLASSES AND CHECK LINES FOR CDC
ALSASK AND CDCGO NEAR-ISOGENIC LINES.MEANS WITHIN EACH COLUMN FOR EACH POPULATION FOLLOWED BY THE SAME LETTER ARE NOT STATISTICALLY SIGNIFICANTLY DIFFERENT ACCORDING TO FISHER’S LEAST SIGNIFICANT DIFFERENCE (LSD) AT P=0.05.
... 45 TABLE 3.3.MEANS AND STANDARD ERRORS FOR FIELD INCIDENCE (FLD_INC), FIELD
SEVERITY (FLD_SEV), FIELD FHB INDEX (FLD_IND), AND DEOXYNIVALENOL
(FLD_DON) ACCUMULATION IN GENE CLASSES AND CHECK LINES FOR CDCALSASK AND
CDCGO NEAR-ISOGENIC LINES.THE DATA IS COMBINED OVER SIX ENVIRONMENTS.
xii
NOT STATISTICALLY SIGNIFICANTLY DIFFERENT ACCORDING TO FISHER’S LEAST
SIGNIFICANT DIFFERENCE (LSD) AT P=0.05. ... 46
TABLE 3.4.SIGNIFICANT (P=0.001) OF EPISTATIC MARKER-MARKER INTERACTIONS AND PERCENT PHENOTYPIC VARIATION EXPLAINED (R2) BY THE INTERACTION IN CDCALSASK AND CDCGO NEAR-ISOGENIC LINES (NILS).HERE AA AND BB ALLELES ARE FROM
RECURRENT PARENTS CDCGO/CDCALSASK AND RESISTANCE DONOR PARENT
04GC0139, RESPECTIVELY. ... 49
TABLE 3.5.SINGLE NUCLEOTIDE POLYMORPHISM (SNP) MARKERS (OTHER THAN FHB1,FHB2, AND FHB5) ASSOCIATED (P<0.05) WITH FUSARIUM HEAD BLIGHT INDEX (FLD_IND),
SEVERITY (FLD_SEV), INCIDENCE (FLD_INC), DEOXYNIVALENOL ACCUMULATION
(FLD_DON), AND AREA UNDER DISEASE PROGRESS CURVE FROM GREENHOUSE
EVALUATION (GH_AUDPC) IN CDCALSASK NEAR-ISOGENIC LINES. THE NUMBERS NOT IN PARENTHESES REPRESENT DIFFERENCES (IN UNITS FOR THE TRAITS) IN LSMEANS AND THE NUMBER IN PARENTHESES INDICATE PERCENT DISEASE REDUCTION RELATIVE TO SUSCEPTIBLE ALLELE. ... 50
TABLE 3.6.SINGLE NUCLEOTIDE POLYMORPHISM (SNP) MARKERS (OTHER THAN FHB1,FHB2, AND FHB5) SIGNIFICANTLY ASSOCIATED (P<0.05) WITH FUSARIUM HEAD BLIGHT INDEX
(FLD_IND), SEVERITY (FLD_SEV), INCIDENCE (FLD_INC), DEOXYNIVALENOL
ACCUMULATION (FLD_DON), AND AREA UNDER DISEASE PROGRESS CURVE FROM
GREENHOUSE EVALUATION (GH_AUDPC) IN CDCGO NEAR-ISOGENIC LINES. THE NUMBERS NOT IN PARENTHESES REPRESENT DIFFERENCES (IN UNITS FOR THE TRAITS) IN
LSMEANS AND THE NUMBER IN PARENTHESES INDICATES PERCENT DISEASE REDUCTION
RELATIVE TO SUSCEPTIBLE ALLELE. ... 52
TABLE 3.7.LIST OF GENES (GENE ID AND NAME) ANNOTATED FOR SINGLE NUCLEOTIDE
POLYMORPHISM (SNP) LOCI CONFERRING RESISTANCE TO FUSARIUM HEAD BLIGHT (FHB).
FOR EACH ANNOTATED GENE,MUNICH INFORMATION CENTER FOR PROTEIN SEQUENCES
(MIPS) ANNOTATION HIT ID IS PROVIDED. ... 53
TABLE 4.1.DESCRIPTION OF STUDY SITES, SEEDING, HERBICIDE APPLICATION AND HARVESTING DATES. ... 63
TABLE 4.2.F-VALUES AND BROAD-SENSE HERITABILITY (H2) ESTIMATES OF NEAR-ISOGENIC LINES (NILS) IN CDCGO AND CDCALSASK BACKGROUNDS, CARRYING ALL
COMBINATIONS OF THREE FUSARIUM HEAD BLIGHT (FHB) RESISTANCE GENES:FHB1,
FHB2, AND FHB5.THE TABLE PRESENTS THE FIXED EFFECTS OF FHB RESISTANCE GENE AND ENTRY (NESTED WITHIN GENE) ON AGRONOMIC AND END-USE QUALITY TRAITS.
xiii
GRAIN YIELD, TEST WEIGHT, THOUSAND KERNEL WEIGHT, AND GRAIN PROTEIN CONTENT ARE BASED ON 14.5% MOISTURE BASIS. ... 70
TABLE 4.3.LEAST SQUARE MEANS AND STANDARD ERROR OF MEAN FOR AGRONOMIC TRAITS IN GENE CLASSES AND PARENTS FOR CDCALSASK NEAR-ISOGENIC LINES (NILS) FOR 2016 AND 2017 GROWING SEASONS.THE DATA IN EACH YEAR WAS COMBINED OVER THREE SITES.MEANS FOLLOWED BY SAME LETTER ARE NOT STATISTICALLY SIGNIFICANTLY DIFFERENT ACCORDING TO TUKEY’S HONEST SIGNIFICANT DIFFERENCE (HSD) AT P=0.05.
ALL TRAITS ARE REPORTED AT A CONSTANT 14.5% MOISTURE BASIS. ... 71
TABLE 4.4.LEAST SQUARE MEANS AND STANDARD ERROR OF MEAN FOR AGRONOMIC TRAITS IN GENE CLASSES AND PARENTS FOR CDCGO NEAR-ISOGENIC LINES (NILS) FOR 2016 AND
2017 GROWING SEASONS.THE DATA IN EACH YEAR WAS COMBINED OVER THREE SITES.
MEANS FOLLOWED BY SAME LETTER ARE NOT STATISTICALLY SIGNIFICANTLY DIFFERENT
ACCORDING TO TUKEY’S HONEST SIGNIFICANT DIFFERENCE (HSD) AT P=0.05.ALL TRAITS ARE REPORTED AT A CONSTANT 14.5% MOISTURE BASIS. ... 72
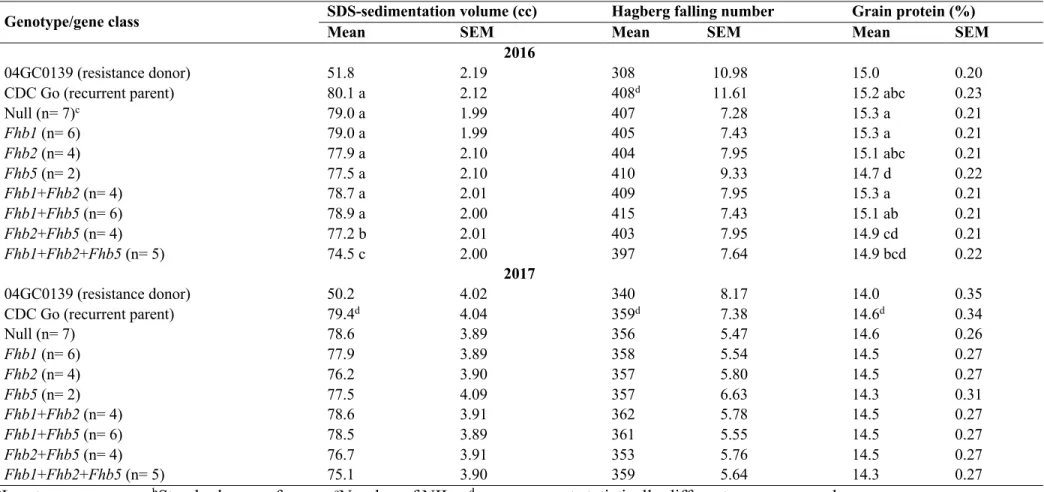
TABLE 4.5.LEAST SQUARE MEANS AND STANDARD ERROR OF MEAN FOR TEST WEIGHT AND END-USE QUALITY TRAITS IN GENE CLASSES AND PARENTS FOR CDCALSASK NEAR -ISOGENIC LINES (NILS) IN 2016 AND 2017 GROWING SEASONS.THE DATA IN EACH YEAR
WAS COMBINED OVER THREE SITES.MEANS FOLLOWED BY SAME LETTER ARE NOT
STATISTICALLY SIGNIFICANTLY DIFFERENT ACCORDING TO TUKEY’S HONEST SIGNIFICANT DIFFERENCE (HSD) AT P=0.05. ALL TRAITS ARE REPORTED AT CONSTANT 14.5%
MOISTURE BASIS. ... 73
TABLE 4.6.LEAST SQUARE MEANS AND STANDARD ERROR OF MEAN FOR END-USE QUALITY TRAITS IN GENE CLASSES AND PARENTS FOR CDCGO NEAR-ISOGENIC LINES (NILS) IN
2016 AND 2017 GROWING SEASONS.THE DATA IN EACH YEAR WAS COMBINED OVER THREE SITES.MEANS FOLLOWED BY THE SAME LETTER ARE NOT STATISTICALLY SIGNIFICANTLY DIFFERENT ACCORDING TO TUKEY’S HONEST SIGNIFICANT DIFFERENCE (HSD) AT P=0.05.
ALL TRAITS ARE REPORTED AT CONSTANT 14.5% MOISTURE BASIS. ... 74
TABLE 4.7. SINGLE NUCLEOTIDE POLYMORPHISM (SNP) MARKERS ALLELES (OTHER THAN
FHB1,FHB2,FHB5) ASSOCIATED (SIGNIFICANT AT P=0.001 FOR COEFFICIENT OF
DETERMINATION) WITH AGRONOMIC AND END-USE QUALITY TRAITS IN CDCALSASK AND
CDCGO NEAR-ISOGENIC LINES (NILS). ... 75
TABLE 5.1.DESCRIPTION OF STUDY SITES, SOIL TYPE, SEEDING, INOCULATION, FUNGICIDE APPLICATION, AND DISEASE RATING DATES, AVERAGE MONTHLY TEMPERATURE, AND PRECIPITATIONA. ... 87
xiv
TABLE 5.2.PROPORTION OF THE GENOME OF EACH NEAR-ISOGENIC LINE FROM THE RECURRENT PARENT CDCGO (A) AND THE RESISTANT DONOR PARENT,04GC0139(B) USED IN THE STUDY, BASED ON GENOME-WIDE SINGLE NUCLEOTIDE POLYMORPHISMS MARKERS (90,000 ILLUMINA ISELECT ASSAY).H AND U REPRESENT HETEROZYGOUS OR UNKNOWN ALLELES.
... 87 TABLE 5.3.ANALYSIS OF VARIANCE (F-VALUES AND CORRESPONDING P-VALUES; SIGNIFICANT
P-VALUES ARE IN BOLDFACE) FOR THE EXPERIMENTS CONDUCTED IN FOUR SITE-YEARS IN
SASKATCHEWAN,CANADA TO STUDY THE INTERACTION OF FUSARIUM HEAD BLIGHT
(FHB) RESISTANCE GENES WITH THE METCONAZOLE (CARAMBAÒ) FUNGICIDE APPLIED AT
50% ANTHESIS. THE TABLE SHOWS THE VARIANCE COMPONENTS ALONG WITH
STATISTICAL SIGNIFICANCE OF GENOTYPES FUNGICIDE AND THEIR INTERACTION IN EACH SITE-YEAR ON FHB INCIDENCE, SEVERITY, INDEX, DEOXYNIVALENOL (DON)
ACCUMULATION, TEST WEIGHT (TW), THOUSAND-KERNEL WEIGHT (TKW), YIELD AND GRAIN PROTEIN (GP). ... 87
TABLE 5.4.LEAST SQUARES MEANS (SPRAYED+UNSPRAYED) OF FUSARIUM HEAD BLIGHT
(FHB) INCIDENCE, SEVERITY, INDEX, DEOXYNIVALENOL ACCUMULATION (DON), TEST WEIGHT (TW), THOUSAND KERNEL WEIGHT (TKW), YIELD AND GRAIN PROTEIN FOR THE NEAR-ISOGENIC LINES (NILS) CARRYING FHB RESISTANCE GENES IN FOUR SITE-YEAR FIELD TRIALS.TEST WEIGHT,TKW,YIELD AND GRAIN PROTEIN ESTIMATES ARE BASED ON
CONSTANT MOISTURE CONTENT. MEANS COMPARISON WAS PERFORMED WITHOUT
INCLUSION OF CARBERRY. ... 89
TABLE 5.5.MEANS OF FUSARIUM HEAD BLIGHT (FHB) INCIDENCE, SEVERITY, INDEX,
DEOXYNIVALENOL ACCUMULATION (DON), TEST WEIGHT (TW), THOUSAND KERNEL
WEIGHT (TKW), YIELD, AND GRAIN PROTEIN FOR FUNGICIDE TREATMENT (CARAMBA®, METCONAZOLE,GROUP 3,BASFCANADA)- IN FOUR SITE-YEARS IN SASKATCHEWAN.
TEST WEIGHT,TKW, YIELD, AND GRAIN PROTEIN ESTIMATES WERE BASED ON MOISTURE CONTENT OF 14.5%. MEANS COMPARISON WAS PERFORMED AFTER EXCLUDING
CARBERRY. ... 90
TABLE 5.6.PEARSON’S CORRELATION COEFFICIENTS BETWEEN FUSARIUM HEAD BLIGHT (FHB) INCIDENCE, SEVERITY, INDEX, DEOXYNIVALENOL (DON) ACCUMULATION, TEST WEIGHT
(TW), THOUSAND KERNEL WEIGHT (TKW) AND YIELD. TEST WEIGHT WAS NOT MEASURED FOR MELFORT 2017. CORRELATIONS WERE NOT SIGNIFICANT AMONG GRAIN PROTEIN AND ANY OF THE OTHER TRAITS. ... 91
xv
TABLE 6.1.MEAN AND RANGE OF FUSARIUM HEAD BLIGHT (FHB) TRAITS (%) IN THE
BGRC3487/2*DT735 POPULATION, PARENTAL MEAN VALUES, BROAD-SENSE
HERITABILITY (H2) FOR FIELD (FLD) AND GREENHOUSE (GH) DISEASE EVALUATIONS. . 104
TABLE 6.2.SUMMARY OF THE GENETIC MAP CONSTRUCTED WITH 160BCRILS FROM
BGRC3487/2*DT735 CROSS. ... 108
TABLE 6.3.SUMMARY OF QUANTITATIVE TRAIT LOCI (QTL) ASSOCIATED WITH FUSARIUM HEAD BLIGHT (FHB) TRAITS AND FUSARIUM GRAMINEARUM 3-ADON CHEMOTYPE SEVERITY FROM THE GREENHOUSE IN BGRC3487/2*DT735 POPULATION.THE QTL WITH ASTERISK MARK CONFER RESISTANCE DEPENDENT ON INCREASED PLANT HEIGHT (6-9 CM INCREASE) FROM THE FAVOURABLE ALLELE. ... 110
TABLE 6.4.SUMMARY OF QUANTITATIVE TRAIT LOCI (QTL) ASSOCIATED WITH SEED COAT COLOR IN THE BGRC3487/2*DT735 POPULATION. ... 111
TABLE 6.5.EFFECTS OF COMBINATIONS OF FAVORABLE ALLELES AT STABLE QUANTITATIVE TRAIT LOCI (QTL) ON FUSARIUM HEAD BLIGHT (FHB) TRAITS IN BGRC3487/2*DT735 POPULATION.THE VALUES IN PARENTHESES DEPICTS PERCENT DISEASE REDUCTION
COMPARED TO LINES CARRYING NO RESISTANCE ALLELES (NULL). ... 114
TABLE 6.6.EFFECTS OF VARIOUS COMBINATIONS OF QUANTITATIVE TRAIT LOCI (QTL)
ASSOCIATED WITH ALLELES CONFERRING RESISTANCE TO THE FUSARIUM GRAMINEARUM
3-ADON CHEMOTYPE IN THE GREENHOUSE EVALUATION OF THE BGRC3487/2*DT735 POPULATION. ... 115
TABLE 6.7.GENETIC AND PHYSICAL POSITIONS OF QTL FOR FUSARIUM HEAD BLIGHT (FHB) RESISTANCE AND SEED COAT COLOR IN BGRC3487/2*DT735 POPULATION. ... 117
TABLE 7.1.WHEAT GENOTYPES USED TO ASSESS BIOPOLYMERIC AND STRUCTURAL CHANGES IN
THE RACHILLA AND RACHIS RESULTING FROM WHEAT-FUSARIUM GRAMINEARUM
INTERACTION. ... 127
TABLE 7.2.ASSIGNMENT OF BANDS IN THE BULK FOURIER TRANSFORM MID INFRARED (FTIR) SPECTRA OF THE RACHILLA AND RACHIS NODE TISSUE OF THE WHEAT SPIKE FOR TWO TREATMENTS. TREATMENTS CONSISTED OF INOCULATIONS OF THE CENTRAL FOUR SPIKELETS IN THE MAIN-STEM SPIKE, WITH A FUSARIUM GRAMINEARUM SPORE SUSPENSION (105 SPORES/ML); PROCEDURAL CONTROL MOCK-INOCULATED WITH
DISTILLED WATERA. ... 133
TABLE 7.3.TWO-WAY ANALYSIS OF VARIANCE FOR VOLUME FRACTION (RATIO OF POROSITY AND TISSUE VOLUME) AND GRAYSCALEA INTENSITY CALCULATED FROM COMPUTED
xvi
RACHIS NODE, INTERNODES ABOVE (RACHIS INTERNODE 1) AND BELOW (RACHIS INTERNODE 2) OF THE INOCULATED FLORETS IN THE MIDDLE OF MAIN-STEM SPIKE.THE TWO-WAY COMPONENT TESTED EFFECTS OF GENOTYPE AND F. GRAMINEARUM POINT -INOCULATION TREATMENT (105 SPORES/ML INJECTED IN MIDDLE FLORETS).HERE,F=
FISHER’S F-STATISTIC VALUE,P= PROBABILITY. ... 137
TABLE 7.4.MEAN VALUES (LSMEANS) FOR VOID SPACE VOLUME FRACTION AND
GRAYSCALE/VOXEL INTENSITY DATA FOR WHEAT SPIKE SAMPLES. GENOTYPES CARRY THE FOLLOWING GENES:CDCALSASK (NULL),04GC0139(FHB1+FHB2+FHB5+),ALSASK2
(FHB1),ALSASK8(FHB1+FHB2),ALSASK22(FHB1+FHB2+FHB5),ALSASK25
(FHB2+FHB5),00AR134-1(UNKNOWN). SAMPLES CONSISTED OF RACHILLA + RACHIS NODE OF THE FUSARIUM GRAMINEARUM (FG)-INOCULATED (I) AND PROCEDURAL
CONTROL (C) FLORETS IN THE MIDDLE OF MAIN-STEM SPIKE. THE MEASUREMENTS WERE DONE ON THREE REGIONS OF INTEREST (ROIS): RACHIS INTERNODE 1(ROI-1) I.E.
INTERNODE JUST ABOVE INOCULATED FLORET, RACHILLA + RACHIS NODE (ROI-2), AND RACHIS INTERNODE 2(ROI-3), THE INTERNODE JUST BELOW THE INOCULATED FLORET.
MEANS FOLLOWED BY THE SAME LETTER ARE NOT STATISTICALLY SIGNIFICANTLY
DIFFERENT ACCORDING TO FISHER’S LEAST SIGNIFICANT DIFFERENCES (LSD) AT P=0.05.
HERE:‘-‘ MEANS NOT SIGNIFICANT. ... 138
TABLE 7.5.TWO-WAY ANALYSIS OF VARIANCE FOR PECTIN, LIGNIN, CELLULOSE, AND XYLAN FROM FOURIER TRANSFORM MID INFRARED (FTIR) DATA FOR WHEAT SPIKE SAMPLES.
GENOTYPES CARRY THE FOLLOWING GENES:CDCALSASK (NULL),04GC0139
(FHB1+FHB2+FHB5+),ALSASK2(FHB1),ALSASK8(FHB1+FHB2),ALSASK22
(FHB1+FHB2+FHB5),ALSASK25(FHB2+FHB5),00AR134-1(UNKNOWN). SAMPLES CONSISTED OF THE RACHILLA + RACHIS NODE OF THE INOCULATED FLORETS IN THE MIDDLE OF THE MAIN-STEM SPIKE. THE TWO-WAY COMPONENT TESTED EFFECTS OF GENOTYPE AND FUSARIUM GRAMINEARUM (FG) POINT-INOCULATION TREATMENT (105 SPORES/ML INJECTED IN MIDDLE FLORETS). HERE,F=FISHER’S F-STATISTIC VALUE,P= PROBABILITY VALUE.MEAN VALUES (LSMEANS) FOR PECTIN, LIGNIN, CELLULOSE, AND XYLAN FROM FOURIER TRANSFORM INFRARED (FTIR) DATA FOR WHEAT SPIKE SAMPLES ARE PRESENTED FOR GENOTYPE*TREATMENT. SAMPLES CONSISTED OF THE RACHILLA + RACHIS NODE OF THE FG-INOCULATED (I) AND PROCEDURAL CONTROL (C) FLORETS IN THE MIDDLE OF THE MAIN-STEM SPIKE. MEANS FOLLOWED BY SAME LETTER CODE ARE NOT STATISTICALLY SIGNIFICANTLY DIFFERENT ACCORDING TO FISHER’S LEAST SIGNIFICANT DIFFERENCES (LSD) AT P=0.05. ... 146
xvii
TABLE B. 1.PROPORTIONS OF THE RECURRENT PARENT (RP) AND DONOR PARENT (DP)
GENOMES IN THE NEAR-ISOGENIC LINES FOR CDCGO AND CDCALSASK STREAMS BASED ON 81,587SNP MARKERS FROM THE 90K ISELECT ASSAY (WANG ET AL.2014).HERE:A,
B,H,U REPRESENT RECURRENT PARENT, DONOR PARENT, HETEROZYGOUS, AND
UNKNOWN ALLELES, RESPECTIVELY. ... 182
TABLE E. 1.PEARSON’S CORRELATION COEFFICIENTS AMONG AGRONOMIC AND END-USE QUALITY TRAITS FROM CDCALSASK YIELD AND QUALITY PERFORMANCE TRIALS IN 2016 AND 2017. ... 186
TABLE F. 1. PEARSON’S CORRELATION COEFFICIENTS AMONG AGRONOMIC AND END-USE QUALITY TRAITS FROM CDCGO YIELD AND QUALITY PERFORMANCE TRIALS IN 2016 AND
2017... 187 TABLE G. 1.PEARSON’S CORRELATION COEFFICIENTS AMONG FUSARIUM HEAD BLIGHT (FHB)
RESISTANCE TRAITS FROM FIELD AND GREENHOUSE EVALUATIONS FOR THE
BGRC3487/2*DT735 POPULATION. ... 188
TABLE H. 1.THE NUMBER OF PARENTAL (NON-RECOMBINANT) CHROMOSOMES IN 160BCRILS
FOR EACH OF THE 14 CHROMOSOMES AND DISTRIBUTION FOR EACH OF THE TWO PARENTAL
ALLELES (BGRC3487 AND DT735).TOTAL CHROMOSOME*BCRILS COMBINATIONS =
2240. AVERAGE NUMBER OF PARENTAL CHROMOSOMES =14.5. ... 189
TABLE I. 1.CORRELATION OF PARENTAL CHROMOSOME NUMBERS WITH CHROMOSOME LENGTH
xviii
LIST OF FIGURES
FIGURE 3.1.NUMBER OF POLYMORPHIC (AMONG NEAR-ISOGENIC LINES AND RECURRENT PARENTS ONLY) SINGLE NUCLEOTIDE POLYMORPHISM (SNP) MARKERS IN CDCALSASK AND CDCGO NEAR-ISOGENIC LINES SEGREGATING FOR FHB1(3B),FHB2(6B), AND FHB5
(5A). ... 39 FIGURE 3.2.GRAPHICAL PRESENTATION OF PHYSICAL POSITION OF INTROGRESSED SEGMENTS
ON CHROMOSOMES 3B(CARRYING FHB1),6B(CARRYING FHB2),5A(CARRYING FHB5)
AND OTHER CHROMOSOMES FROM 04GC0139(RESISTANCE DONOR PARENT, YELLOW
SEGMENTS) INTO CDCALSASK (UPPER PANEL) AND CDCGO (LOWER PANEL)(RED SEGMENTS) NEAR-ISOGENIC LINES.THE SCALE BAR ON LEFT HAND SIDE INDICATES PHYSICAL POSITION (MB) AND THE BLACK BAR ON THE RIGHT INDICATES HAPLOTYPE SEGMENT CARRYING FHB1,FHB2 OR FHB5 GENE.EACH BAR REPRESENTS A GENOTYPE.
THE GREY AND BLUE SEGMENTS INDICATE UNKNOWN AND HETEROZYGOUS ALLELES,
RESPECTIVELY. ... 42
FIGURE 3.3.GENOTYPE AND GENOTYPE BY ENVIRONMENT (GGE) INTERACTION PLOT SHOWING
THE RELATIONSHIP AMONG GENOTYPES, ENVIRONMENTS AND THEIR INTERACTION FOR:
(A)CDCALSASK, AND (B)CDCGO NEAR-ISOGENIC LINES (NILS).NUMBERS IN THE GREEN INDICATE NIL ENTRIES AND VECTORS (DOTTED BLUE LINES) ARE UNIQUE TO GIVEN ENVIRONMENT (BLUE LABELS FOR VECTORS).THE SOLID BLUE LINE PASSING THROUGH THE ORIGIN OF THE PLOT IS THE ‘AVERAGE ENVIRONMENT AXIS’ INDICATING THE MOST IDEAL AND DISCRIMINATING ENVIRONMENT. THE AXES OF THE PLOT INDICATE STANDARD DEVIATION FOR PHENOTYPE (PROPORTIONAL TO LENGTH OF ENVIRONMENT VECTOR).THE PHENOTYPIC VARIATION EXPLAINED BY BOTH AXES IS INDICATED NEXT TO THE AXES LABELS. ... 43
FIGURE 3.4.FUSARIUM HEAD BLIGHT SEVERITY IN CDCGO AND CDCALSASK NEAR-ISOGENIC LINES (NILS) FOLLOWING POINT INOCULATION WITH 3-ADON AND 15-ADON
CHEMOTYPES OF FUSARIUM GRAMINEARUM (50,000 MACROCONIDIA/ML)(A) IN THE GREENHOUSE AT 14 AND 21 DAYS POST INOCULATION (DPI)(B)AREA UNDER DISEASE PROGRESS CURVE (AUDPC) WAS CALCULATED FROM THREE RATINGS:7,14, AND 21 DPI.
BARS WITH THE SAME LETTER CODE ARE NOT STATISTICALLY SIGNIFICANTLY DIFFERENT ACCORDING TO FISHER’S LEAST SIGNIFICANT DIFFERENCES AT P=0.05. THE LSMEANS WERE CALCULATED FROM ALL NILS (EXCLUDING PARENTS AND CHECKS) IN EACH
xix
FIGURE 4.1.GENOTYPE AND GENOTYPE BY ENVIRONMENT (GGE) INTERACTION PLOT SHOWING
RELATIONSHIP AMONG GENOTYPES, ENVIRONMENTS AND THEIR INTERACTION FOR (A-B)
CDCALSASK AND (C-D)CDCGO NEAR-ISOGENIC LINES (NILS) FOR 2016(A AND C) AND 2017(B AND D).NUMBERS IN THE GREEN INDICATES NIL ENTRIES AND BLUE LABELS AND VECTORS REPRESENTS ENVIRONMENT.THE SOLID BLUE LINE PASSING THROUGH THE ORIGIN OF THE PLOT IS THE ‘AVERAGE ENVIRONMENT AXIS’ INDICATING THE MOST IDEAL AND DISCRIMINATING ENVIRONMENT. THE AXES OF THE PLOT INDICATE STANDARD DEVIATION FOR PHENOTYPE (PROPORTIONAL TO LENGTH OF ENVIRONMENT VECTOR).THE PHENOTYPIC VARIATION EXPLAINED BY BOTH AXES IS INDICATED NEXT TO THE LABELS.
HERE:HD= DAYS TO HEADING,MT= DAYS TO MATURITY,HT= PLANT HEIGHT AT
PHYSIOLOGICAL MATURITY,YLD=YIELD,TW=TEST WEIGHT,TKW= THOUSAND KERNEL
WEIGHT,SDS=SDS SEDIMENTATION VOLUME,FN=HAGBERG FALLING NUMBER,
GP=GRAIN PROTEIN. ... 69
FIGURE 5.1.LEAST SQUARES MEANS FOR FUSARIUM HEAD BLIGHT (FHB) INCIDENCE,
SEVERITY, INDEX, DEOXYNIVALENOL (DON), TEST WEIGHT, THOUSAND KERNEL WEIGHT, GRAIN YIELD, AND GRAIN PROTEIN IN MODERATELY SUSCEPTIBLE (MS;CDCGO) AND MODERATELY RESISTANT (MR;NIL-2,NIL-21,NIL-28,NIL-38) HARD RED SPRING WHEAT LINES. BARS WITH THE SAME LETTER ARE NOT SIGNIFICANTLY DIFFERENT
ACCORDING TO FISHER’S LEAST SIGNIFICANT DIFFERENCE AT P=0.05. ... 92
FIGURE 5.2.FUNGICIDE EFFICACY (%) FOR FUSARIUM HEAD BLIGHT INCIDENCE (INC), SEVERITY (SEV), INDEX (IND), DEOXYNIVELANOL (DON), AND GRAIN YIELD IN
MODERATELY SUSCEPTIBLE (MS) AND MODERATELY RESISTANT (MR) HARD RED SPRING WHEAT LINES. BARS WITH THE SAME LETTER ARE NOT SIGNIFICANTLY DIFFERENT
ACCORDING TO FISHER’S LEAST SIGNIFICANT DIFFERENCE (LSD) TEST AT P=0.05. ... 93
FIGURE 6.1.FREQUENCY DISTRIBUTION OF 160 BACKCROSS RECOMBINANT INBRED LINES FROM
BGRC3487/2*DT735 CROSS FOR FUSARIUM HEAD BLIGHT (FHB) TRAITS AND SEED COAT COLOR.HERE ‘R’ AND ‘S’ REPRESENTS RESISTANCE DONOR PARENT (BGRC3487) AND RECURRENT SUSCEPTIBLE PARENT (DT735), RESPECTIVELY. ... 105
FIGURE 6.2.GENOTYPE AND GENOTYPE BY ENVIRONMENT (GGE) INTERACTION PLOT SHOWING RELATIONSHIP AMONG GENOTYPES, ENVIRONMENTS AND THEIR INTERACTION.NUMBERS IN THE GREEN INDICATES RECOMBINANT INBRED LINES ENTRIES FROM
BGRC3487/2*DT735 POPULATION AND BLUE LABELS AND VECTORS ARE UNIQUE TO EVERY ENVIRONMENT.THE SOLID BLUE LINE PASSING THROUGH THE ORIGIN OF THE PLOT
xx
IS ‘AVERAGE ENVIRONMENT AXIS’ INDICATING THE MOST IDEAL AND DISCRIMINATING ENVIRONMENT. THE AXES OF THE PLOT INDICATE STANDARD DEVIATION FOR PHENOTYPE
(PROPORTIONAL TO LENGTH OF ENVIRONMENT VECTOR).THE PHENOTYPIC VARIATION EXPLAINED BY BOTH AXES IS INDICATED NEXT TO THE LABELS. HERE:INC: INCIDENCE,
SEV: SEVERITY,IND: INDEX,GH-SEV: GREENHOUSE SEVERITY. ... 106
FIGURE 6.3.PORTIONS OF GENETIC LINKAGE MAPS WITH QUANTITATIVE TRAIT LOCI (QTL) ASSOCIATED WITH FUSARIUM HEAD BLIGHT (FHB) RESISTANCE AND SEED COAT COLOR IN THE BGRC3487/2*DT735 POPULATION (F10).THE SCALE ON THE LEFT INDICATE GENETIC DISTANCE (CM) BETWEEN SINGLE NUCLEOTIDE POLYMORPHISM (SNP) MARKERS. ... 112
FIGURE 6.4.FUSARIUM HEAD BLIGHT INDEX (FLD-IND), SEVERITY (FLD-SEV), INCIDENCE
(FLD-INC), AND VISUAL RATING INDEX (FLD-VRI) ESTIMATES FROM FIELD
EVALUATIONS AS AFFECTED BY NUMBER OF PYRAMIDED QTL. ... 115
FIGURE 7.1.COMPONENTS OF THE WHEAT SPIKE COMPRISING REGIONS OF INTEREST (ROI) USED FOR FOURIER TRANSFORMED INFRARED (FTIR) ANALYSES AND X-RAY IMAGE
ANALYSES FOR VOID SPACE/TISSUE VOLUME FRACTION AND GRAYSCALE INTENSITY
(VOXEL INTENSITY):(A) ILLUSTRATES ROIS IN THE INOCULATED BIOLOGICAL SAMPLE, AND (B) IN THE 2DX-RAY PHASE CONTRAST IMAGE. SCALE BAR:1 MM. ... 129
FIGURE 7.2.ILLUSTRATIONS OF SEGMENTATION OUTPUT FOR:(A) RACHIS INTERNODE 1,(B) RACHILLA + RACHIS NODE, AND (C) AND RACHIS INTERNODE 2 REGION OF INTEREST (ROI) SUB-VOLUMES. FOR EACH ROI, THE ORIGINAL ROI GRAYSCALE VOLUME IS IN THE
COLUMN ON THE LEFT, THE TOTAL PLANT TISSUE VOLUME IS IN THE CENTER COLUMN, AND THE VOID SPACE VOLUME IN THE COLUMN ON THE RIGHT. ... 132
FIGURE 7.3.SYMPTOMS OF FUSARIUM HEAD BLIGHT ON:(A) THE SPIKE, AND (B) THE RACHIS
(SPIKELETS REMOVED) FOLLOWING FUSARIUM GRAMINEARUM (FG) POINT-INOCULATION
(105 SPORES/ML) IN SEVEN WHEAT GENOTYPES AT 12 DAYS POST INOCULATION.
GENOTYPES WERE EITHER INFECTED (I) WITH FG (I) OR MOCK-INFECTED WITH DISTILLED WATER AS A PROCEDURAL CONTROL (C). FIGS.A AND B ARE FROM THE SAME SPIKES OF ALL GENOTYPES.GENOTYPES CARRY THE FOLLOWING GENES:CDCALSASK (NULL),
04GC0139(FHB1+FHB2+FHB5+),ALSASK2(FHB1),ALSASK8(FHB1+FHB2),ALSASK22
(FHB1+FHB2+FHB5),ALSASK25(FHB2+FHB5),00AR134-1(UNKNOWN).SCALE BAR:1 CM. ... 135
FIGURE 7.4.FUSARIUM HEAD BLIGHT (FHB) SEVERITY OF WHEAT GENOTYPES IN RESPONSE TO POINT INOCULATION BY FUSARIUM GRAMINEARUM (105 SPORES/ML) AT 12 AND 20 DAYS POST INOCULATION (DPI). ALSASK25 WAS BOTH POINT (P) AND SPRAY (S) INOCULATED.
xxi
GENOTYPES WITH SAME LETTER CODES ARE NOT STATISTICALLY DIFFERENT ACCORDING
TO FISHER’S LEAST SIGNIFICANT DIFFERENCES (LSD) AT P=0.05. GENOTYPES CARRY THE FOLLOWING GENES:CDCALSASK (NULL),04GC0139(FHB1+FHB2+FHB5+),
ALSASK2(FHB1),ALSASK8(FHB1+FHB2),ALSASK22(FHB1+FHB2+FHB5),ALSASK25
(FHB2+FHB5),00AR134-1(UNKNOWN). ... 136
FIGURE 7.5.FULL 3D RENDERING OF A SINGLE SPECIMEN (00AR134-1CONTROL) WITH BLACK
2D PLANES INDICATING THE POSITIONS AT THREE REGIONS OF INTEREST (ROIS) FOR WHICH CROSS SECTIONS (A) AS WELL AS THE LONGITUDINAL SECTION (B) WERE GENERATED. (C)VOXEL/GRAYSCALE DISTRIBUTION AMONG THREE ROIS IN WHEAT GENOTYPES DIFFERING IN FUSARIUM HEAD BLIGHT RESISTANCE ALLELES USED IN THE STUDY. THE GENOTYPES WERE SUBJECTED TO TWO TREATMENTS: PROCEDURAL CONTROL
(POINT INOCULATED WITH DISTILLED WATER) AND FUSARIUM GRAMINEARUM POINT -INOCULATED (INFECTED). THE THREE ROIS ARE: RACHIS INTERNODE 1(ROI-1), RACHILLA + RACHIS NODE (ROI-2), AND RACHIS INTERNODE 2(ROI-3). GENOTYPES CARRY THE FOLLOWING GENES:CDCALSASK (NULL),04GC0139(FHB1+FHB2+FHB5+),
ALSASK2(FHB1),ALSASK8(FHB1+FHB2),ALSASK22(FHB1+FHB2+FHB5),ALSASK25
(FHB2+FHB5),00AR134-1(UNKNOWN). HISTOGRAMS OF VOXEL/GRAYSCALE INTENSITY DISTRIBUTION FOR EACH ROI ARE PROVIDED BELOW THE 2DX-RAY IMAGE SECTIONS. X-AXES AND Y-AXES OF HISTOGRAMS REPRESENT GRAYSCALE/VOXEL INTENSITY (RANGES BETWEEN 0-65,535) AND VOXEL FREQUENCY, RESPECTIVELY. SCALE BARS =2 MM (A&
B) AND 1.5 MM (C). ... 143
FIGURE 7.6.PRINCIPAL COMPONENT ANALYSIS OF SEVEN WHEAT GENOTYPES DIFFERING IN
RESISTANCE ALLELES FOR FUSARIUM HEAD BLIGHT RESISTANCE FOR WAVENUMBERS IN
THE FINGERPRINT REGION (800-1800 CM-1) OF FOURIER TRANSFORM INFRARED (FTIR) SPECTRA. THE GENOTYPES WERE SUBJECTED TO TWO TREATMENTS: PROCEDURAL CONTROL (POINT INOCULATED WITH DISTILLED WATER)(C) AND FUSARIUM
xxii
LIST OF APPENDICES
APPENDIX A. PROCEDURE FOR NEOGEN ENZYME LINKED IMMUNE-SORBENT ASSAY (ELISA) FOR DEOXYNIVALENOL (DON) QUANTIFICATION IN FUSARIUM HEAD BLIGHT INFECTED GRAINS. ... 180
APPENDIX B.TABLE B.1.PROPORTIONS OF THE RECURRENT PARENT (RP) AND DONOR PARENT
(DP) GENOMES IN THE NEAR-ISOGENIC LINES FOR CDCGO AND CDCALSASK STREAMS BASED ON 81,587SNP MARKERS FROM THE 90K ISELECT ASSAY (WANG ET AL.2014).
HERE:A,B,H,U REPRESENT RECURRENT PARENT, DONOR PARENT, HETEROZYGOUS, AND UNKNOWN ALLELES, RESPECTIVELY. ... 182
APPENDIX C. GRAPHICAL PRESENTATION OF INTROGRESSED SEGMENTS IN ALL CHROMOSOMES, EXCEPT 3B,6B, AND 5A, FROM 04GC0139(RESISTANCE DONOR PARENT, YELLOW
SEGMENTS) INTO CDCALSASK (RED SEGMENTS) NEAR-ISOGENIC LINES.EACH BAR REPRESENTS A GENOTYPE. THE GREY AND BLUE SEGMENTS INDICATE UNKNOWN AND HETEROZYGOUS ALLELES, RESPECTIVELY. ... 184
APPENDIX D.GRAPHICAL PRESENTATION OF INTROGRESSED SEGMENTS IN ALL CHROMOSOMES, EXCEPT 3B,6B, AND 5A, FROM 04GC0139(RESISTANCE DONOR PARENT, YELLOW
SEGMENTS) INTO CDCGO (RED SEGMENTS) NEAR-ISOGENIC LINES.EACH BAR
REPRESENTS A GENOTYPE. THE GREY AND BLUE SEGMENTS INDICATE UNKNOWN AND HETEROZYGOUS ALLELES, RESPECTIVELY. ... 185
APPENDIX E.TABLE E.1.PEARSON’S CORRELATION COEFFICIENTS AMONG AGRONOMIC AND END-USE QUALITY TRAITS FROM CDCALSASK YIELD AND QUALITY PERFORMANCE TRIALS IN 2016 AND 2017. ... 186
APPENDIX F.TABLE F.1.PEARSON’S CORRELATION COEFFICIENTS AMONG AGRONOMIC AND END-USE QUALITY TRAITS FROM CDCGO YIELD AND QUALITY PERFORMANCE TRIALS IN
2016 AND 2017. ... 187
APPENDIX G.TABLE G.1.PEARSON’S CORRELATION COEFFICIENTS AMONG FUSARIUM HEAD BLIGHT (FHB) RESISTANCE TRAITS FROM FIELD AND GREENHOUSE EVALUATIONS FOR THE
BGRC3487/2*DT735 POPULATION. ... 188
APPENDIX H.TABLE H.1.THE NUMBER OF PARENTAL (NON-RECOMBINANT) CHROMOSOMES IN
160BCRILS FOR EACH OF THE 14 CHROMOSOMES AND DISTRIBUTION FOR EACH OF THE
TWO PARENTAL ALLELES (BGRC3487 AND DT735).TOTAL CHROMOSOME*BCRILS
COMBINATIONS =2240. AVERAGE NUMBER OF PARENTAL CHROMOSOMES =14.5. ... 189
APPENDIX I.TABLE I.1. CORRELATION OF PARENTAL CHROMOSOME NUMBERS WITH
xxiii
APPENDIX J.GENETIC LINKAGE MAPS FOR BGRC3487/2*DT735 POPULATION. THE POSITION OF CENTROMERE FOR LINKAGE GROUPS IS HIGHLIGHTED IN RED (WHERE KNOWN). ... 190
APPENDIX K.DIAGRAMMATIC EXPERIMENTAL WORKFLOW OF X-RAY PHASE CONTRAST
IMAGING (PCI) AND COMPUTED TOMOGRAPHY (CT) AT THE SYNCHROTRON. ... 203
APPENDIX L.POSITIONING OF CYLINDRICAL CROPPING VOLUME TO REMOVE SEED FROM THE FLORET TO ISOLATE THE RACHILLA + RACHIS NODE. THE AREA INSIDE THE CYLINDER WAS REMOVED PRIOR TO DOWNSTREAM ANALYSES. ... 204
APPENDIX M.A VOXEL INTENSITY HISTOGRAM REPRESENTING GRAYSCALE VALUE FOR AIR.205
APPENDIX N.SECOND-DERIVATIVE FOURIER TRANSFORM MID INFRARED (FTIR) SPECTRA OF SEVEN WHEAT GENOTYPES AT 12 DAYS POST-INOCULATION WITH FUSARIUM
GRAMINEARUM (FG). GENOTYPES WERE EITHER CHALLENGED WITH FG AT 105 SPORES/ML OR MOCK-INOCULATED WITH DISTILLED WATER. ... 206
xxiv
LIST OF ABBREVIATIONS
3-ADON – 3-acetyl deoxynivalenol15-ADON – 15-acetyl deoxynivalenol
AACC – American Association of Cereal Chemists AAFC – Agriculture and Agri-Food Canada
AUDPC – Area under disease progress curve BCx - Backcross
BCRIL – Backcross recombinant inbred line BMIT – Biomedical imaging and therapy CDC – Crop Development Centre
CIMMYT – International Maize and Wheat Improvement Center CLS – Canadian Light Source
CT – Computed/Computational tomography DArT – Diversity Array Technology
DON – Deoxynivalenol dpi – Days post inoculation
ELISA – Enzyme-linked immunosorbent assay FDK – Fusarium damaged kernel
FE – Fungicide efficacy Fg – Fusarium graminearum
FGSC – Fusarium graminearum species complex FHB – Fusarium head blight
GH – Greenhouse GP – Grain protein
HSD – Tukey’s honest significant difference INC – Incidence
IND - Index IR – Infrared
IWGSC – International Wheat Genome Sequencing Consortium LSD – Fisher’s least significant difference
MAS – Marker-assisted selection MB - Manitoba
NIL – Near-isogenic line NIV – Nivalenol
xxv PCI – Phase-contrast imaging
PDR – Percent disease reduction PFT – Pore-forming toxin-like
PITRE – Phase-sensitive X-ray image processing and tomography reconstruction POTAGE - PopSeq Ordered Triticum aestivum Gene Expression
QTL – Quantitative trait loci ROI – Region of interest
SAS – Statistical analysis software SEM – Standard error of mean SEV - Severity
SK – Saskatchewan
SNP – Single nucleotide polymorphism
SSR – Simple sequence repeat or microsatellite TW – Test weight
TKW – Thousand kernel weight FN – Hagberg falling number
1
CHAPTER 1
Introduction
Wheat (Triticum spp. L.) is one of the three most important cereal crops in terms of production and consumption, with an average world-wide production of over 650 million tonnes of annual production globally (Shewry 2009). Wheat is adapted to sub-tropical and temperate climates, while rice (Oryza sativa L.) can not be grown as successfully in temperate regions. Wheat is one of the most important field crops in Canada, particularly western Canada, in terms of production and area under cultivation (McCallum and DePauw 2008; Beres et al. 2018). Wheat was described by Newman (1928) as “the economic fairy to the industrial and commercial life of Canada, having built practically the whole economic structure of the Prairie Provinces”. Common wheat (Triticum aestivum L.) in Canada is classified into market/milling classes based on growth habit (winter or spring) and quality factors such as grain protein content, gluten strength, kernel hardness (hard or soft), and color (red or white) (McCallum and DePauw 2008). The wheat cultivars in western Canada are classified into one of the following classes: Canada Northern Hard Red (CNHR), Canada Prairie Spring Red (CPSR), Canada Western Amber Durum (CWAD), Canada Western Hard White Spring (CWHWS), Canada Western Red Spring (CWRS), Canada Western Red Winter (CWRW), Canada Western Soft White Spring (CWSWS), and Canada Western Special Purpose (CWSP). Canada Western Red Spring is the largest wheat class in terms of area under cultivation followed by CWAD.
Wheat production in Canada is affected by several different biotic and abiotic stresses; the major abiotic stresses are frost damage (in winter wheat) and drought/heat stress. Among biotic stresses, diseases caused by fungal pathogens are the most important although wheat streak mosaic virus (WSMV) has caused some localized outbreaks in some years (Burrows et al. 2016). Among diseases caused by fungal plant pathogens, there are five priority-one diseases in Canada for which a minimum level of resistance is required for cultivar
registration (Anonymous 2015b). Priority one diseases, in the Canadian context, are defined as those that are considered to cause harm significant enough to warrant regulation through the registration process and generally genetic resistance is only one of a number of effective management strategies. These five priority-one diseases are: Fusarium head blight (FHB, Fusarium graminearum Schw. [Petch]), leaf rust (caused by Puccinia triticina Eriks.), stem rust (caused by Puccinia graminis Pers.: Pers f. sp. tritici Eriks. E. Henn), stripe rust (caused by Puccinia striiformis Westend f. sp. tritici Eriks.), and common bunt (caused by Tilletia caries Bjerk. and Tilletia laevis Bjerk.).
2
Fusarium head blight, also known as scab or ear blight, can be caused by several species of Fusarium in the F. graminearum species complex (FGSC) (Shen et al. 2012). However, F. graminearum (telomorph: Gibberella zeae Schw. [Petch]) is the most common species in North America and other warmer wheat growing regions worldwide (McMullen et al. 2012). The pathogen not only results in shriveled light-weight, chalky colored kernels, regarded as Fusarium damaged kernels (FDKs) or tombstone, which reduce yield and also produce harmful mycotoxins. The presence of FDKs result in downgrading of the product at sale because the fungus destroys the starch granules, cell walls and endosperm protein (Bechtel et al. 1985; McMullen et al. 1997). Among the mycotoxins, type-B trichothecenes, namely deoxynivalenol (DON) and its acetylated forms (3-ADON and 15-ADON) are the most common. The DON mycotoxin, also known as vomitoxin, results in feed refusal and poor weight gain in animals and may cause health problems in humans over a certain threshold (McMullen et al. 1997, 2012). Due to concerns over toxin accumulation in the grain, many countries have imposed limits on toxin levels present in food and feed items (reviewed in Gilbert and Haber 2013).
Fusarium head blight did not make any noticeable impact in Canada until 1980 when eastern Canada witnessed the first epidemic followed by epidemics in 1993 and 1996 in western Canada (Sutton 1982; McMullen et al. 1997). Although the incidence of FHB in Manitoba has increased since 1984, the epidemic of 1993 in Manitoba was the worst ever reported in upper Great Plains of North America (Wong et al. 1992; Gilbert et al. 1994). It was after the 1993 and 1996 epidemics that wheat breeders and researchers showed concern and dedicated their efforts to research on this disease and the causal pathogen in addition to starting annual field and seed surveys for FHB (Gilbert and Tekauz 2000). In 1997,
researchers working on cereals in western Canada formed the Prairie Fusarium Task Force (PFTF) to identify research priorities and develop collaborative research projects to combat FHB. Since the epidemics of the 1990s in Manitoba, the disease spread westward and has caused epidemics in Saskatchewan and sporadically in Alberta (Gilbert and Haber 2013). The increased prevalence and incidence of FHB in western Canada was attributed to the increased proportion of 3-ADON chemotype producing population of F. graminearum, which is more aggressive, thus resulting in higher disease levels (Ward et al. 2008). Until the last few years, the proportion of 3-ADON and 15-ADON chemotypes was 1:1, however,
unpublished data from the Cereal and Flax Pathology program suggest that more than 80% of the F. graminearum isolates collected were 3-ADON (Gilbert et al. 2014; Randy Kutcher, personal communication).
3
Given that FHB influences every aspect of the grain industry, it is important to find ways to manage this disease by managing/controlling the pathogen and strengthening host resistance. The resistance to FHB in wheat is quantitative and highly influenced by environmental factors (Buerstmayr et al. 2009). The strategies to mitigate the disease include: judicious use of fungicides and adoption of cultural practices (four-year crop rotations with non-hosts and possibly tillage) to minimize pathogen inoculum from previous crops. Host defense can be strengthened by identification of new sources of resistance, the mapping and introgression of genes from new sources into elite, adapted lines. Several sources of FHB resistance are now available in common wheat, unlike durum wheat (Bai et al. 2018). Resistant germplasm utilized for FHB resistance breeding research can be grouped into: (i) spring wheat genotypes from Asia such as Sumai 3 and its Ning derivatives (China), Nobeoka Bozu (Japan), (ii) spring wheat from Brazil, i.e. Frontana, and (iii) winter wheats from Europe namely Praag 8 and Novokruma (Buerstmayr et al. 2009; Gilbert and Haber 2013). Sumai 3 is the most commonly used source in North American wheat breeding programs (McMullen et al. 2012). At the Crop Development Centre (CDC) of the University of Saskatchewan, the durum and bread wheat breeding groups are continually working to improve genetic resistance to FHB in their elite and advanced breeding lines. Improving resistance in durum wheat is particularly more challenging due to the lack of resistance in adapted elite lines or cultivars. The projects discussed in this dissertation stem from ongoing efforts at CDC to improve and understand the genetics of resistance to FHB in common and durum wheat. To improve resistance in bread wheat, Sumai 3 derived lines 04GC0137 and 04GC0139 were used to pyramid Fhb1, Fhb2, and Fhb5 genes, in addition to utilization of resistance (smaller effect) from locally adapted cultivars. For durum wheat, an emmer wheat landrace (BGRC3487) with Type-II resistance to FHB was identified and utilized for genetic mapping. The overall focus of thesis was on various aspects of utilization of an exotic source to improve FHB resistance in local elite wheat cultivars. The specific hypotheses and the corresponding objectives included in this PhD project/dissertation were:
1.1.Project hypotheses
1. The introgression of Sumai 3 derived gene(s) improves genetic resistance to FHB in Canadian hard red spring wheat varieties CDC Go and CDC Alsask, irrespective of their genetic background.
2. The introgression of three genes for resistance to FHB do not result in linkage drag (in terms of agronomic traits and grain quality) in Canadian hard red spring wheats CDC Go and CDC Alsask backgrounds.
4
3. Three FHB resistance genes, Fhb1, Fhb2, and Fhb5, derived from Sumai 3 do not interaction with triazole fungicides, in terms of disease reduction and DON accumulation.
4. The quantitative trait loci (QTL) for FHB resistance in tetraploid emmer wheat accession BGRC3487 can be mapped using SNP marker saturated genetic maps.
5. The rachilla is the part of the rachis in ‘Sumai 3’ and its derivatives are responsible for resistance to FHB.
1.2.Project objectives
1. To evaluate FHB resistance and DON accumulation in near-isogenic lines (NILs; in CDC Go and CDC Alsask backgrounds) carrying all possible combinations of Fhb1, Fhb2, and Fhb5.
2. To study linkage drag associated with introgressions of Fhb1, Fhb2, and Fhb5, in hard red spring wheat cultivars CDC Go and CDC Alsask.
3. To study the interaction of Fhb1 and Fhb5 in CDC Go NILs with metconazole (triazole) fungicide applied at 50% anthesis.
4. To develop high-density genetic maps of a durum wheat backcross recombinant inbred line (BCRIL) population and map QTL for resistance to FHB and compare it with previously mapped QTL.
5. To determine changes in biopolymer composition and tissue structure (using X-ray phase contrast imaging [PCI] and Fourier-transform infrared [FTIR]
spectroscopy) in NILs differing in FHB resistance during F. graminearum infection and relate these changes to specific FHB gene(s).
5
CHAPTER 2
Review of Literature
2.1. Wheat: brief history and production in CanadaThere is evidence that wheat cultivation began approximately 10,000 years ago as part of the ‘Neolithic Revolution’, representing a shift of human activity from hunting and gathering to domestication of crops and settled agriculture (reviewed in Shewry 2009). Diploid einkorn (genome AA) and tetraploid (genome AABB) wheats were the earliest cultivated, which most likely originated in Turkey (Heun et al. 1997; Nesbitt 1998). Hexaploid wheat (genome AABBDD) cultivation occurred approximately 9,000 years ago (Feldman 2001). The earliest cultivated wheats were mainly of landraces from wild populations. Reduced shattering at maturity was the first trait selected followed by the free-threshing kernels. The spread of wheat around the world is summarized by Feldman (2001). Briefly, wheat was introduced to Europe in 8,000 BP, followed by a movement northward to the Danube (7,000 BP) and across Italy, France, and Spain (7,000 BP), and finally to the UK and Scandanavia in about 5,000 BP. Wheat spread into Iran, central Asia, China, and Africa around 3,000 BP. It was introduced into Mexico and North America in 1529 and Australia in 1788.
In 2017, Canada produced approximately 29.9 million tonnes of wheat, including 4.9 million tonnes of durum wheat production (Anonymous 2018b). The majority of the wheat in Canada is spring grown and mainly occupies the area under production in the three Prairie Provinces, i.e. Alberta, Saskatchewan, and Manitoba. The Province of Saskatchewan
produces approximately 40% of the spring wheat in Canada. In durum wheat production, Saskatchewan is the leading province with about 83% of the durum production in Canada. Approximately 20.1 million tonnes of wheat, including durum, were exported from Canada in 2017.
2.2. Genomic constitution of wheat
Wheat is an allopolyploid, which means it has more than two complete sets of chromosomes per cell nucleus and has evolved through interspecific or intergeneric hybridization (Shewry 2009; Feldman and Levy 2012). The wild allotetraploid wheat T. turgidum ssp. dicoccoides (2n=4x=28, AABB), which is the direct progenitor of modern durum (T. turgidum L. ssp. durum) and bread (T. aestivum L.) wheat, evolved through a polyploidization event between T. urartu (AA genome) and an Aegilops speltoides-related species (BB genome), about half a million years ago (Huang et al. 2002). Allohexaploid bread wheat (2n=6x=42, AABBDD) evolved from a second round of intergeneric hybridization and chromosome doubling between the domesticated allotetraploid wheat, T. turgidum (AABB) and the diploid Ae. tauschii (2n=2x=14, DD), about 9,000 years ago (Huang et al. 2002; El Baidouri et al. 2016).
6
The combination of large diploid genomes in the polyploid wheat species resulted in large genomes, varying from 12 Gigabases (Gb) in durum wheat to 17 Gb in hexaploid bread wheat (IWGSC 2014), with a repetitive DNA content of over 80% (Paux et al. 2006). 2.3. Biotic stresses associated with wheat cultivation in Canada
Wheat cultivation in Canada is affected by various biotic and abiotic constraints. Among biotic constraints, several viruses, fungi and bacteria attack wheat crops and result in
diseases. The most common diseases are Fusarium head blight (FHB, caused by Gibberella zeae), leaf rust (caused by Puccinia triticina Eriks.), stem rust (caused by Puccinia graminis Pers.: Pers f. sp. tritici Eriks. E. Henn), stripe rust (caused by Puccinia striiformis Westend f. sp. tritici Eriks.), common bunt (caused by Tilletia caries Bjerk. and Tilletia laevis Bjerk.), tan spot (Pyrenophora tritici-repentis [Died.] Drechsler), septoria leaf spot (Septoria tritici Desm.), and wheat streak mosaic virus (Anonymous 2015). Among insect-pests, orange wheat blossom midge (Sitodiplosis mosellana Gehin) and sawfly (Cephus cinctus Norton) are important. In Canada, there are five priority-one diseases [three rusts, FHB, and common bunt] defined by the Prairie Recommending Committee for Wheat, Rye and Triticale (PRCWRT) for which a certain level of resistance is required for cultivar registration. Among these five priority-one diseases, rusts and bunts are relatively easy to breed for, however breeding for FHB resistance is a challenging task. Leaf and stem rusts are very well managed by long-term breeding efforts, however, still priority diseases to maintain good resistance in the germplasm and avoid any future epidemic outbreaks (McCallum et al. 2016; Brar et al. 2018b) The next sections of this Chapter are focussed on FHB.
2.4. Fusarium head blight: causal pathogen and disease epidemiology
The genus ‘Fusarium’ was named in 1809 when a German mycologist, Link, described a fungus having fusiform spores as Fusarium roseum (Booth 1971). Later, Schwabe described F. graminearum in 1838. Fusarium spp. exist in both anamorphic (asexual) and
teleomorphic (sexual) stages. The species overwinters on infested crop debris on the soil surface (Guenther and Trail 2005; Trail et al. 2005). Fusarium head blight (FHB) was first described in 1884 as “scab” by W.G. Smith (Arthur 1891) and later the names “Fusarium blight” and “fusariosis” were introduced by Atanasoff (1920; cited in Stack 2003) and Dounin (1926, cited in Stack 2003). Following first reports of the disease, FHB was widely recognized in 31 states of the USA by 1917. Around the same time, the disease was
recognized in other parts of the world including Europe and Japan. The disease made its first noticeable impact when an epidemic occurred in 1919, which affected the provinces of Manitoba and Saskatchewan in Canada (MacInnes and Fogelman 1923; cited in Stack 2003). One of the major factors of the 1919 epidemic was the widespread cultivation of the highly
7
susceptible spring wheat cultivar ‘Marquis’, which was introduced in Canada in 1908 (Stack 2003).
The risk of FHB has increased by several factors including changes in agricultural practices during the last few decades, which includes reduced or minimum tillage and a less diverse or complete abandonment of crop rotation (Prat et al. 2014). This is particularly important for the corn belt in the mid-western United States where rotations include only corn and wheat, and as a result produce a large amount of Fusarium inoculum (McMullen et al. 1997, 2012). About 80% of the durum in the United States is grown in North Dakota, thus it is even more important to manage FHB in North Dakota and adjoining areas (Otto et al. 2002).
Fusarium ascospores serve as the primary inoculum that infects cereal crops. Epidemics of the disease are governed largely by local and regional environments, although other factors, such as host resistance, pathogen population adaptation and aggressiveness, and the physiological state of the crop play a role (Osborne and Stein 2007). With frequent rains, high relative humidity and temperatures between 15-30˚C during anthesis and soft-dough stages of wheat the disease can devastate a healthy, high-yielding crop within a few weeks (McMullen et al. 1997). Each species in the F. graminearum species complex (FGSC) may have different biological and environmental requirements (Osborne and Stein 2007). For example, F. graminearum is favored by a wide range of temperature conditions up to 30˚C, whereas F. poae can grow well under lower temperature conditions up to 20˚C. That is the reason that F. poae is found more frequently in temperate climates and F. graminearum can be found in much of the geographical area affected by FHB. In spite of differences in temperature requirements, most of the species causing FHB can be recovered from most infected crops (Dufault et al. 2006 cited in Osborne and Stein 2007).
F. graminearum is a residue-borne fungus, which persists on corn or small grain cereal crop debris (McMullen et al. 1997, 2012) and on some pulse crop residues (mainly roots as the fungus is associated with some root diseases). Prolonged cool and wet conditions favour growth and sporulation of the fungus on residue. Conidia (asexual spores) or more likely ascospores (sexual spores) of the fungus attack cereal crops in favorable weather (Trail et al. 2005). F. graminearum can survive on crop debris buried under 20-25 cm of soil, however, its growth is favored only in the upper few centimeters of the soil profile (Leplat et al. 2013). Soil moisture is very important for ascospore production on crop debris, which is maximized when soil moisture is >80% and ceases at <30% (Osborne and Stein 2007). Soil compaction may affect spore production because it affects water availability. F. graminearum and F. nivale populations are limited in compacted soil due to poor water availability and
8
poor growth and mobility of the fungus. Soil aeration is important for the growth and survival of the fungus. Soil pH affects the fungal growth.
Mycelial growth and conidia formation of F. graminearum is affected by acidic and alkaline conditions, but the fungus can grow in media between pH 4 and 10 (Leplat et al. 2013). Minimum temperatures for ascospore production in residue are 7-10˚C and maximum 15-20˚C. In comparison to other FHB causing fungi, conidia formation and infection rates of F. graminearum are favored by relatively warm and wet conditions, only ascospore
production is favored by cooler conditions. Ascospore release from fruiting bodies (i.e. perithecia) is inhibited by prolonged high humidity (Osborne and Stein 2007), although ascospore viability depends on high relative humidity. In most of the cases, ascospores are sufficiently robust to retain viability after release from perithecia (Gilbert and Haber 2013).
Burning of crop residue reduces the amount of primary inoculum (Dill-Macky and Salas 2001). Spore (ascospores and conidia) dispersal occurs by wind or rain splash, thus dispersal distance is limited (Xu 2003); however, long distance dispersal of ascospores is also reported in rare cases (Maldonado-Ramirez et al. 2005 cited in Osborne and Stein 2007). Ascospores are ejected a few mm with force from perithecia and wind aids in dispersal to nearby plants (Trail et al. 2005). Rainfall is the major factor inducing rupture of the ascus wall. With increased relative humidity, osmotic pressure rises within the perithecium due to the entry of mannitol, potassium and chloride ions, thus releasing ascospores with force (Gilbert and Haber 2013).
Wheat and barley are most vulnerable to attack by Fusarium spp. from anthesis to soft dough stage (Schaafsma and Hooker 2007; McMullen et al. 2012). Wheat is most susceptible to F. graminearum, and the period 2-3 days prior to anthesis and a week after anthesis of critical importance (McMullen et al. 2012). Warm and humid weather triggers Fusarium head blight epidemics and the ratio of Fusarium diseased/damaged kernels to DON
contamination depends heavily on weather conditions (Mesterházy 2014). The DON content in grain was reported to be much higher in humid weather as compared to dry weather and analyses of long-term weather data indicated that the amount of precipitation is most important factor associated with increased disease incidence and toxin content. Toxin level in grain increases after heavy rains just prior to harvest (Mesterházy 2014). Mycotoxin production requires relatively more specific conditions than fungal growth. Maximum mycotoxin production is reported to be 30˚C. Rainfall is another major factor, in addition to temperature, leading to FHB epidemics. Severe flooding in the states of North Dakota, South Dakota and Minnesota in 1993, and precipitation greater than long-term normals in North
9
Dakota from 1993-1996, resulted in severe FHB epidemics in these major wheat growing regions of the USA (McMullen et al. 1997).
In addition to favorable environmental conditions, niche availability is another major factor in pathogen abundance in affected areas. In the Great Plains of the USA, maize is largely grown in rotation with wheat (Osborne and Stein 2007; Gilbert and Haber 2013), and it is a host of F. graminearum, so there is a regular supply of infected plant material. The maize-wheat rotation is accompanied by zero or minimum tillage practices in the USA, which provides enough crop debris to the over-wintering pathogen for ascospore production. The area under maize production has greatly increased in the northern Great Plains in recent decades. Thus, increased area under maize and zero or minimum tillage practices has led to a large reservoir of fungal biomass (Osborne and Stein 2007).
2.5. FHB management strategies
There is agreement in the literature that no single strategy is sufficient to protect yield and quality in FHB epidemic years; an integration of different strategies is the best (reviewed in McMullen et al. 1997; Gilbert and Tekauz 2000; McMullen et al. 2012; Gilbert and Haber 2013; Wegulo et al. 2015; Dweba et al. 2017). A combination of host resistance (varietal selection), cultural practices (tillage and crop rotation), fungicide application with use of decision forecast systems (e.g. FHB and DON prediction models) can facilitate efficient management of the disease; although the effectiveness of these practices may vary depending on weather conditions during the growing season, particularly just before, at, and just after the anthesis growth stage. In Canada, winter wheat usually escapes FHB damage because the early anthesis stage is asynchronous with the peak inoculum production of most Fusarium species (Beres et al. 2018).
Two important cultural practices for the mitigation of FHB of cereal crops are: tillage and crop rotation, both are based on avoiding or limiting the exposure of small grain cereals to spores/inoculum at the anthesis stage (Sutton 1982; Pereyra and Dill-Macky 2008). Tillage operations bury the host crop residue in soil and crop rotation employs the seeding of a non-host crop following wheat. Burning of crop residue decreases the amount of inoculum, however, this is not an environmental acceptable practice (Salas and Dill-Macky 2005). Some other cultural practices to manage FHB such as staggered seeding dates and increasing the fan speed of the combine while harvesting are possible, although not very popular among growers (McMullen et al. 2012; Beres et al. 2018). In Canada, preliminary results indicated some success in escaping FHB in spring wheat by very early planting when soil temperatures are as low as 2°C (Beres et al. 2018). Other than cultural practices, fungicide application and cultivar resistance are the most important strategies of an integrated FHB management plan.