Bread-making quality in a changing climate:
In search of climate stable genotypes and
robust screening methods for wheat
Sbatie Lama
Introductory Paper at the Faculty of Landscape Architecture, Horticulture and Crop Production Science, 2020:3
Swedish University of Agricultural Sciences, Alnarp, Sweden
robust screening methods for wheat
Sbatie Lama
Place of publication:
Year of publication:
Title of series:
Number of part of series
Cover pictures Cover pictures by Online publication Keywords Alnarp, Sweden 2020
Introductory paper at the faculty of Landscape Architecture,
Horticulture and Crop Production Sciences
2020:3
From left to right (top): Various seasons
From left to right (bottom): Heading stage of spring wheat,
matured wheat plants, wheat grains and wheat bread.
Sbatie Lama, except 2nd and 5th pictures (top); from the left
are by Momotaz Begum, Bangladesh and Martin Ewertson,
Sweden, respectively.
https://pub.epsilon.slu.se
Bread-making quality, climate variation, G x E, grain protein
concentration, wheat gluten, protein polymerization, stability
Swedish University of Agricultural Sciences
Faculty of Landscape Architecture, Horticulture and Crop Production Science Department of Plant Breeding
Wheat is one of the major crops in the world serving as an important source of nutrients for human consumption. Fluctuating climate with increasing heat, drought and precipitation, as well as rising concentration of CO2 has been found to significantly affect yield and quality of wheat worldwide. This
introductory paper presents latest overview on the effect of fluctuating climate on wheat yield and gluten protein quality with emphasis on bread-making quality in Sweden and worldwide. Wheat gluten protein quality, as the main determinant of bread making quality, has been discussed in relation to the impact from the climate change. The concentration of gluten proteins and the gluten protein types are greatly affected by the varying climate and by the rate and timing of nitrogen fertilizer. Breeding for wheat quality stability is one of the main strategies to tackle climate induced variation in wheat quality and to ensure food security in the world. Therefore, the urgent need is to develop wheat varieties that are adapted to climate fluctuations and could deliver consistent yields and sufficient qualities of the wheat flour for bread and other products over different locations and years. In regard to this, still several challenges exist, and these include a need of efficient and accurate methods to evaluate wheat quality stability, which has been briefly discussed in this paper. Use of latest modern analytical and breeding tools such as, proteomics and a high throughput plant phenotyping (HTPP), as potential ways to improve the genotype selection efficiency in breeding process have been also discussed. In addition, crop performance prediction models based on simulation and gene mapping may improve the selection efficiency and speed up the breeding process to develop new climate resilient wheat varieties. Currently used methods for assessing wheat flour quality and its suitability for bread-making by wheat breeders and the millers are classical rheological tests evaluated by farinograph, alveograph, extensograph and empirical tests such as, sedimentation volume measurement and bread baking. A large number of these quality tests together with great amount of wheat grains (2–5 kg) are required, are the challenging factors requiring new robust and efficient methods for wheat flour and bread quality evaluation. Therefore, a need to develop small scale reliable tests for assessing flour quality for bread-making is of high relevance for wheat breeding and baking industry. Combination of different small scale wheat quality screening tests, modern breeding tools and crop performance prediction models is needed in order to improve selection efficiency in development of climate stable wheat varieties.
Contents
Abstract ... 3 List of tables... 5 List of figures ... 6 Abbreviations ... 7 1. Introduction ... 82. Effect of climate change on wheat production: a Swedish and World perspectives ... 11
3. Wheat yield and quality stability: challenges and evaluation ... 13
4. Gluten and its relation to the bread-making quality ... 14
5. Effect of genotype and environment on gluten quality in wheat ... 19
5.1. Protein concentration in wheat ... 19
5.2. Gluten polymerization and dough strength ... 21
5.3. Genetic composition of gluten proteins ... 22
6. Plant breeding and latest methods to evaluate quality stability in wheat ... 23
6.1. Proteomics ... 23
6.2. High throughput plant phenotyping (HTPP) ... 24
7. Crop adaptation and crop quality prediction models ... 25
7.1. Crop simulation models for assessing end-use quality of wheat ... 25
7.2. Gene based crop quality prediction models ... 26
7.3. Climate model ... 27
8. Methods for assessing bread making quality in plant breeding and baking industries ... 28
8.1. Classical tests ... 28
8.2. Conventional tests ... 30
8.3. Bread baking ... 32
9. Conclusions ... 33
List of tables
Table 1: Abbreviations used in this introductory paper ... 7
List of figures
Figure 1: World's top 10 wheat producers, exporters and importers in 2018 (million tonnes). Data source: FAO 2020. ... 8
Figure 2: Wheat production in Sweden in 2019. (a) Wheat harvested areas; (b) Production of winter wheat and spring wheat in 2019 (thousand tonnes). Data source: Jordbruksverket 2020. ... 12
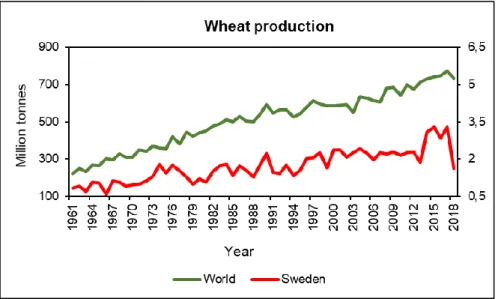
Figure 3: Wheat production in the world and in Sweden. Data source: FAO 2020. ... 13
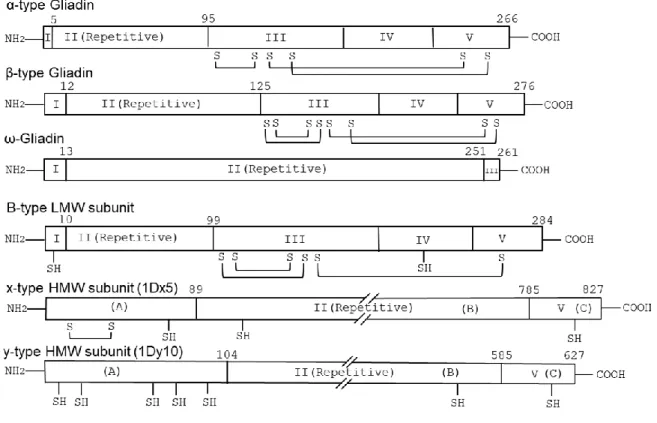
Figure 4 : General structures of wheat gluten proteins. The structures are showing the main domains, number of amino acid residues, conserved cysteine residues (SH) and intramolecular disulfide bonds (lines connecting S S). The sections in α-, β-, ω-gliadin, B-type LMW subunits, x- and y- type HMW subunit are reproduced from Anderson et al. 2012 and Schmid et al. 2017. The disulfide bonds and conserved cysteine residues (SH) are reproduced from Shewry et al. 2003; Anderson et al. 2012; Koehler and Wieser 2013. The number and position of the amino acid residues are reproduced from Shewry et al. 2003. Reproduction of the structures is done with kind permission from Cereal Science, Elsevier and Springer Nature. ... 16
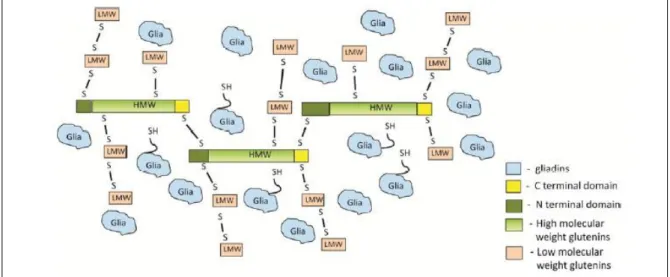
Figure 5: Theoretical structural model of gluten proteins network; borrowed from Johansson et al. 2013, with kind permission from Cereal Chemistry. ... 17
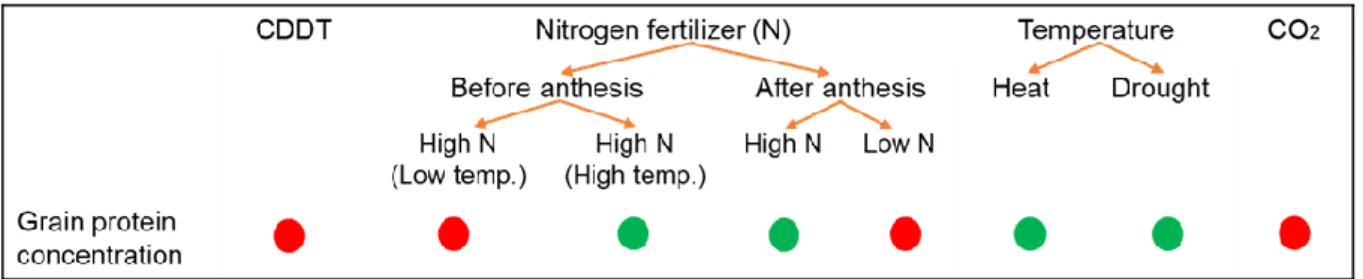
Figure 6: Summary of the effect of genotype, agronomic and environmental parameters on wheat grain protein concentration. Circles indicate positive (green color) and negative (red color) relation between the parameters and the grain protein concentration; CDDT stands for cultivar-determined development time. ... 20
Figure 7: A typical Reomixer curve of wheat dough; mixing curve parameters A1-A5 and B1-B5 determined at different development time T (minutes). ... 29
Figure 8: General principles and reagents used in three physico-chemical tests of wheat flour. ... 30
Abbreviations
Table 1: Abbreviations used in this introductory paper
Abbreviation Meaning CDDT Da GPC G x E HMW-GS HTPP LMW-GS mln. MW NDSI PCA SDS SIG GCM GS SNP SRC t. UAV %UPP
Cultivar-determined development time Dalton
Grain protein concentration
Genotype and environment interaction High-molecular-weight glutenin subunits High throughput plant phenotyping Low-molecular-weight glutenin subunits Million
Molecular weight
Normalized to difference spectral index Principle component analysis
Sodium dodecyl sulfate Swelling index for glutenin General circulation models Genomic selection
Single nucleotide polymorphism Solvent retention capacity Tonnes
Unmanned aerial vehicle
1. Introduction
Wheat (Triticum aestivum) is one of the major crops grown worldwide. In 2018, wheat was the third most produced cereal in the world (734.05 million tonnes (mln.t.)) after maize (1147.7 mln.t.) and rice (782 mln.t.), which was grown in the largest area of land (214.3 mln. ha) comparing with rice (167.1 mln. ha) and maize (193.7 mln. ha) worldwide (FAO 2020). World’s top 10 wheat producers, exporters and importers in 2018 are shown in Figure 1 (FAO 2020). The annual harvest of wheat contributes to approximately 21% of the world’s food (Enghiad et al. 2017). Wheat is rich in carbohydrates and is a major source of plant-based protein in the human diet, which provides more than 20% of the total human protein consumption (Würschum et al. 2016).
Figure 1: World's top 10 wheat producers, exporters and importers in 2018 (million tonnes). Data source: FAO 2020.
Wheat is a versatile crop and flour from wheat is extensively used to produce a wide range of end-use products as for example, bread, pasta, cookies, pastries, noodles etc. With the increasing population in the world, growing urbanization and changing life style, the demand for wheat-based food products is increasing (Pena 2007). Production of sufficient wheat grain amounts with desired quality and feeding the growing population, as well as keeping the price of wheat-based food products affordable for everyone are important goals of future food security (Engliad et al. 2017).
Global temperature is increasing, and one of the latest examples is the year 2018, being one of the warmest years in the world since 1880 (NASA 2019). At present, the average global surface temperature is about 1 oC higher than the average temperature observed in 1880 (NASA 2020a). Climate variation
et al. 2019). Drought and extreme heat is projected to reduce global cereal production by around 10% (Amos et al. 2014; Corey et al. 2016), where wheat production is estimated to decrease by 6% for each degree Celsius rise (Akter and Islam 2017). According to the International Food Policy Research Institute with the present rate of rising global temperature (0.3% every decade) wheat yields may decrease by 50% in South Asia, Southern Europe and in large parts of the Mediterranean region by 2050 (EEA 2018). In Northern Europe, including Sweden, crop growing conditions are projected to improve; however, there might be extreme climatic events such as, heat and drought, which might outweigh the good growing conditions for wheat. Overall, severe future climate fluctuations are expected to reduce wheat yields throughout Europe (EEA 2018) and in the world, and increase global wheat prices, which negatively will affect food security (Enghiad et al. 2017).
Bread-making quality of wheat is influenced by the climatic variations and weather extremes (Johansson et al. 2020). The bread-making quality of the wheat flour is impacted by the total grain protein concentration (GPC) and to a large extend is determined by the composition of the gluten proteins (Xue et al. 2019; Wiser 2007; Chaudhary et al. 2016). Commonly, high amounts of so called polymeric gluten proteins, are known to be responsible for high both the gluten strength in dough and the bread loaf volume (Randall and Moss 1990; Johansson et al. 1999; Pena 2007).
Higher temperatures and drought reduce the duration of grain maturation period (Altenbach 2012), which leads to higher GPC and protein polymerization, and lowers accumulation of starch (Altenbach 2012; Malik et al. 2012). Although, benefits of higher temperature on bread-making quality of wheat can be attained only up to 30 οC (Randall and Moss 1990). Temperatures higher than 30 οC are known to
impact the bread-making quality negatively (Randall and Moss 1990; Stone and Nicolas 1994; Ciaffi et al. 1996), which might be due to the production of heat-stress proteins in gluten (Blumenthal et al. 1990; Blumenthal et al. 1993). It was assumed that heat-stress proteins change the accumulation and folding of gluten protein in the grain, thus affecting the dough formation capacity of the wheat flour (Blumenthal et al. 1998).
High precipitation increases moisture content in the grain which increases α-amylase activity. In contrast, in lower precipitation α-amylase activity was found to be lower and thus higher bread-making quality (Johansson 2002). In general, higher nitrogen rate is known to increase the GPC (Johansson et al. 2002; Xue et al. 2016; Savill et al. 2018), however, at higher temperature nitrogen application seemed to have little or no effect on GPC (Johansson et al. 2005; Dupont et al. 2006; Koga et al. 2015). Milling industries require stable quality of wheat grains in order to produce even quality flour and bread every year (Battenfield et al. 2016). Decreased wheat yields and quality of grains result into increased import of bread quality wheat from other countries. Severe climate fluctuations cause variation in wheat grain and flour quality yearly and increase economic uncertainties and losses for milling and baking industries. In order to maintain food security and stable economy of the industries that produce wheat grains and processed products from wheat there is an urgent need to develop strategies for climate stable wheat.
Breeding is one of the main tools to tackle climate change and ensure food security in unfavorable climatic conditions (FAO 2009). Wheat breeding is a relatively slow process that requires 7-12 years to
release a new wheat variety (Dreccer et al. 2012). Thus, in order to develop climate stable wheat varieties the breeding process needs to take a start as soon as possible.
Proteomics might be an important tool in the new era of wheat breeding, which provides a better understanding of stress coping mechanisms in plants (Das et al. 2015; Eldakak et al. 2013). Identifying types and amounts of stress responsive proteins in the grain (Sancho et al. 2008; Hashiguchi et al. 2010) can be a very useful data helping with integration of the genomics information, which can potentially help to select the breeding lines more effectively (Das et al. 2015). In addition, the breeding line selection can be improved with high throughput plant phenotyping (HTPP), which makes selection of breeding lines more accurate and efficient on a basis of phenotype, thus leading to more improved varieties. However, several bottlenecks in the effective selection of the breeding lines still exist (Dreccer et al. 2012; Araus et al. 2018). In addition, different crop performance prediction models (for yield and quality) such as, simulation and gene-based models are important tools to increase the number of possible genotypes considered for selection and to speed up the breeding cycle (Battenfield et al. 2016). Prediction models can be also used to increase the genetic adaptation (Ramirez-Villegas et al. 2015).
Actual assessment of end-use quality characteristics of wheat flour is highly desirable for wheat breeders at early segregating generations (F2–F4), particularly in pedigree methodology (Li et al. 2015). However, important rheological dough tests that involve mixing of wheat flour to dough (e.g. farinograph, mixograph etc.) and bread baking tests are time consuming and require large quantity of flour, are mainly done in the end of the wheat breeding process. Often promising wheat varieties in terms of high yield and good agronomic performance, are not released because of their poor end-use quality (Battenfield et al. 2016). Small scale physico-chemical methods such as, sedimentation volume, swelling index for glutenin (SIG) and solvent retention capacity (SRC) are promising methods for gluten quality screening in addition to the classical rheological tests performed by farinograph and mixograph. However, more optimization is needed towards development of new physico-chemical methods in regard to low-cost, speed and reliability (Guzman et al. 2015).
This paper points out few main challenges in defining and evaluating bread-making quality stability in wheat in the current climate context. The effects of climatic variations on the wheat quality with emphasis on protein quality characteristics are discussed. This paper also brings new aspects regarding the use of advanced techniques such as, proteomics, HTPP and quality prediction climate models that might be helpful in developing of climate stable wheat. Different rheological methods (mixograph, farinograph and extensograph) and physico-chemical methods (SDS sedimentation, SRC and SIG) for bread-making quality evaluation are also discussed in this paper.
2. Effect of climate change on wheat production: a
Swedish and World perspectives
The global climate is fluctuating and this fluctuation includes e.g. increasing temperatures, intense heat waves, long drought periods, changes in rainfall patterns, rising concentration of CO2 etc., all factors
significantly affecting crop growth and production (NASA 2020b; Hashiguchi et al. 2010). The optimum temperature at anthesis and grain filling stages for wheat was reported to be around 21 oC (Porter and
Gawith 1999; Mäkinen et al. 2018). In Nordic countries, is has been stated that the temperatures between 15 oC to 20 oC facilitate maximum accumulation of starch (Dupont and Altenbach 2003;
Johansson et al. 2005, and thus provide higher yield comparing with the wheat grown above 21.5 oC
temperature (Uhlen et al. 2015).
On a global level, the latest studies showed that climate change is reducing global wheat yields by 0.9% (Ray et al. 2019). In Australia, due to the lack of water supply wheat yield has been reduced by 27% over the period from 1990 to 2015 (Hochman et al. 2017). In Europe (excluding Scandinavian countries), during the period of 1976–2005 the wheat yield decreased between 0.04 and 0.09 tonnes/ha/year due to the changes in the temperature and solar radiation, respectively, with the strongest decrease in yield in Greece and Romania, 0.09 and 0.07 tonnes/ha/ year, respectively (Supit et al. 2010a and 2010b).
Climate variation and high wheat growing temperature might also increase wheat production, especially in the Nordic countries (Qian et al. 2016; Hochman et al. 2017; Asseng et al. 2019). For example, globally, wheat yield is projected to increase by 7% due to warmer temperatures in combination with higher CO2 and lower rainfall (Asseng et al. 2018). While in Canadian prairies, due to warmer
temperature wheat production is projected to increase by 26-37% during the period of 2041 – 2070 (Qian et al. 2016). Furthermore, wheat production is expected to be higher at higher concentration of CO2 as was observed in Australia and Canadian prairies e.g. CO2 increased yield by 4% and up to 22%,
respectively (Qian et al. 2016; Hochman et al. 2017).
In Sweden, wheat is one of the main crops produced for food and feed, where around 15% of arable land is used (Lantmännen 2020) with main production in Southern Sweden (Figure 2a) (Jordbruksverket 2020). There are two types of wheat grown in Sweden, winter and spring. Production of winter wheat is much larger than the production of spring wheat (Figure 2b) (Jordbruksverket 2020). Since 2010, the average production and area used for wheat production in Sweden is 2.5 mln.t. and 412 thousands ha (FAO 2020). Consumption of wheat based products such as, bread and other processed products, is very popular in Sweden. Since 1960, the total per capita consumption of bread and pastries have increased by 73% and 41.8% in Sweden (Jordbrukverket 2018). Thus, bread and wheat based products are very important food for Swedish society, and the steady production of these products under varying climate is essential for food security.
a) b)
Figure 2: Wheat production in Sweden in 2019. (a) Wheat harvested areas; (b) Production of winter wheat and spring wheat in 2019 (thousand tonnes). Data source: Jordbruksverket 2020.
In Sweden, temperature increase might be higher than in the rest of the world (Klimat- och Sårbarhetsutredningen 2007). At present, an average temperature in Sweden is 1.7 oC higher, whereas,
the average global temperature is around 1 oC higher, since the preindustrial period (1860-1899) (SMHI
2020). As consequence, winters are becoming shorter, rain and melting periods are becoming more common which affects the snow cover and heating (SMHI 2020).
On average, Swedish wheat production is increasing since 1966 with substantial fluctuation. However, recent fluctuations (since 2013) are more dramatic comparing with the World’s wheat production. For example, summer in 2018 was one of the hottest summers since 1961 in Sweden (SMHI 2018). Average temperature in 2018 was 5 oC higher than in 2017 (http://www.ffe.slu.se/lm/LMHome.cfm?LMSUB=1).
Figure 3: Wheat production in the world and in Sweden. Data source: FAO 2020.
Latest years weather fluctuations effected quality to a large extent (Lantmännen 2019). In 2018, Sweden had 50.9% lower wheat production comparing with the production in 2017 (Figure 3) (FAO 2020). Both in 2017 and 2018, Sweden had higher import and lower export comparing with the import and exports during several other years (Jordbruksverket 2019).
3. Wheat yield and quality stability: challenges and
evaluation
In the scenario of climate change there is a need to develop wheat varieties with good yield and quality in a wide range of climates in order to deal with food insecurity (Eldakak et al. 2013), economic instability for the milling and baking industries (Peterson et al. 1992) and to provide breeding material for future breeding programs (Mut et al. 2010).
“Stable wheat” are wheat varieties that perform well both agronomically and in regard to end-use quality across a wide range of environments, and also provide consistent yields over locations and years (Peterson et al. 1992; Lemelin et al. 2005; Johansson et al. 2020). For selecting climate stable wheat genotypes, genotype (G), environment (E), and G x E interactions are of high importance (Johansson et al. 2020). The G x E interaction has been found higher in greater climatic variability and the wheat varieties were found to perform differently in different environments (Dreccer et al. 2012). Thus, it is difficult to identify one single genotype that can provide stable yield and quality under all climatic variations (Kahiluoto et al. 2019). Moreover, yield and many quality parameters are normally negatively correlated e.g. if the yield is increasing the grain protein concentration tends to decrease (Daniel & Triboi 2000; Johansson et al. 2005; Bogard et al. 2011; Koga et al. 2015). Thus, it is rather challenging to obtain superior and stable yield and quality characteristics of the wheat varieties over different years.
Wheat quality is defined differently by different stakeholders such as, farmers, millers, bakers and consumers (Guzman et al. 2016). For example, a test weight is important for millers, while gluten quality is important for bakers (Guzman et al. 2016). For baking, selection of genotypes with stable quality is complex, since two important protein parameters determining bread making quality such as, gliadins (determining extensibility) and glutenins (strength), are negatively correlated under varying climate (Randall and Moss 1990; Johansson et al. 2013; Uhlen et al. 2015). Researchers observed that genotypes that are more stable for some quality parameters e.g. thousands kernel weight, farinograph absorption and Zeleny sedimentation volume, are less stable for GPC and dough stability in the varying climate (Koppel and Ingver 2010; Mut et al. 2010). Thus, obtaining stability in all the quality parameters is a difficult task.
Till now there is no defined method on how to measure wheat quality stability. In few studies few statistical approaches were suggested to select stable genotypes (Lemelin et al. 2005; Mut et al. 2010). One of the most used approaches is the selection of stable genotypes that show smallest environmental variance in the yield and quality parameters (Lin et al. 1986; Lin and Binns. 1988; Robert et al. 2002; Lamelin et al. 2005; Mut et al. 2010; Changizi et al. 2014). Another approach is selection of genotype based on a smaller co-efficient of variability (Koppel and Ingver 2010; Rozbicki et al. 2015). Principle component analysis (PCA) has been used to assess crop yield and quality performance stability (Purchase et al. 2000; Mut et al. 2010; Vazquez et al. 2018). However, PCA clusters indicated multivariate data and transformed these data into univariate data. Clustering all quality data into univariate data might provide misleading results. Therefore, a use of multiple statistical approaches would be helpful to select stable genotypes; though with an increase in the complexity of the selection procedure.
4. Gluten and its relation to the bread-making quality
Wheat grain storage proteins are divided into two groups namely, gluten protein and non-gluten protein. Gluten proteins constitute of 80-85%, while non-gluten proteins constitute of 10-15% of total wheat protein (Veraverbeke & Delcour 2002; Thewissen et al. 2011). Majority of non-gluten proteins are monomeric, smaller in size (25,000-70,000 Da) and are soluble either in water or different concentrations of salt solutions at higher temperature, are called albumins and globulins. Non-gluten proteins might also play a role in bread-making quality however, their exact contribution is not very well understood (Veraverbeke and Delcour 2002; Kuktaite 2004). Previous studies had shown, that albumins and globulins are present in gluten phase of dough samples and their compositions varied in the fractionated dough phases such as, liquid and gel (Kuktaite et al. 2003; Kuktaite et al. 2004). Thus, these proteins might have some effect on bread-making quality.
Gluten, being the main endosperm storage protein of wheat seeds, is very important for determining the end-use quality characteristics of flour (Goesaert et al. 2005). Wheat flour mixed with water forms unique viscoelastic properties of gluten dough and make it suitable to produce different food products (Li et al.
2015). Gluten proteins are divided into monomeric gliadins and polymeric glutenins. According to Osborne solubility classification, gliadins are soluble in aqueous alcohols (60–70% ethanol), whereas glutenins are soluble in aqueous alcohols only after reduction of disulfide bonds (Schmid et al. 2016). The hydrated gliadins have less elasticity and cohesiveness than glutenins thus, contribute mainly to viscosity and extensibility of dough (Wieser 2007). Glutenins are large polymers made from protein subunits connected by disulfide bridges. Hydrated glutenins are cohesive and elastic, and ~20–40 mg per gram of wheat flour is strongly correlated with dough strength and bread loaf volume (Wieser 2007). Extensibility ensures the slippage of proteins to form segments between entangled networks of polymeric proteins whereas strength prevents disruption of the entanglements (Sroan et al. 2009). A combination of extensibility and elasticity, and balance between these two is vital to determine the bread-making quality of wheat flour (Sroan et al. 2009; Li et al. 2015).
Gliadins are classified mainly into four groups based on the electrophoretic mobility at low pH: 𝛼-, β-,
𝛾-and 𝜔- gliadins (Woychik et al. 1961). Based on the similarity of amino acids and DNA sequences between 𝛼- and β- gliadins, they are generally recognized as “𝛼 -type’’ gliadins (Shewry and Tatham 1990). The molecular weight of gliadins ranges from 25,000-75,000 Da. Alfa-type and 𝛾- gliadins are cysteine (sulfur) rich whereas, most ω-gliadins are cysteine (sulfur) poor (Shewry 2019). There are six cysteine residues in 𝛼/β-gliadins and eight cysteine residues in γ-gliadins. Disulphide bonds are present as intra-chain crosslinks in all of them (Wieser 2007) (Figure 4). The viscosity of dough comes from the presence of these intra-chain disulphide bonds in 𝛼-type and 𝛾- gliadins (Quester et al. 2014). Presence of hydrophilic and hydrophobic parts make 𝛼-type and 𝛾- gliadins highly surface-active thus, making them able to absorb onto a hydrophobic surface (Thewissen et al. 2011). Surface active compounds increase the gas holding ability of the dough and stability of the gas cells in the bread (Gan et al. 1995; Örnebro et al. 1999). Thus 𝛼 -type and 𝛾- gliadins play key roles in dough viscosity and extensibility. However, two ω- gliadins subunits (15+16) at Gli-D1 locus closely linked with Glu-D3 locus which contains a number of genes important for bread making quality. It has been found that ω-15+16 subunits significantly influence the dough strength and pan type of bread-making quality (Wang et al. 2008). It is assumed that ω-gliadins may also form hydrogen bonds in the dough thus, contributing to the viscosity (Wang et al. 2008). General structure of different wheat gluten proteins are shown in Figure 4.
Figure 4 : General structures of wheat gluten proteins. The structures indicate the main domain, number of amino acid residues, conserved cysteine residues (SH) and intramolecular disulfide bonds (lines connecting S S). The sections in α-, β-, ω-gliadin, B-type LMW subunits, x- and y- type HMW subunit are reproduced from Anderson et al. 2012 and Schmid et al. 2017. The disulfide bonds and conserved cysteine residues (SH) are reproduced from Shewry et al. 2003; Anderson et al. 2012; Koehler and Wieser 2013. The number and position of the amino acid residues are reproduced from Shewry et al. 2003. Reproduction of the structures is done with kind permission from Journal of Cereal Science, Elsevier and Springer Nature.
Glutenins consist of two different types of proteins high- and low-molecular-weight glutenin subunits (HMW-GSs and LMW-GSs). High molecular weight-GSs are regarded as backbones and the LMW-GS are regarded as the extenders and chain terminators (Masci et al. 1998; Wieser 2007; Johansson et al. 2013). A theoretical structural model of gluten protein network presented in Figure 5 is showing how different HMW-GSs joined by inter-chain disulphide bonds form a backbone and LMW-GSs are cross-linked to each other and to the backbone by inter-chain disulphide bonds.
Figure 5: Theoretical structural model of gluten proteins network; borrowed from Johansson et al. 2013, with kind permission from Cereal Chemistry.
The LMW-GSs comprise around 20% of total gluten proteins. According to the molecular weight of the subunits, LMW-GS could be classified into , C-, and D-types subunits (Shewry 2019) (Table 1). B-type subunits (40,000-50,000 Da) are the main group of LMW-GS, while C- (30,000-40,000 Da) and D- types are minor groups (modified forms of gliadins) (Lew et al. 1992; Wang et al. 2016; Shewry 2019). LMW-GSs are related to 𝛼/β and 𝛾 gliadins in their molecular weight (MW), and have similarities in amino acid sequence and presence of cysteine residues (Shewry 2019). A summary of the types and characteristics of wheat gluten proteins is presented in Table 1. Presence of extra two cysteine residues makes LMW-GSs able to form both intra- and inter -chain disulphide bonds with other glutenins (Figures 4 and 5). Thus, LMW-GSs contributes to form longer chains and bigger polymer sizes compared to the gliadins. Different studies have shown, that big gluten polymer size positively correlates with very good bread-making quality (Veraverbeke & Delcour 2002; Wieser 2007; Johansson et al. 2013). Higher expression of B-type glutenin protein is known to responsible for increased gluten strength (De Santis et al. 2017) whereas, C and D types are known to negatively affect dough rheological properties (Giuliani et al. 2015).
HMW-GSs are the most important proteins for determining bread-making quality. Around 60% of the variation in bread making quality is considered to be contributed by the variation of HMW -GSs (Payne et al. 1987). HMW-GSs consist of repetitive central domains rich in glutamine, proline and glycine, and poor in cysteine (sulphur) (Gianibelli et al. 2001). The repetitive β- turns in the central domain form an elastic β-spiral similar to the mammalian connective tissue protein elastin (Tatham et al., 1985), which gives to a protein a rigid rod-like structure (Veraverbeke & Delcour 2002). Formation of intra-chain hydrogen bond between the glutamine rich domains in HMW-GSs is another possible reason behind elasticity in wheat dough (Belton 1999).
There are 3-6 HMW-GSs that are reported in wheat genotypes (Johansson et al. 2013). These are further divided into two types based on their molecular weight, x-type subunit (80,000 - 90,000 Da) and y-type subunit (65,000 – 75,000 Da) (Veraverbeke and Delcour 2002; Shewry 2019) (Table 2). The
number and distribution of cysteine residues in HMW-GSs are considered to be the main reason behind dough elasticity. Cysteine residues are potential sites for the formation of intermolecular disulfide bonds (Shewry et al. 1995). The total number of cysteine residues in x and y-type subunit is four and seven, respectively (Figure 4). The x-type subunit, 1Dx5 has one extra cysteine residue (Veraverbeke & Delcour 2002). In both x- and y-type subunits, majority of the residues are positioned in the N terminal end of the protein (Veraverbeke & Delcour 2002) (Figures 4). In spite of having a lower number of residues in x-type subunits, the studies have shown a higher effect of x-type subunit on dough elasticity (Wieser & Kieffer 2001; Wieser 2007). However, the biochemical mechanisms of this effect of x-type subunit on dough elasticity is not yet fully understood.
Table 2: Summary of the types and characteristics of wheat gluten proteins from Shewry 2019.
Gluten protein type Molecular mass (Dalton)
Total gluten fraction (%)
Polymers or monomers
Partial amino acid composition (mol %)
HMW prolamins
HMW subunits 65-90,000 6-10 Polymers 30–35% glutamine, 10–16% proline, 15–20% glycine, 0.5–1.5% cysteine, 0.7–1.4% lysine S-rich prolamins 𝛼 -gliadins 𝛾 -gliadins
B-type and C-type LMW subunits 30-45,000 70-80 Monomers Polymers 30–40% glutamine, 15–20% proline, 2–3% cysteine, <1% lysine S-poor prolamins
ω-gliadins 30-75,000 10-20 Monomers 40–50% glutamine, 20–30% proline, 0–0.5% phenylalanine, 0–0.5% lysine, 0 cysteine,1 cysteine residue in D-type LMW subunits D-type subunits LMW subunits Polymers
5. Effect of genotype and environment on gluten quality
in wheat
The effect of G, E (climate and growing conditions etc.) and interaction G x E on the total protein concentration and gluten protein types are discussed below.
5.1. Protein concentration in wheat
Grain protein concentration (GPC) is a typical trait of nutritional quality in wheat determined by QTLs (Prasad et al. 1999; Groos et al. 2003). It is rather difficult to find stable QTLs for GPC since GPC is highly polygenic (Prasad et al. 1999; Groos et al. 2003). Previous studies on N use efficiency (NUE) (N uptake and utilization) mapping had shown presence of QTL related to N related traits such as kernel number (KN), thousand-kernel weight (TKW) and, root and shoot biomass, on every chromosome of wheat (Zheng et al. 2010; Sun et al. 2013; Brasier et al. 2020). GPC is also strongly influenced by the environmental and agronomic factors, making difficult to find stable QTLs for GPC. Heritability for GPC was found to range between 0.41 and 0.70 depending on genotype, location of field trials, and computational analysis (Giancaspro et al. 2019). In spite of the difficulty several studies reported identification of GPC QTLs. Six QTLs were identified for GPC on chromosomes 1B, 1D, 3B, 3D, 5D and 7A, explaining 9.8% to15.8% of phenotypic variation of GPC (Goel et al. 2019). Stable QTLs were identified for GPC on chromosomes 2A, 3A, 4D and 7D, and were found to explain about 10% of the phenotypic variation of GPC (Groos et al. 2003). QTLs such as QGpc.ccsu-2D, QGpc.2B-yume and QGpc.ndsu-6Bbis located on 2D, 2B and 6B, respectively, were found to control GPC (Joppa et al. 1997; Prasad et al. 1999; Terasawa et al. 2016). Amount and timing of N fertilization are among the most important environmental factors ensuring GPC, which were found to affect a number of QTLs related to GPC in wheat (Charmet et al. 2005; Mahjourimajd et al. 2016; Brasier et al. 2020).
Grain protein concentration is affected by all the environmental factors i.e. temperature, precipitation, CO2 concentration, humidity, sun hours etc. that influence N availability in the soil and
cultivar-determined development time (CDDT) (Johansson et al. 2020). There is a negative correlation between GPC and CDDT (Malik et al. 2013) (Figure 6). Grain protein concentration is also influenced by rate and timing of the N application (Johansson et al. 2013; Grahmann et al. 2014). Generally, increased N application leads to an increase in GPC (Xue et al., 2016). Grain protein concentration is known to increase by 25% when higher amounts of fertilizer were applied at sowing, before heading and at grain filling comparing with the N fertilizer applied only at sowing period (Johansson et al. 2001). Pre-anthesis N application in combination with lower temperature (17/14 °C) was shown to negative effect on GPC, whereas, pre-anthesis N application in combination with higher temperature (24/22 °C) was shown to affect positively GPC (Malik et al. 2013) (Figure 6).
Higher availability of N during the post-anthesis (after anthesis) period also increases the GPC in the grain (Daniel & Triboi 2000; Altenbach et al. 2012; Johansson et al. 2013; Grahmann et al. 2014) (Figure
6). To distribute fertilization at different growth stages was found to be more effective than application of the same N amount at only one time in regard to increasing GPC and improving baking quality of wheat (Grahmann et al. 2014; Xue et al. 2016). Post-anthesis application of N was found to have greatest effect at higher 28/15 °C temperature comparing with 20/15 °C (Savill et al. 2018). However, at higher temperatures (37/28 °C) post-anthesis application of N has very minor effect on the GPC comparing with 24/17 °C (Dupont et al. 2006).
The GPC is generally higher at higher temperatures compared with the lower temperatures, also considering, that at the higher temperatures specially during grain filing, the maturation period is normally shorter and the grain size becomes smaller (Daniel & Triboi 2000; Johansson et al. 2005; Savill et al. 2018; Hernández-Espinosa et al. 2018). Grain protein concentration is negatively correlated with the grain maturation period due to the fact e.g. longer grain maturation period leads to higher accumulation of starch (Dupont and Altenbach 2003). As a result of that, an increase of protein dilution and decrease of GPC has been observed (Daniel & Triboi 2000; Johansson et al. 2005; Koga et al. 2015). Varieties show higher bread-making quality under heat stress due to increased grain protein concentration (Flagella et al. 2010; Hernández-Espinosa et al. 2018).
Drought has similar effects as higher temperature as it reduces grain maturation period, kernel size and starch accumulation, and increases GPC (Dupont and Altenbach 2003). Reduction of starch is due to inactivation of starch synthase and in vivo crystallization of amylopectin within the amyloplast (Tester et al. 1995). High temperature and drought together was found to reduce the grain maturation period more than individual treatments (Dupont and Altenbach 2003).
CO2 concentration is predicted to increase from 350 ppm to 700 ppm by 2050 (Williams et al. 1993).
Högy and Fangmeier (2008) reported that wheat productivity and starch concentration in wheat grains increased by 7.6% but GPC reduced by about 14.1% with higher CO2 concentration depending on the
exposure system and rooting volume. A number of other studies also reported that higher CO2 reduced
gluten strength, content of dry/wet gluten, bread volume and thus overall baking quality of wheat flour (Blumenthal et al. 1996; Fangmeier et al. 1999; Wieser et al. 2008; Myers et al. 2014; Panozzo et al. 2014; Buchner et al. 2015). This is due to reduction of GPC and amount of gluten polymers, and increase α-amylase activity in wheat flour (Fangmeier et al. 1999; Pleijel et al. 1999; Wieser et al. 2008).
Figure 6: Summary of the effect of genotype, agronomic and environmental parameters on wheat grain protein concentration. Circles indicate positive (green color) and negative (red color) relation between the parameters and the grain protein concentration; CDDT stands for cultivar-determined development time.
5.2. Gluten polymerization and dough strength
Protein polymerization is largely gene dependent and is rather pre-determined event (Johansson et al. 2005; Malik et al. 2013; Koga et al. 2015). The amount and the size distribution of polymeric proteins can be related to the gluten strength, and these are amongst the most important factors that influence the bread-making quality of wheat (Gupta et al. 1993; Johansson et al. 2001; Johansson et al. 2013; Wang et al. 2016).
Formation of the intra-molecular disulphide bonds is observed in wheat protein such as α/β- gliadins during 3-4 weeks after anthesis, and inter-molecular disulphide bonds in the large SDS-insoluble glutenin polymers around 5-6.5 weeks after anthesis (Every et al. 2003). It is postulated that during this period (5-6.5 weeks after anthesis in glutenins) dehydro-ascorbic acid directly oxidizes glutenin thiols to form intermolecular disulfide bonds in SDS-insoluble glutenin (Every et al. 2003).
Among different environmental factors, timing of nitrogen application and temperature are between the most important parameters that determines the polymerization of wheat protein (Jia et al. 1996; Johansson et al. 2005; Malik et al. 2011; Johansson et al. 2013). Thus, nitrogen and temperature are between the most studied parameters in relation to the bread making quality.
Polymerization of the wheat proteins, %UPP (percentage of un-extractable polymeric protein in total polymeric protein), can be affected by nitrogen fertilizer application (Johansson et al. 2001). Early fertilizer applications (during spike formation) tend to decrease %UPP (Johansson et al. 2001; Malik et al. 2013). Whereas, post-anthesis fertilization tends to increase %UPP which seems to be due to increased ratio of HMW-GS/LMW-GS (Altenbach et al. 2016). A recent study showed that delayed top dressings of nitrogen fertilizer (during the emergence of the top first leaf) resulted higher content of glutenin and glutenin macropolymers than an earlier application of nitrogen fertilizer (during emergence of the fifth leaf from the top) (Zhong et al. 2018).
Hydrogen and electrostatic bonds formation in the proteins and assembly of large glutenin polymers are influenced by precipitations and temperatures (Johansson et al. 2008, 2013, 2020; Koga et al. 2016). In higher temperature, plant development time and grain maturation period tend to get shorter, which decreases starch accumulation, increases GPC and polymeric proteins (Randall and Moss 1990; Johansson et al. 2013; Uhlen et al. 2015). However, positive correlation between the temperatures and protein polymerizations in wheat was observed up to 30 oC (Randall & Moss 1990). Generally, higher
variation in the accumulation of polymeric proteins affecting dough strength have been seen during the anthesis period and at the later stage of grain development (Blumenthal et al. 1991; Johansson et al. 2005; Johansson et al. 2013; Malik et al. 2011). Heat stress (>32-35 oC), particularly during later part of
grain filling reduces protein polymerization and thus, result into reduced dough strength (Blumenthal et al. 1991; Blumenthal et al. 1998; Uhlen et al. 1998; Li et al. 2013; Guzman et al. 2016). It was assumed that synthesis of heat shock proteins at heat stress modify glutenin polymerization which might be a reason of reduced dough strength (Blumenthal et al. 1998). In addition, temperature has been found to
have more effect on polymerization in the flour with weaker gluten (Koga et al. 2016), suggesting that there are variations among the genotypes.
Effect of drought stress on protein polymerization is less investigated comparing with the effect of heat stress. Few studies showed, that drought increase polymeric protein and gluten strength (Li et al. 2013; Guzmán et al. 2016; Magallanes-Lopez et al. 2017; Hernández-Espinosa et al. 2018), while other studies showed no effect of drought on the accumulation of polymeric proteins and glutenins/gliadins ratio (Daniel and Triboï 2002; Panozzo et al. 2001).
Increasing concentration of CO2 was reported to increase the ratio of glutenins/gliadins by 6.3%
(Blumenthal et al. 1996). Similar results were reported by Wieser et al. (2008) and Panozzo et al. (2014). The changes in the ratio due to higher concentration of CO2 were mainly caused by the decrease in
gliadins comparing with glutenins (Högy et al. 2009). As a result, higher gluten strength was observed in elevated concentration of CO2 (Högy et al. 2009). Higher concentration of CO2 was also found to
increase the ratio of LMW-GSs/HMW-GSs (Wieser et al. 2008).
5.3. Genetic composition of gluten proteins
The genetic composition of the gluten proteins and specific subunits are genetically determined (Brites and Carrillo 2001; He et al. 2005; Johansson et al. 2013). Presence of HMW-GSs such as 5+10, 1, 21*, 7+8, 17+18 and 14+15 contributes to more complex structure and tightly linked gluten protein polymer. This complexity is due to the presence of higher amount of cysteine residues compared to HMW -GSs such as, 2+12 and 6+8 (Payne et al. 1987; Shewry et al. 1992). Thus, HMW-GSs such as 5+10, 1, 21*, 21*, 7+8, 17+18 and 14+15 are known to contribute to good bread making quality (Margiotta et al. 1996; Blechl et al. 1998; Johansson et al. 2020). There were also some studies in which 6+8 showed no effect on making quality, while 1 and 17+18 showed negative effect on gluten strength and bread-making quality (Johansson et al. 1993; Johansson et al. 1995; Uhlen 1990).
In general, wheat varieties containing HMW-GSs 5+10 were found to show greater variation and less stability in different locations and fertilizer treatments than the varieties containing subunits 2+12 (Johansson et al. 2000; Hristov et al. 2010). On the other hand, varieties containing HMW-GSs 2+12 are more sensitive and showed greater variability under heat stress (Panozzo and Eagles 2000; Blumenthal et al. 1995).
The temperatures were found to affect significantly the amounts of D- and B-type LMW-GS, 𝜔-gliadins, and 𝛼- and 𝛾-gliadins in wheat grown in controlled environment (Koga et al. 2016). The amounts of D-type LMW-GS and 𝜔-gliadins increased with increasing temperature (from 18 to 23 oC) whereas, the
amounts of B-type LMW-GS, 𝛼- and 𝛾-gliadins decreased at higher temperature (23 oC) (Koga et al.
2016). Another study in the controlled environment showed that an increase in temperature increased α-, β- and 𝜔- gliadin, and decreased 𝛾- gliadin (Daniel & Triboi 2000). Overall proportion of gliadin increased with high temperature (>32-35 oC), particularly during later part of grain filling. This increase
Application of nitrogen fertilizer before anthesis significantly influenced content of 𝜔- gliadin which was found to increase with the higher application of nitrogen (Daniel and Triboi 2000; Dupont et al. 2006). On the other hand, 𝛼-gliadins, 𝜔-gliadins and HMW-GS decreased in the absence of post-anthesis nitrogen application (Dupont et al. 2006).
6. Plant breeding and latest methods to evaluate quality
stability in wheat
In wheat major omics branches like proteomics, metabolomics and phenomics are not as developed as genomics and transcriptomics (Shah et al. 2018). A combination of multi-disciplinary knowledge is required for the further development of wheat with better performance under climatic variability. In this part, proteomics and phenomics in wheat have been discussed.
6.1. Proteomics
Post-transcriptional and post-translational modifications are vital biological functions and stress coping mechanisms in plants (Eldakak et al. 2013). To understand biological function in plants, and their response to abiotic stresses and stress coping mechanisms it is important to characterize and isolate stress responsive proteins (Shah et al. 2018). Proteomics is an analytical tool that gives information on individual proteins from a complex mixture of proteins, thus helping to understand the specific biological response of each protein that are subjected to environmental stresses (Irar et al. 2010, Sancho et al. 2008). Different studies have shown that protein number, quantity and timing of protein expression are subjected to environmental stress in wheat (Sancho et al. 2008; Yasmeen et al. 2016). Identifying and characterizing stress responsive proteins of interest with the help of proteomics tools is important in order to breed climate stable wheat varieties (Hashiguchi et al. 2010).
From the proteins investigated, potential drought and salinity tolerant protein markers were identified by analyzing the embryo of desiccation tolerant and sensitive wheat varieties (Irar et al. 2010). In addition, differential expression of protein directly linked to the folding and deposition of storage proteins were also identified in wheat (Irar et al. 2010). Proteins related to folding and stress were found to be more abundant in the hard wheat (suitable for making bread) comparing with the soft wheat (suitable for making pasta and cookies) (Lesage et al. 2011). Combined mass spectrometry (MS) and 2 D electrophoresis identified drought and heat stress responsive proteins and up- and down-regulation of several gliadins, as well as LMW-GSs (Yang et al. 2011). In a similar experiment, up-regulation and down-regulation of LMW-GSs of those affecting dough rheological properties were also identified (Giuliani et al 2015). Up regulation of LMW-GSs and down regulation of ω-type gliadins were identified in modern wheat varieties which indicates better gluten strength compared with old group of durum wheat genotypes (De Santis et al. 2017). In the study by De Santis et al (2017), higher expression of ω-type gliadins due to water stress was shown. Other studies have shown similar results where higher
expression of ω-type gliadins were found under water stress (Hurkman et al. 2013; Giuliani et al. 2015). Environmental factors such as, temperature and nitrogen fertilizer, were found to highly affect expression of ω-gliadin (Hurkman et al. 2013; Wan et al. 2014).
MS based approach is commonly used technique in proteomics. MS can facilitate identifying of protein-based markers for plant breeding which can be used later for selecting superior genotypes (Chawade et al. 2019). MS based approach requires functionally annotated genome of the investigated species and a well curated set of sequences from different sources such as UniProt. The lack of reliable curated sequence databases for plant species is one of the major hurdles limiting progress of advancement of using proteomics in crop science (Bromollow et al. 2017). Thus, more focus should be given to overcome hurdles in proteomics with emphasizing use in food crops such as wheat.
6.2. High throughput plant phenotyping (HTPP)
High-throughput plant phenotyping (HTPP) is a very useful tool to make the molecular plant breeding more effective and time efficient. In addition, HTPP improves understanding of the genotypic effect on phenotype of the plant by identifying molecular marker linked with the certain traits for marker assisted and genomic selection, and contributes to creation of statistical models (Singh et al. 2019; Nguyen et al. 2019). Furthermore, accuracy of these statistical models can be improved through using HTPP (Araus et al. 2018). Thus, HTPP is an excellent tool to make the breeding process faster and more economic, and will help breeders generate varieties more adaptable to diverse challenging environmental scenarios (Lobos et al. 2017; Chawade et al. 2019; Singh et al. 2019).
HTPP can be adopted in many different areas, for example, in improving crop yield and optimizing fertilizers, pesticides, as well as controlling weeds, diseases, irrigation etc. With the help of HTPP, crop performance under low nitrogen level were effectively characterized in wheat and maize (Zaman-Allah et al. 2015). Stable wheat grain quality e.g. protein quantity and quality, is very crucial for food security, especially in a varying climate. There are few examples of using HTPP in mapping wheat grain quality
e.g. a use of spectral reflectance for identifying senescence phenotypes in winter wheat (Kipp et al. 2014; Wang et al. 2014). A positive correlation was found between onset of senescence and GPC in winter wheat (Kipp et al. 2014). Spatial and temporal resolution remote sensing data of winter wheat was shown to predict the GPC in wheat during anthesis reliably (Wang et al. 2014). Similarly, hyperspectral traits e.g. reflectance at wavelength 1177 nm and 1227 nm, normalized differential spectral index, differential spectral index, simple ratio index normalized to difference spectral index (NDSI) was shown to predict GPC in rice with high accuracy (R2 value 0.68) (Sun et al. 2019). Some
HTPP techniques such as, satellite phenotyping, UAVs (e.g. parachutes, rotocopters and fixed wing systems), and proximal phenotyping (e.g. handheld sensors and mobile platforms) have potentiality to be applied to phenotype plants in large fields to detect plant stresses (Chawade et al. 2019). A use of latest the HTTP techniques to predict wheat grain yield and quality such as, size of the grain, protein concentration, starch etc. under controlled stressed conditions in a glass-house and in a field, is of interest to explore in wheat breeding related projects.
HTPP is known to have a bottleneck for crop genetic improvement (Araus et al. 2018), therefore a need and interest in the area of plant phenotyping are increasing, and development of more precise and accurate phenotyping is progressing (Araus et al. 2018; Chawade et al. 2019). Some other limiting factors of HTPP are high infrastructure cost, a lack of skilled people in for example, underdeveloped countries, and a lack of uniform performance of HTTP in different environmental and agronomic conditions (Costa et al. 2019). For example, single and multiple temporal remote sensing phenotyping method requires clear sky and is able to predict wheat grain quality more accurately only during anthesis period (Wang et al. 2014). Other example is that from RGB image acquisition was observed that screening of wheat germplasm worked best only at low and optimum nitrogen levels (Nguyen et al. 2019). Thus, there are needs of optimizing different phenotyping techniques for individual crop of different traits, although this approach would increase the complexity of utilizing HTPP.
7. Crop adaptation and crop quality prediction models
Crop prediction models such as, simulation and genomic selection (GS), can play a very important role in developing genotyping adaptation in crop varieties. For example, simulation modelling can provide the basis for assessing potential crop traits for genotypic adaptation and help to develop crop idiotypes for climate change (Ramirez-Villegas et al. 2015). Genomic selection can be used to take full advantage of molecular markers and accurately predict crop performance (Juliana et al. 2019), where prediction can later be used for improving genotype adaptation. Moreover, climate model can be used to increase management-level adaptation in crop (Corbeels et al. 2018). Different types of crop models in the aspect of crop adaptation and their use in predicting grain protein quality are briefly discussed below.
7.1. Crop simulation models for assessing end-use quality of wheat
Crop simulation models are mainly used to assess the impact of genes, environment, crop management on crop growth and yield, and can be used in prediction of crop performances in relation to climate change (Craufurd et al. 2013; Semenov et al. 2014). Crop simulation models can provide a framework of integrating complex plant physiological processes and their responses to climate and environment, thus improve the understanding of interaction between the climate change and crop performances (Semenov et al. 2014). There are mainly three different types of crop simulation models namely, statistical model, mechanistic/process based model and biophysical model. Statistical methods (i.e. process based models, biophysical model) can be used in a wide range of environment and can account complex interaction between climatic and non-climatic factors thus, could potentially be reasonable tools for assessing climate change impacts on crop performance and grain quality (Asseng et al. 2013), despite their simplicity and frequent calibration (Nuttal et al. 2017). Careful interpretation of relevant model outcome might help breeder to evaluate genotypic adaptation of a crop under current and future climates (Ramirez-Villegas et al. 2015). However, some complexity in using the crop simulation models exists. For example, using different crop simulation modelling systems in projecting climate change
impact on crop performance can give different outcomes and bring some uncertainties (Asseng et al. 2013). In order to improve the crop simulation models accuracy and certainty of the outcome of the ensembles of crop models should be used (Martre et al. 2015).
There are a number of crop simulation models for assessing grain quality in wheat, and which were mainly used for grain size and concentration of the nitrogen in the grain (Nuttal et al. 2017). Few crop simulation models such as, Sirius, STICS and APSIM-N in wheat, included the grain protein composition and protein content in the grain (Nuttal et al. 2017). Sirius was used as process-based grain quality simulating model, which predicted nitrogen accumulation at early growth stage and further nitrogen partitioning in gliadin and glutenin at grain maturation stage in wheat (Martre et al. 2006; Aguirrezábal et al. 2009). Accumulation of the albumin, globulin, amphiphilic proteins and carbon during the stages of endosperm cell division and DNA endo-reduplication, accumulation of storage proteins (e.g. gliadin and glutenin) and starch after the period of endosperm cell division, are included in the model (Aguirrezábal et al. 2009). Thus, this model includes the environment effect on concentration and composition of wheat grains (Martre et al. 2006).
7.2. Gene based crop quality prediction models
Genomic selection (GS) is selection of breeding lines by using high-density single nucleotide polymorphism (SNP) markers across the whole genome of a chosen crop (Akdemir and Isidro-Sánchez 2018). These markers are commonly used to predict complex and quantitative traits in breeding (Poland et al. 2012). In GS, molecular marker‐based selection is done using an identified subset of markers associated with the quantitative traits (Bernardo and Yu 2007). Effect of all the markers on the quantitative traits across the genome are obtained by fitting the molecular marker as random variable in a linear model. The breeding value is predicted from the linear model and a training population is used to train/develop the model (Bernardo and Yu 2007; Poland et al. 2012). Phenotype of the training population in relation to the different traits is rather well studied (Michel et al. 2017), and once a suitable model has been developed, it can be further applied to a selection population. Prediction accuracy is normally improved by increasing number of samples in the training population (Kiszonas and Morris 2018; Akdemir and Isidro-Sánchez 2019).
Currently, molecular approach of genotyping such as, next-generation sequencing or genotyping by sequencing, are quite effective methods to generate genome wide markers (SNPs) at relatively low cost and short time (Poland et al. 2012). Therefore, the use of GS in selecting plant breeding materials became quite popular among breeders. To maximize benefits from GS, marker information is needed to be combined with HTPP for achieving the valuable genetic gain from complex traits (Bhat et al. 2016). Integration GS and HTPP in high-yielding climate-resilient wheat breeding programs can accelerate breeding process and the crop genotypic adaptation (Juliana et al. 2019).
GS is a widely used method in the prediction of complex trait such as, yield, however, there are only few example of the use of GS to predict baking quality traits (Battenfield et al. 2016; Guzman et al. 2016; Michel et al. 2018).
Bread making quality in wheat is assessed using a number of tests, including dough rheological tests and baking tests. These tests are normally time consuming, labor intensive, and therefore are expensive, as well as require relatively large amount of flour. In the early stages of breeding program, there are rather limited amounts of flour available, therefore some of the tests such as, dough mixing and baking, cannot be performed. Therefore, GS prediction models that would include dough processing and end-use quality characteristics could potentially assist to breeders in selection of suitable material for making bread and could save time and resources (Battenfield et al. 2016). Highly demanding traits in bread making such as, necessary dough rheology and baking of a final product, were shown to be predicted with a rather high degree of confidence by GS (Guzman et al. 2016). In addition, also GS showed great promise for pre-selecting lines with the superior bread baking quality in early generations, at least 3 years ahead of final quality analysis (Michel et al. 2018). GS facilities for early generation selection of end-use quality characteristics in wheat, leaving larger populations for selection of yield during advanced testing and leading to better gain for both quality and yield in bread wheat breeding programs (Battenfield et al. 2016). Multi-trait simultaneous GS for grain yield, protein content and dough rheological traits have a potential to develop superior varieties with high both yield and end-use quality characteristics (Michel et al. 2018).
7.3. Climate model
Climate models, also known as general circulation models (GCM) that use mathematical equations to characterize how energy and matter interact in different parts of the ocean, atmosphere and land (NOAA 2020). GCMs are complex and operates in the bigger scale (e.g. hundred kilometers). These models can be downscaled and projections from the model can be used with crop model at the field scale. However, downscale version includes more uncertainties in the climate change projection, and these uncertainties vary depending on the choice of locations (Corbeels et al. 2018). The multi-ensembles approach of combining different crop models, downscaled climate models and emissions scenarios can help to minimize uncertainties in crop yield projections (Roudier et al. 2011). Ensemble modeling is used in predicting climate change effect on crop yield and identifying management strategies for adaptation in future climate scenarios (Roudier et al. 2011).
8. Methods for assessing bread making quality in plant
breeding and baking industries
Dough rheology is one of the parameters that is used frequently to determine processing and end-use characteristics of wheat flour (Battenfield et al. 2016). There are number of tests to assess the end-use properties of wheat flour (Xiao et al. 2006). Classical assessments tests determine combined contributions of different functional properties of wheat flour on bread quality (Kweon et al. 2014). In addition, more specific wheat flour properties of bread quality can be determined with the conventional tests (Axford et al. 1979). Different tests are favored by the breeders, millers and bakers. Some of commonly used tests are briefly described below.
8.1. Classical tests
Classical tests of dough rheology for assessing mixing and viscoelastic dough properties of wheat flour simulate doughs behavior during the baking process (Michel et al. 2017). Different rheology tests performed by farinograph, mixograph, extensograph, and alveograph, are the most traditional and widely used by industry to monitor wheat flour quality for a commercial bread production (Oliver and Allen 1992; Kweon et al. 2014). These tests provide information on water-absorption capacity of flour and dough development time under mixing, thus information on these parameters are related to wheat gluten development (Oliver and Allen 1992; Kweon et al. 2014).
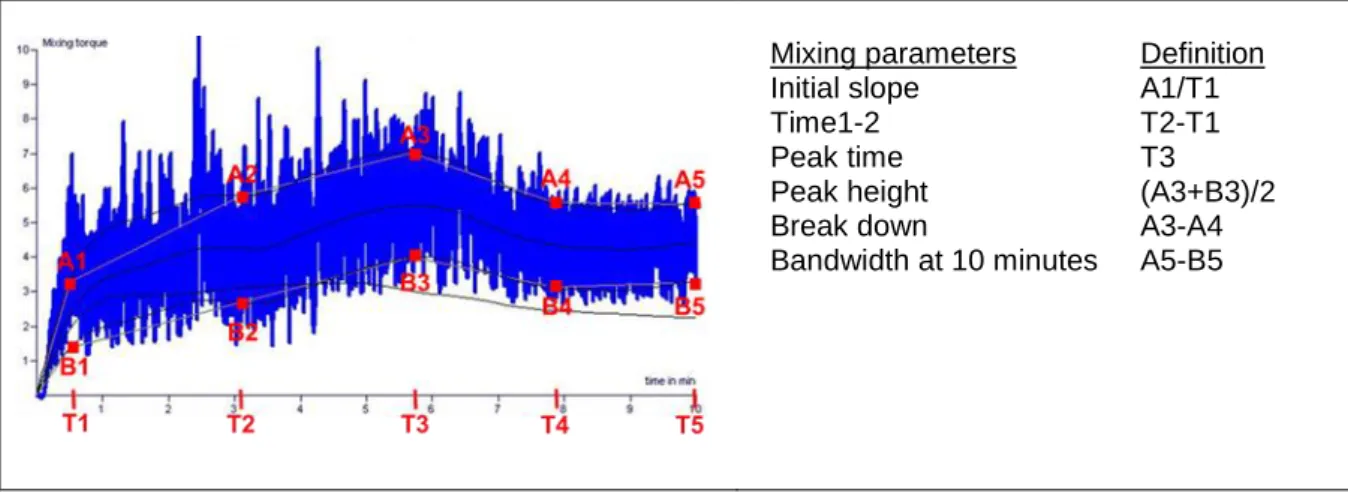
Among all the classical tests, mixograph can reveal the maximum number of parameters such as strength, consistency and mixing tolerance of wheat flour dough (Martinant et al. 1998). A typical reomixer curve and measured parameters obtained with reomixer (Bohlin Reologi AB, Lund, Sweden) are shown in Figure 7. Peak time and peak height of the mixing curve are related to gluten strength (Ceresino et al. 2019), where the curve height provides information about the dough consistency and curve width indicates mixing tolerance (Martinant et al. 1998). Since Rheomixer correlation between the bread volume and dough rheology tests is not consistent, there is a need to use complementary tests such as, farinograph, alveograph and baking test (Prashant et al. 2015). Alveograph test can be used for both hard and soft wheat flours, and provides information on flour dough forming properties and gluten strength (Zhang et al. 2007; Kweon et al. 2011).
Mixing parameters Initial slope Time1-2 Peak time Peak height Break down Bandwidth at 10 minutes Definition A1/T1 T2-T1 T3 (A3+B3)/2 A3-A4 A5-B5
Figure 7: A typical Reomixer curve of wheat dough; mixing curve parameters A1-A5 and B1-B5 determined at different development time T (minutes).
Extensograph test describes the ratio between the dough strength and extensibility at different resting periods, which can be related to the bread making quality of the flour (Fu et al. 2017). Extensographs’ parameters may be used in assessing the impact of gluten polymer size on dough strength and extensibility (Bangur et al. 1997).
A major advantage of the classical methods estimating wheat flour dough quality parameters is that these tests are critically related to dough handling and bread-making behavior during baking processes (Fu et al. 2017). Thus, these tests are widely used for quality control by millers, wheat flour-processers, bakers and plant breeders (Michel et al. 2017).
Few disadvantages of farinograph and extensograph methods are that they measure combined and cumulative contributions of the major flour functional components such as, damaged starch, gluten proteins and arabinoxylans (also known as pentosanes) on bread-making quality. Thus, individual functional contribution of each of those wheat flour components separately cannot be revealed by the classical tests (Kweon et al. 2011). Also, these quality tests generally require large amounts of wheat flour (2–5 kg) for milling and testing, and therefore are labor intensive, expensive and throughput is rather low (Fu et al. 2017). Therefore, a small scale rapid and convenient determination method for assessing bread baking quality is in high demand (Zhao et al. 2012).
8.2. Conventional tests
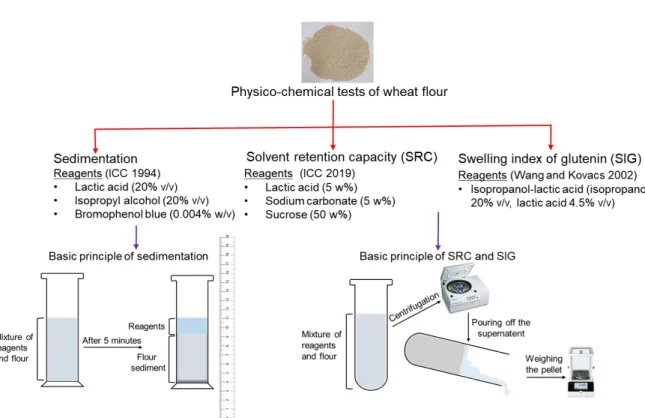
Small-scale tests for assessing bread-making quality are essential in wheat breeding in order to select suitable varieties at early selection stages, and to save time and expenses (Axford et al. 1979; Xiao et al. 2006). Flour sedimentation, SRC and SIG are some of those rapid physico-chemical tests that are briefly described here. General principles and reagents used in flour sedimentation, SRC and SIG are briefly presented in Figure 8.
Figure 8: General principles and reagents used in three physico-chemical tests of wheat flour.
Flour sedimentation test is done with sodium dodecyl sulfate (SDS). Thus, this test is widely known as SDS sedimentation test. This test measures wheat flour protein aggregative ability and provides a value that is highly associated with the protein concentration and composition (Carter et al. 1999; Zhao et al. 2012; Graybosch et al. 1996). Swelling of the glutenin strands mainly cause the sedimentation whereas, the gliadin is dissolved completely in the SDS solution (Eckert et al. 1993). In addition, SDS sedimentation is a modified version of Zeleny sedimentation (1947) and the results of SDS- sedimentations are known to be better associated with the loaf volume than the Zeleny sedimentation (1947) (Axford et al. 1979). Higher SDS sedimentation volumes are associated with stronger gluten and higher bread baking quality (Axford et al. 1979; Carter et al. 1999; Zhao et al. 2012). Bread baking quality of hard wheats has been found to correlate better with SDS-sedimentation volume than the bread baking quality of soft wheats (Axford et al. 1979).
SDS sedimentation volume of wheat flour has been found to be highly influenced by environment, year, and their interactions with varieties (Bassett et al. 1989; Peterson et al. 1992; Graybosch et al. 1996; Carter et al. 1999). Comparing with the effect of genotypes, the environment was found to have smaller