A Nondominated Sorting Genetic Algorithm for Sustainable
Reverse Logistics Network Design
Mohammad Asghari
Department of Industrial Engineering
Ferdowsi University of Mashhad
Azadi Sq., Mashhad 91735, Iran
Samaneh Nezhadali
Department of Management
Iran Chamber of Commerce, Industries and Mines
Mashhad, Iran
Abstract
Determining the appropriate strategy in recycling method that will has less pollution besides the economical process, has been signified as one of the basic principles for achieving sustainability in the supply chain due to the new legislation, environmental concerns’ growth, increase volume of returns, etc. in recent years. Here will be considered a design of reverse network development for recycling waste products besides the reduction of harmful emissions due to storage, transportation and various processes. The purpose of this study investigates a multi objective optimization problem of sustainable Reverse logistics network design with the aim of management in allocating customers by coordinating facilities to ensure minimum cost as well as the environmental impact. In this work is presented a dynamic linear programming model which examines the important aspects for the design and strategic planning of a sustainable chain. Due to the complexity and differences in the nature of the model objectives, is proposed a heuristic method based nondominated sorting genetic algorithm to solve the problem. Finally, the results are discussed and analyzed.
Keywords
Supply chain network, Dynamic reverse logistics, Sustainable development, Multi objective optimization model, Heuristic algorithm
1.
Introduction
Between 1990 and 1995, the amount of waste generated in Europe increased by 10%, according to the Organisation for Economic Cooperation and Development (OECD). Most of what we throw away is either burnt in incinerators, or dumped into landfill sites (67%). But both these methods create environmental damage. By 2020, the OECD estimates, we could be generating 45% more waste than we did in 1995. Obviously we must reverse this trend if we are to avoid being submerged in rubbish (http://ec.europa.eu/environment//waste/index.htm). A large body of literature on RLs network has appeared in the last two decades that reflects subject growth in the SC network; see Pokharel and Mutha (2009)for an extensive review in 2009.
In this paper, a multi objective optimization model of sustainable RLs network is applied for economic and environmental consideration. Here, in addition to considering the capacity constraints for manufacturing and warehouse that was brought in earlier papers, transportation methods will be include capacity as a result of which we cannot always use of transportation methods with the lowest cost and environmental impact.
In the provided mathematical model, first objective will affect the economic parameters including fix, variable, purchase, holding, transportation costs and total income. Another objective function minimizes the environmental impact caused by operations at the facility, transportation means and holding of the products in warehouse. The sustainable reverse logistics network design problem discussed in this study is known as NP-Hard. As a result, a heuristic method is proposed based on Nondominated Sorting Genetic Algorithm II (NSGA-II) to solve this multi-objective problem. Finally, some examples are conducted to test the validity of the proposed model.
The remainder of this paper is organized as follows. After a brief literature review of relevant sustainable performance is associated with RLs networks in Section 2, in Section 3 is presented a description of model
Proceedings of the 2014 International Conference on Industrial Engineering and Operations Management Bali, Indonesia, January 7 – 9, 2014
formulation and assumptions. Section 3 defines the problem and introduces the objective functions in detail. Next, the mathematical formulation for the model is developed. Section 4 is devoted to the development of algorithm for solving the problem, including a NSGA (II). In Section 5, some numerical examples of its occurrence are used to show the applicability of the model and investigate model sensitivity, and then the computational results are indicated for the heuristic algorithm. Finally, Section 6 presents the conclusions and provides directions for further developments.
2.
Literature Review
Since the early 1990, manufacturers have been facing pressure for integrating environmental management into their SCs (Wu and Dunn 1995). Gungor and Gupta (1999) provided a detailed literature survey of Environmentally Conscious Manufacturing and Product Recovery (ECMPRO). Recently, Ilgin and Gupta (2010) presented an extensive review of the art literature on ECMPRO, which classified lectures into four major categories, viz., environmentally conscious product design, reverse and closed-loop supply chains, remanufacturing and disassembly.
While Wu and Dunn (1995) make a conceptual contribution to explain the ways in which a firm can minimize their total environmental impact, Tsoulfas and Pappis (2008) propose some valuation and decision models for the environmental performance evaluation of supply chains. They focus on the more complete internal supply chain ranging from product design and manufacture to transportation and logistics and examine how environmental performance indicators may be introduced on them.
Designing RL network needs to determine how the products collect of consumer and return to the dedicated centers for recycling. In the past lectures, this scheming has been mostly included quantitative models with a focus on facility's location and resource allocation decisions (Srivastava 2007). Linear programming is one of the most commonly used techniques to find an optimal configuration for making reproduction strategies, including the number and location of different logistics facilities and transportation methods (e.g. Dehghanian and Asghari 2012). A comprehensive review of mathematical formulation, used decision variables and solution approaches which have been wrought in recent articles can be seen in the Subramoniam et al. (2009).
Kumar and Putnam (2008) develop a model of RLs system to facilitate the processing of recovery, recycling, reuse and remanufacturing in a closed-loop supply chain for lifecycle management. Furthermore, Pagell et al. (2007) present a framework so that highlight the supply chain implications for companies forced into EOL product management where included various recycling options available to managers. Mansour and Zarei (2008) presented a multi-period RL optimization model with cost drivers, number, location and throughput of EOL vehicles collection centers, vehicle dismantlers and the flow statistics among the entities.
In recent years, mathematical models have been extensively applied to solve problems considering environmental effects. One of the first works was by Zhou et al. (2000), which proposed a goal programming model for sustainable SC optimization and scheduling of a petrochemical complex.
In this area, many researchers have considered multi-objective SC optimization (Pishvaee and Torabi 2012 and Paksoy et al. 2010). Multi-objective optimization has been applied in decisions on various issues, nonetheless SC design is typically done as a single objective problem or has the capability is becoming to a single objective function using weighting methods. Considering environmental effects as a separate function, besides other objectives such as cost, risk and customer satisfaction is a valuable study, which is modeled differently.
3.
Problem Definition
Determine the appropriate strategy in recycling method that will has less pollution besides the economical process, is one of the basic principles to achieve sustainability in the SC. Model designed in product recycling proposes planning application to determine the optimal numbers and locations for collecting and recycling facilities within the candidates to satisfy all customer zones and get the optimum amount of products with different quality, carrying with varies methods into centers and also select the best methods for products recovery to provide a balanced set of strategies between financial and environmental costs.
The following are the assumptions considered in the present model:
The potential locations of collection/inspection and recovery facilities are known. The holding cost depends on the residual inventory at the end of each period. Recovery options operate independently.
Non-returned used products by the customers will been disposed. Nomenclature that is used in this paper is showed in the following:
Sets
P set of used product types
T set of time periods
I set of fixed customer zones
J set of potential collection/inspection centers (CICs)
H set of potential recovery locations
D set of disposal centers
L set of transportation mode
M set of recovery facilities(RFs) outputs
R set of methods for recycling products
O set of unwholesome outputs (waste, GHG, co-products, etc.)
Parameters
vp volume used product p ( per m3)
wp weight used product p (per kg)
rpit potential and deterministic amount of used product p in customer zone i in period t
βpjt percent of rejected product p at CIC j in period t
percent of generated product m of returned product p viamethod r
inventory capacity of inspected products at CIC j in period t
inventory capacity of rejected products at CIC j in period t
inventory capacity of received products at RF h in period t
inventory capacity of processing wastages at RF h in period t
; ; capacity of flow between: CIC j and RF h; CIC j and DP d; RF h andDP d via mode l ; ; distance between: CIC j and RF h;CIC j and DP d; RF h and DP d
binary parameter, it takes1 if RF h be able to recovery product p and 0 otherwise a sufficient large number
fixed cost of opening CIC j in period t
fixed cost of opening RF h in period t
variable operating cost for inspection and sorting product p at CICs in period t
variable operating cost for recovering product p using method r in period t ctlt cost per unit distance traveled by transportation mode l in period t
cplt handling cost per unit of product p using transportation mode l in period t
inventory holding cost at CIC j in period t
inventory holding cost at RF h in period t
bpt purchase price per unit of used product p in period t
unit sale price of product m in period t
emission of output o of storage per m3 per period
emission of output o for per unit of collected product p
emission of output o during recovering process to supply m via method r from product p
emission of output o during disposing process of rejected product p
emission of output o for transport per kg in per km using transportation mode l
Decision variables
quantity of returned product p collected in CIC j in period t
quantity of returned product p that processed with method r at RF h in period t
; ; quantity of returned product p shipped between: CIC j andRF h; CIC j and DP d; RF h andDP d via mode l in period t
binary variable, it takes 1 if CIC j is opened in period t and 0 otherwise binary variable, it takes1 if RF h is opened in period t and 0 otherwise
binary variable, it takes1 if customer zone i choice CIC j for selling your used products inventory level of inspected product p at CIC j in period t
inventory level of rejected product p at CIC j in period t
inventory level of received product p in waiting for recovering at RF h in period t
In this section is presented a linear programming model which examines the important aspects for the design and strategic planning of sustainable SC. The present of a multi objective mathematics programming problem as a methodology to offers a set of best different strategic decision which determine satisfactory economic efficiency parallel to obtain minimum environmental effects and propose to single decision maker or a decision making body (the focal company) that ensure a tradeoff between the various aspects with respect to restrictions.
3.1.Economic Objective (F1):
In the first, economic goals will be followed as following:
▪ Collection/Inspection costs (define Cc): which are related to the costs that occur in CICs
. . . .
▪ Recovering costs (define Rc): which are related to the costs that occur in RFs
. . .
▪ Transportation cost (define Tc): which are related to the costs for moving products between different nodes, it has been considered influence of factors such as type of product transferred, transportation method and distance
. . . .
. .
▪ Benefit (define B): which are related to the revenue from selling products
. .
In summary, the economic performance is measured by an objective function in Equation 1, which should be minimizing to ensure economic sustainability.
F1 = Cc + Rc + Tc – B (1)
3.2.Environmental objective (F2):
Environmental effects consideration is not easy, it is highly dependent on various conditions and may be different from one sector to another. In general, various effects of some of their most influential are integrated in the objective function F2.
▪ Environmental impact of storage (define EIs): which are related to emission of stored goods
. . . .
▪ Environmental impact of facility operations (define EIo): which are related to output emissions of processing at centers
. . . .
▪ Environmental impact of transport (define EIt): which are related to pollution generated by transport vehicles.
. . . .
In Equation 2 Environmental functions are summarized that should be minimized to ensure environmental sustainability.
F2 = EIs + EIo + EIt (2)
3.3.Problem modeling:
Base on the aforementioned descriptions and presented indices the deterministic mixed integer linear programming (MILP) model is developed as follows:
Minimize: F1and F2 (3) Subject to 1, ∀ ∈ , ∈ , (4) , ∀ ∈ , ∈ , (5) . , ∀ ∈ , ∀ ∈ , ∈ , (6) . , ∀ ∈ , ∀ ∈ , (7) . , ∀ ∈ , ∀ ∈ , ∀ ∈ , ∈ , (8) , ∀ ∈ , ∀ ∈ , ∀ ∈ , ∈ , (9) , ∀ ∈ , ∀ ∈ , ∀ ∈ , ∈ , (10) . 1 , ∀ ∈ , ∀ ∈ , ∈ , (11) . , ∀ ∈ , ∀ ∈ , ∈ , (12) , ∀ ∈ , ∀ ∈ , ∈ , (13) . 1 , ∀ ∈ , ∀ ∈ , ∈ , (14) 0, ∀ ∈ , ∀ ∈ , (15) 0, ∀ ∈ , ∀ ∈ , (16) 0, ∀ ∈ , ∀ ∈ , (17) 0, ∀ ∈ , ∀ ∈ , (18) , ∀ ∈ , ∈ , (19) , ∀ ∈ , ∈ , (20) , ∀ ∈ , ∈ , (21) , ∀ ∈ , ∈ , (22) , , , , 0, ∀ ∈ , ∀ ∈ , ∀ ∈ , ∀ ∈ , ∀ ∈ , ∀ ∈ , ∈ , (23) , , ∈ 0,1 , ∀ ∈ , ∀ ∈ , ∀ ∈ , ∈ , (24)
In the model, Eq. (3) is the objective functions, that namely minimizing total financial costs and environmental impacts, respectively. Eq. (4) expresses that each customer zone just can return the products to a collection center in each period and Eq. (5) ensures this event can occur only when the collection is constructed. Constraint (6)
represents quantity of various products that can be collected of customer zone in each CIC. Constraints (7) ensure that a recovery facility can only receive products that are recyclable in there. Eqs. (8) to (10) express capacity limitation of products transportation between different nodes. Eqs. (11) and (12) assure the inventory balance of used products at accepted and rejected warehouses in each CIC across time periods. Eqs. (13) and (14) assure the inventory balance at initial and refuse warehouses in each RF across time periods. Eqs. (15) to (18) state that there are not any inventories of products in each warehouse in the first period. Constraints (19) to (22) express inventory capacities of extra products be had held at centers warehouses. Finally, constraints in set (23) enforce the non-negativity restrictions on the corresponding decision variables and constraints in set (24) enforce the integrality restrictions on the binary variables.
4.
Solving method
In this paper, a hybrid genetic algorithm and Pareto approach is used to solve the model, because genetic approach is considered an appropriate method to solve problems with multiple objective functions (Pishvaee et al. 2010). In this category of problems, different objective functions will be resolved individually, and then the Pareto-optimal solutions graph will be drawn. The main characteristics of genetic algorithm is multiple conductance, global search and maintaining a population of solutions from one generation to another.
In NSGA (II) that was introduced by Deb et al. (2002), crossover and selection operators are performed same on a conventional genetic algorithm but ratings and sorting solutions are not based on more or less value of objective function. The algorithm uses nondominated sorting, which means that nondominated solutions are placed in a class as individuals for a generation.
Due to the type of the model and dependence of variables, complexity of this problem is extremely high and it is necessary using a suitable method for solving. This is why a heuristic approach is applied that makes use two procedures of approximate and exact. In the proposed approach, each generation will create solutions for the location of collection centers and recycling centers and then the amount of two variables Zijt and can be
obtained by them under considering the model constraints, following which it can be easily solved through the use of CPLEX software libraries.
4.1.Chromosome representation
In the model, variables , and will form decision variables of genetic algorithm that variables and are independent binary variables and other one, , is dependent binary variable. Other variables such as can also be set in this step based on the model constraints. This will lead to the exclusion of binary variables from the model and we achieve to a simple linear programming model with the number of continuous decision variables. All the chromosomes are composed of arrays of one-dimensional binary values that the representation of them is illustrated in Figure 1.
4.2.Selection
Parent selection is one of the most important activities in the orientation of genetic algorithm to the optimum solution area. In the each stage, two parents from the current generation are selected to produce offspring that could be done individually and with different method. In this study, we have used the method of random selection with equal probability. Thus, in every generation cycle, parent chromosomes are selected independently and at random from the population. By selecting two chromosomes from the pool of chromosomes as a parent, 2 children are generated as shown in Figure 1.
Note that before proceeding with the algorithm it is necessary to code the state of the network and determine the chromosome structure. Hence, coding of the potential solution is the first important aspect of a correct implementation of the genetic algorithm. This is while; a proper coding will result in better solutions with less time consumption (Figure 1).
4.3.Crossover
The crossover operator recombines the genes of two selected chromosomes to generate two new crossover children to be formed in the next generation. This operator is done just on variables Xjt and Yht, then values of the variables
Zijt and are determined based on values assigned to the variables Xjt and Yht. In this way, other variables would
be initialized by CPLEX in an exact solution approach. In the generating of children, if programmable variety of CICs and RFs were 5 and 6, respectively, each chromosome is divided to 11 parts (5 + 6 = 11). Then, according to what is shown in the Figure 1, the children will be formed.
Figure 1: An illustration of crossover operator 4.4.Fitness and evaluation
As there is no-elitism, the generated children must be appraised to ensure that they have not been dominated by any parents, other child or chromosomes in the previous generations. If any of the children are not entered into the next generation, one of the parents would be entered randomly.
5. Numerical Example
Some illustrative examples have been developed to evaluate the performance of the proposed approach for solving model. The size of the investigated examples and their parameters value are given in Table 1 and Table 2 respectively. In Table 2 we have generated parameters randomly using uniform distributions.
Table 1: Test problems’ dimensions
Problem number 1 2 3 4 5
Used product types P 4 5 3 3 4
Time periods T 3 4 5 6 7 Customer zones I 5 10 20 25 30 Collection/inspection centers J 4 5 10 15 20 Recovery centers H 3 3 5 8 10 Disposal centers D 2 2 3 3 4 Transportation mode L 2 2 2 2 2
Recovery facilities outputs M 2 2 2 2 2
Methods for recycling products R 2 2 2 2 2
Unwholesome outputs O 2 2 2 2 2
Table 2: The values of the parameters used in the test problems
~ uni[0.5,1.5] ~ uni[25,40] ~ uni[7,12]
~ uni[500,2500] ; ; ~ uni[100,250] ~ uni[10,50]
~ uni[200,1000] ctlt ~ uni[0.001,0.01] ~ uni[0.1,1]
~ uni[0.1,1] cplt ~ uni[1,3] ~ uni[0.5,1.5]
: Random ; ; ~ uni[2000,5000] ~ uni[500,2000]
~ uni[30,70] vp ~ uni[0.5,4]* ~ uni[200,1000]
~ uni[0,30] wp ~ uni[1,5] βpjt ~ uni[0.1,0.4]
~ uni[50,100] rpit ~ uni[100,200] ~ uni[50,100]
~ uni[50,100] bpt ~ uni[0.5,1.5] ~ uni[0.5,1.5]
* Uniform distribution [lower bound, upper bound] Parent 1 … RF1 … CIC1 Center … T3 T2 T1 … T3 T2 T1 … T3 T2 T1 … T3 T2 T1 Time period … 1 0 0 … 0 0 0 … 1 1 1 … 1 1 0 Random array Parent 2 … RF1 … CIC1 Center … T3 T2 T1 … T3 T2 T1 … T3 T2 T1 … T3 T2 T1 Time period … 0 0 0 … 1 1 1 … 1 0 0 … 1 0 0 Random array Child 1 … RF1 … CIC1 Center … T3 T2 T1 … T3 T2 T1 … T3 T2 T1 … T3 T2 T1 Time period … 0 0 0 … 0 0 0 … 1 0 0 … 1 1 0 Child 2 … RF1 … CIC1 Center … T3 T2 T1 … T3 T2 T1 … T3 T2 T1 … T3 T2 T1 Time period … 1 0 0 … 1 1 1 … 1 1 1 … 1 0 0
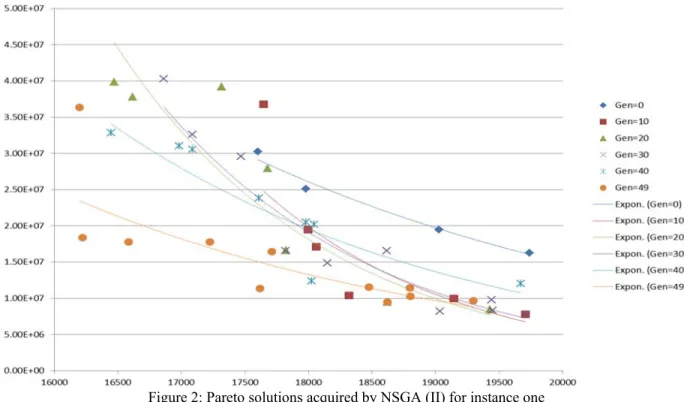
Figure 2 depicts the results obtained by presented heuristic method which is coded in C++ as a sub-algorithm and our implementation at some iteration for instance one that is worthy. The all experiments were run in an Intel(R) core(TM) i3 CPU, at 2.13GHz and with 4.00 GB of RAM memory. We summarize the evaluation results with the different generation, according to a group of parameters defined in Table 2.
Figure 2: Pareto solutions acquired by NSGA (II) for instance one
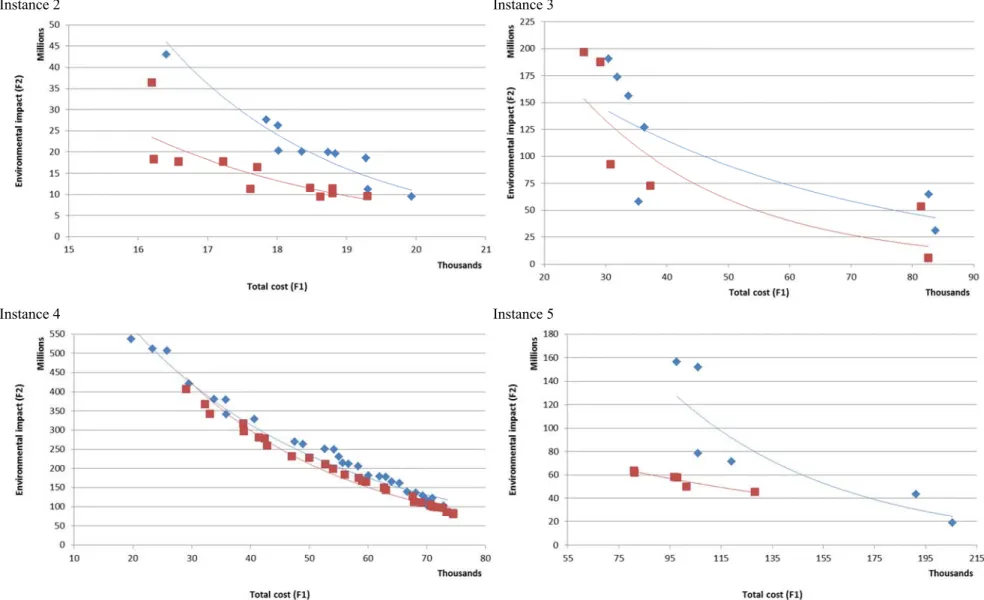
According to the analysis conducted on different iterations as shown in Figure 2, it is observed that there was a considerable amelioration among the obtained results and a high tendency to Pareto optimality with increasing the number of generations. The results of provided basis for comparing the accuracy and efficiency of the solution approach used to solve different instances with medium-sized are presented in Figure 3.
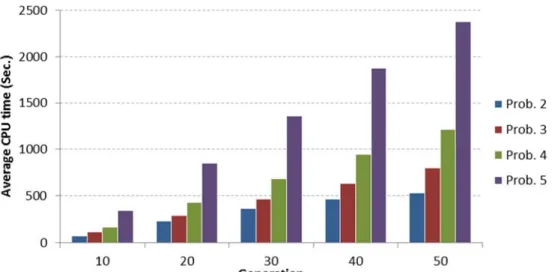
Figure 3 compares the objective functions values for instance 2 to 5 in the first and last generation that can be found a similar conclusion with the previous figure. Generation 50 is selected to obtain a larger variety of solutions in a logical time. The graph given in Figure 4 indicates information about the average CPU time taken by the algorithm for solving the model that shows rapid increases with the growing amount of generations. As the results it can be received that heuristic approach causes significant improvement in both of the objective functions with rising number of considered generations.
6. Conclusion
In this paper, we have considered a new approach in design of reverse logistics network to configure a mixed integer linear programming model in the sustainable RLs design phase. In developing of the model, environmental effects and economic objectives have been considered as two separate functions. Finally, the proposed multi-objective mathematical model was solved by a hybrid method based on NSGA (II) to obtain optimum planning for facilities location, allocation of goods and the determination of recycling and disposal strategies in an integrated network. After analyze and validate the problem, optimal result of computations is applied to show efficiency and effectiveness of the illustrated design in multi time periods environment.
As the aim of this paper was to propose and develop new options in network design of products return, there are many opportunities for future researches in this area, for example, considering uncertain form of parameters, investigating social dimension of sustainability and other objectives such as risk, flexibility and robustness and also development of different stages like remanufacturing and distribution centers.
Instance 2 Instance 3
Instance 4 Instance 5
Figure 4: Computation time for instance 2 to 5 in different generations
References
Dehghanian, F., and Asghari, M., The Dynamic Design of Reverse Logistics Network with Fuzzy Incentive-Dependent Return, International Conference on Industrial Engineering and Operations Management Istanbul, Turkey, July 3 – 6, pp. 1473-1481, 2012.
Deb, K., Pratap, A., Agarwal, S., and Meyarivan, T., A Fast and Elitist Multiobjective Genetic Algorithm: NSGA-II,
IEEE Transactions on Evolutionary Computation, vol. 6, pp. 16, 2002.
Gungor, A., and Gupta, S.M., Issues in environmentally conscious manufacturing and product recovery: a survey,
Computers & Industrial Engineering, vol. 36, pp. 43, 1999.
Ilgin, M.A., and Gupta, S.M., Environmentally conscious manufacturing and product recovery (ECMPRO): A review of the state of the art, Journal of Environmental Management, vol. 91, pp. 563-591, 2010.
Kumar, S., and Putnam, V., Cradle to cradle: Reverse logistics strategies and opportunities across three industry sectors, International Journal of Production Economics, vol. 115, pp. 305-315, 2008.
Mansour, S., and Zarei, M., A multi-period reverse logistics optimization model for end-of-life vehicles recovery based on EU directive, International Journal of Computer Integrated Manufacturing, vol. 21, pp. 14, 2008. Pagell, M., Wu, Z., and Murthy, N.N., The supply chain implications of recycling, Business Horizons, vol. 50, pp.
133-143, 2007.
Paksoy, T., Ozceylan, E., and Weber, G.W., A multi-objective model for optimization of a green supply chain network, In 3rd Global Conference on Power Control and Optimization, Gold Coast, Queensland, Australia, 2010.
Pishvaee, M.S., Farahani, R.Z., and Dullaert, W., A memetic algorithm for bi-objective integrated forward/reverse logistics network design, Computers & Operations Research, vol. 37, pp. 1100-1112, 2010.
Pishvaee, M.S., and Torabi, J.R.S.A., Credibility-based fuzzy mathematical programming model for green logistics design under uncertainty, Computers & Industrial Engineering, vol. 62, pp. 9, 2012.
Pokharel, S., and Mutha, A., Perspectives in reverse logistics: A review, Resources, Conservation and Recycling, vol. 53, pp. 8, 2009.
Srivastava, S.K., Green supply-chain management: A state-of-the-art literature review, International Journal of Management Reviews, vol. 9, pp. 53-80, 2007.
Subramoniam, R., Huisingh, D., and Chinnam, R.B., Remanufacturing for the automotive aftermarket-strategic factors: literature review and future research needs, Journal of Cleaner Production, vol. 17, pp. 1163-1174, 2009.
Tsoulfas, G.T., and Pappis, C.P., A model for supply chains environmental performance analysis and decision making, Journal of Cleaner Production, vol. 16, pp. 11, 2008.
Wu, H.J., and Dunn, S.C., Environmentally responsible logistics systems, International Journal of Physical Distribution & Logistics Management, vol. 25, pp. 19, 1995.
Zhou, Z., Cheng, S., and Hua, B., Supply chain optimization of continuous process industries with sustainability considerations, Computers & Chemical Engineering, vol. 24, pp. 8, 2000.
Biography
Mohammad Asghari completed the curriculum of University of Science and Technology on Sep. 2010 and a BSc in the field of Industrial Engineering- Industrial Production is conferred upon him which is followed by a MSc in same major from Ferdowsi University of Mashhad in 2012.His master’s research was about returns of used or end-of-life products in the collection and recycling network. In addition to the items noted briefly, he has worked as an assistant manager in a local company, Solico group of food Industries, for approximately 8 months where has recently become one of the largest dairy and processed food producers and exporters in Iran.
Salman Jameh Abrishami is a master science student in Industrial Engineering at University of Bojnourd. He has also spent a Bachelor in same major from Sajjad University of Mashhad.